Not Your Average Recession: Unwinding The Largest Financial Bubble In History
The market has clung onto any modicum of hope to avoid the pain mounting on the horizon. We explore how large the current asset bubble is, and why we think it may be a long, long way down from here.
Relevant Past Articles
Buckle Up
As with most major U.S. economic data releases these days, the short-term market direction can change on a dime. This week, the case was building and seemed rather likely for another bear market rally to take shape. Yet, the latest non-farm payroll data railroaded that case with a higher-than-expected number of jobs coming in for the month of September and a lower unemployment rate of 3.5% (down from 3.7%). It’s the “good news is bad” trend all over again as the market reprices a lower probability of an earlier Federal Reserve pivot playing out.
You know markets are unhealthy and on the edge when every major monthly data point can have such an effect. Expect another wave of volatility with one of the most anticipated CPI (consumer price index) inflation releases next week on Thursday, October 13. For the short-term trend for equities and bitcoin, that’s the only data that matters.
Take forecasts with a grain of salt but the Cleveland Fed is forecasting higher annual growth and month-over-month positive growth for every major inflation measure: headline CPI, Core CPI, PCE and Core PCE. The Fed wants to see month-over-month growth near zero or negative.
Market moves will still depend on data versus where consensus ends up. As oil prices rip higher today, it’s not the trend the Fed would want to see for the long term; for easing inflationary pressures, energy prices coming down was one of the main drivers of a lower August CPI print.
Source: Cleveland Fed Inflation Nowcasting
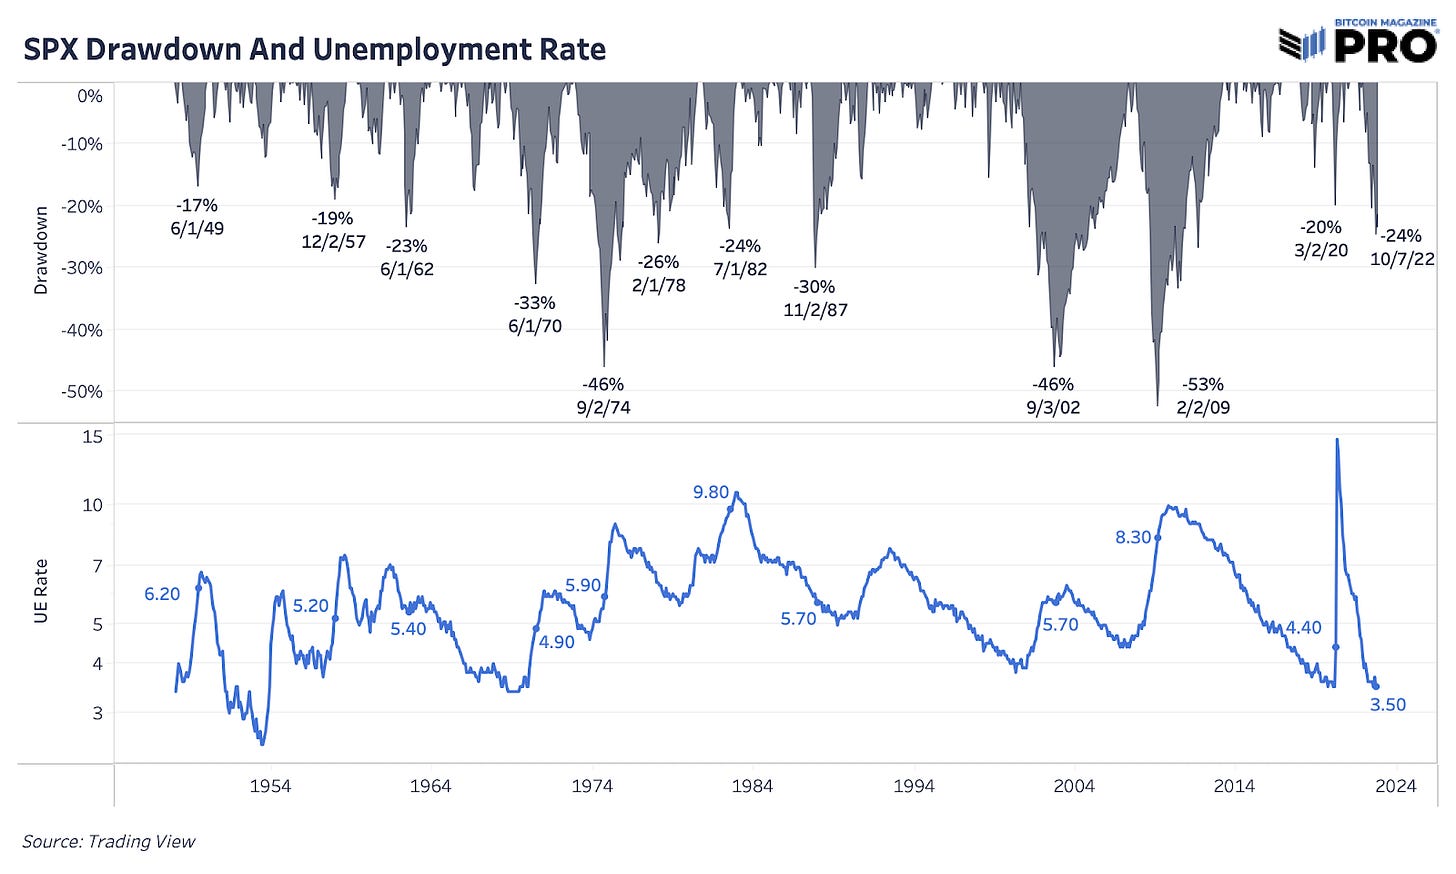
The unemployment rate is the economic cycle’s ultimate lagging indicator. But the turning point in unemployment and the subsequent rise does align with S&P 500 index bottoms and max drawdown periods. In other words, we rarely see the market bottom with low, declining unemployment like we have now. Unemployment rate along with many other metrics is the measure of “pain” that the Fed wants to see in their demand-destruction path.
Yet, they only see the unemployment rate going to 4.4% at peak in 2023 and 2024 from the 3.5% it is today — a mild rise not even worth 100 basis points. Of course, the Fed isn’t going to forecast 10% unemployment rate levels even if their models suggested that. The Bank of England forecasting a deep recession through 2023 recently was one of the first examples in history of a central bank forecasting that type of scenario (or reality).
It seems far off base, though, to think unemployment will peak at 4.4% with the speed and magnitude of current monetary policy changes. In fact, throughout history, we’ve never seen the unemployment rate increase by only one percentage point after a cyclical reversal. Arguably, we’re going through one of the fastest and most impactful cyclical reversals today. That’s where the real pain is left in this cycle. The drawdown in wealth across stocks, bonds and bitcoin is one thing; massive job loss, contracting economic growth and deflationary busts are another.
Valuing Equity Markets
In our September 30 issue, Looming Credit Default Risk And The Fall of Zombie Companies, we wrote about the increasing levels of credit risk arising across the global economy. In today’s edition, we hyperfocus on the earnings side of the equities market, given the traditional price/earnings ratio valuation many investors utilize when analyzing the equities market.
Below we share some of the most insightful charts displaying equity market valuations.
The story in 2022 so far for equities markets has been one about duration; as long-dated yields have rapidly repriced upwards, the forward price-to-earnings multiples for equity markets have fallen in tandem.
Source: Goldman Sachs Global Investment Research
In our view, what hasn’t been appropriately repriced has been the earnings component for equities markets. Forward earnings expectations are far too bullish given the historical precedent of what we are facing.
Given the near certainty of a looming global recession, we can look to previous recessions for a gauge as to what to possibly expect.
Source: Goldman Sachs Global Investment Research
The median earnings per share drawdown for S&P 500 companies during the previous 13 U.S. recessions was -13%. Current earnings consensus estimates are still positive heading into 2023.
Source: The Daily Shot
Earnings expectations have just begun to reprice lower for 2022, yet for some reason 2023/2024 estimates are still broadly bullish despite an extremely concerning market backdrop. We believe this is mispriced.
A fantastic chart from Fidelity’s Jurrien Timmer displays the revisions to earnings estimates during dollar strength and weakness from 1993. Given the dollar’s remarkable run throughout 2022, we also suspect a material amount of corporate revisions to start coming in.
Source: Jurrien Timmer, Fidelity
So what is the dollar doing today? Well… I’m sure you know, and it doesn’t usually result in good outcomes.
Related:
Related: 8/22/22 - Strong Dollar Pummels Risk Assets
We strongly believe that earnings estimates will be revised further from here, raising the multiple of equities as a result of a falling denominator in the P/E multiple.
Source: Bloomberg Intelligence
Valuations have repriced lower due to the rising yield environment, but the credit risk, which we’ve covered in-depth previously, as well as the forthcoming earnings picture lead us to believe more pain is ahead.
Source: S&P Dow Jones
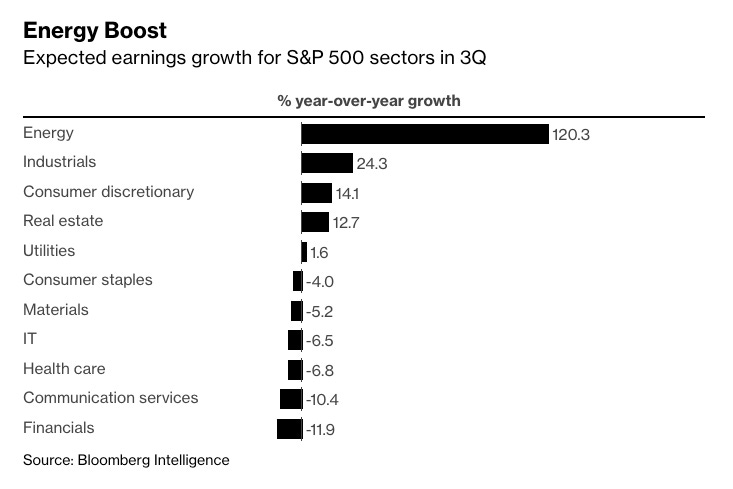
The earnings picture is uglier under the surface when you account for the fact that nearly all earnings growth has been due to booming energy prices — which isn’t consistent with a bullish economic outlook.
Source: Bloomberg Intelligence


On a similar note, we have a graphic from Patrick Saner, showing an estimate of global interest payments as a percentage of global GDP.
Source: Bloomberg Finance
Falling asset prices, soaring debt burdens, rising energy costs and a labor market that has yet to turn. It’s not a pretty picture out there, and we expect conditions in financial markets can materially worsen in short order.
Equities as a percentage of gross domestic product are still historically overvalued.
The liquidity tide is going out; the credit cycle is turning over. Our view is that these conditions will lead to dysfunction and a blowout of volatility across financial markets, and our conviction for that has only grown as of late.
The Fed, in an attempt to reign in domestic inflation, is going to break financial markets in the meantime, and the response will be a return to net easing policies.
It’s at this moment that the world will again come to appreciate the unforgeable costliness and programmatic monetary policy of bitcoin as an investable asset. While bitcoin is now simply moving in response to changes in the so-called liquidity tide, its proponents understand it is something much bigger than just a speculative asset. Rather, it is a digital age alternative to the current monetary order of central bank monstrosity.
For now, the liquidity tide is still pulling out, and for patient investors/savers, in time you will be rewarded.
Bitcoin as an asset is primed like no other to significantly outperform when a meaningful change in flows occur, and in our estimation, these flows will likely arrive with a distinct policy pivot.
In the meantime, steady lads…
Thank you for reading Bitcoin Magazine Pro, we sincerely appreciate your support! If you found this article useful, please leave a like and let us know your thoughts in the comments section. Today’s article is free to the public, so feel free to share it far and wide.


I think it's a great idea to measure market cap versus GDP. I notice in 2003 as we were leading up to the War in Iraq and people were freaking about what that would do to oil prices, the market dipped 20% below the 10 year average. I think we could have another 20% -25% dip from here. Of course the Iraq War is child's play compared with nuclear war and US v. OPEC+.
Thanks, great insights as always! Learning very much with these posts.