Just How Big Is The Everything Bubble?
We look at periods of higher equity valuations using the Shiller P/E ratio. We’re in a period of overvaluation now. In the future investors will look for alternative assets to park their wealth.
Shiller P/E Ratio
Much of our commentary since the start of this publication has been in regards to the relationship between bitcoin and equities, and their reflection of the global “liquidity tide.” As we have previously discussed, given that the size of the bitcoin market relative to that of U.S. equities is minuscule (the current market capitalization of U.S. equities is approximately $41.5 trillion, compared to $452 billion for bitcoin). Given the trending market correlation between the two, it's useful to ask just how over/undervalued equities are relative to historical values.
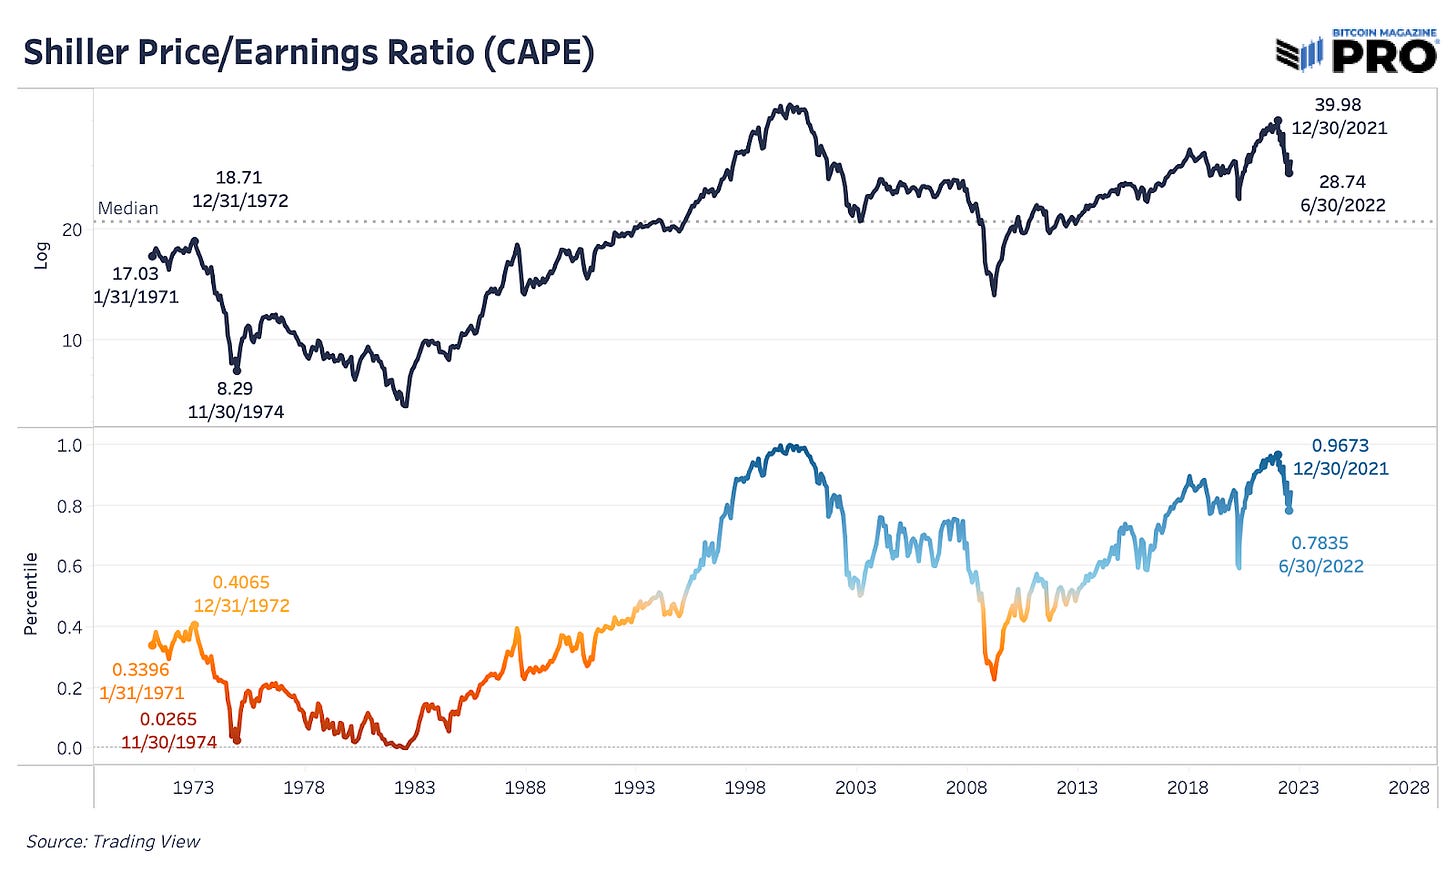
One of the best ways to analyze when the broader equities market is overvalued is the Shiller price-per-earnings (PE) ratio. Also known as cyclically-adjusted PE ratio (CAPE), the metric is based on inflation-adjusted earnings from the last 10 years. Through decades of histories and cycles, it’s been key at showing when prices in the market are far overvalued or undervalued relative to history. The median value of 16.60 over the last 140-plus years shows that prices relative to earnings always find a way to revert back. For equity investing, where return on investment is necessarily dependent on future earnings, the price you pay for said earnings is of utmost importance.
We find ourselves in one of the unique points in history where valuations have soared just shy of their 1999 highs and the “everything bubble” has started to show signs of bursting. Yet, by all comparisons to previous bubbles bursting, we’re only eight months down this path. Despite the rally we’ve seen over the last few months and the explosive inflation surprise upside move that came today, this is a signal of the broader market picture that’s hard to ignore.
Since 2009, we’ve clearly been in a trend of a more financialized Western world and an era of quantitative easing economic experiments that have had little reversion back to reality for broader valuations outside of COVID-19 in 2020 briefly. Eventually gravity will take its course and we find it likely that it will happen during this cycle.
A simple result of the ZIRP (zero interest rate policy) and QE (quantitative easing) era is higher equity multiples. Investors are willing to pay far more for every dollar in earnings if the cost of capital is effectively free (or even negative in real terms) during decades of disinflationary consumer prices. Central banks globally monetized debt at a feverish pace against disinflationary pressures, which allowed for the conditions that existed for so long to persist.
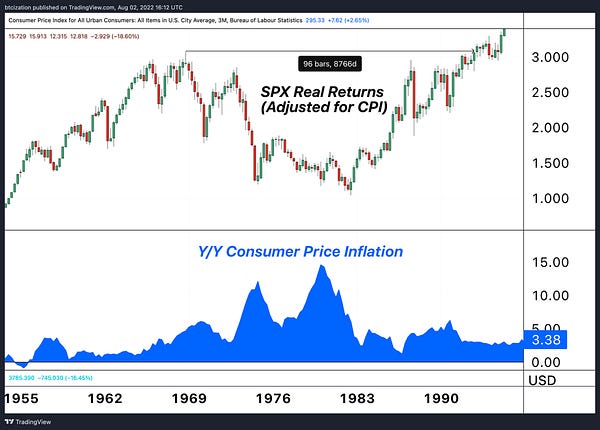
Even though today’s release of Consumer Price Index data came in at a surprising 0.0% reading month over month, year-over-year inflation is at an unpalatable 8.7% in the United States. Even if inflation were to completely abate for the rest of the year, 2022 would still have experienced over 6% inflation during the course of the year. The key here being that the cost of capital (Treasury yields) are in the process of adjusting to this new world, with inflation being the highest felt over the last 40 years, yields have risen in record fashion and have pulled down the multiples in equities as a result.
Now, let’s refer back to the Shiller P/E ratio, but with a little bit more focus. We have decided to break down the history of valuation in United State equities in two different time periods (aside from the all-time history).
The first timeframe starts in July 1944, which was when the Bretton Woods Conference took place. We believe this is an important moment in time, and was the effective start of a new global world order. The U.S. dollar, and subsequently the United States Treasury bond, began their reign atop the global capital structure.
The second timeframe which we find important starts in August 1971, when President Richard Nixon announced the closing of the gold window. This moment in time marked the start of the global fiat currency era.
Starting from 1944 and 1971, U.S. equities are in their 85.6% and 78.3% percentile of historic readings respectively. Both timeframes saw equities reach above their 96.7% percentile of historic valuation during the market peak in 2021. The fundamental question that equity investors must ask themselves is whether equities will “fall back to earth” in real terms during a potential period of stagflationary and/or repressive economic conditions.
Bitcoin doesn't have borders, neither do we. Take 10% off your tickets for Bitcoin Amsterdam (October 12-14) with code “BMPRO”: http://b.tc/conference/amsterdam
In previous monthly reports, we have covered “the macro” extensively, with a core thesis that can be summarized as follows:
Debt to productive ratios both domestically and abroad have risen to historic levels over the last 40 years.
During the same period, interest rates would fall to lower lows, to support the increasing debt, economic financialization and aging demographics.
A look at history tells us the only two ways to functionally resolve this predicament referred to in the first two points is either explicit debt default or financial repression for a sustained period of time (higher inflation than debt yields).
If we think of the potential paths going forward, with inflation being fought by the Federal Reserve with tighter policy, there is the potential for stagflation in terms of negative real growth, while the labor market turns over.
Similarly, due to the public debt dynamics, an analogous period to today could also be the 1940s, where yields on short-dated Treasurys were held below the rate of inflation to lower real debt burdens.
Source: Lyn Alden
The environment of yields below inflation allowed for the erosion of the real value of the U.S. government's public debt levels:
In either case, evaluate the performance of U.S. equities with the Shiller P/E ratio during the 1970s or 1940s, during the most recent periods of sustained high inflation and financial repression respectively. Remember, the Shiller ratio uses inflation-adjusted earnings over the previous 10 years. U.S. equities can be a good investment in nominal terms but not in real terms over the next decade, which is quite the important difference.


Looking at the relative valuation levels of U.S. equities during previous periods of high inflation and/or sustained financial repression, it is clear that equities are still near priced to perfection in real terms (inflation-adjusted 10-year earnings). As we believe that sustained financial repression is an absolute necessity as long as debt remains above productivity levels (U.S. public debt-to-GDP > 100%), equities still look quite expensive in real terms.
Either U.S. equity valuations are no longer tied to reality (unlikely), or:
U.S. equity markets crash in nominal terms to lower multiples relative to the historic mean/median
U.S. equities melt up in nominal terms due to a sustained high inflation, yet fall in real terms, thus bleeding investor purchasing power
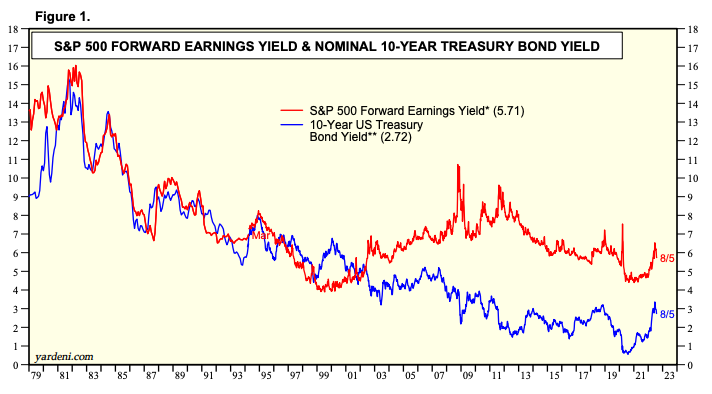
The conclusion is that global investors will likely increasingly search for an asset to park their purchasing power that can escape both the negative real yields present in the fixed income market and the high earnings multiples (and subsequently low or negative real equity yields).
* Equity yield can be calculated using an inverse of the price to earnings ratio.*
Source: Yardeni Research
In a world where both bond and equity yields are lower than the annual rate inflation, where do investors park their wealth, and what do they use to conduct economic calculation?
Our answer over the long term is simple, just check the name of our publication.
Thank you for reading Bitcoin Magazine Pro, we sincerely appreciate your support! If you found this article useful, please leave a like and let us know your thoughts in the comments section.


What inflation measure is used in CAPE? CPI is a substantial underestimate. Given a more accurate estimate of inflation the stock market may not look so overvalued