State Of The Mining Industry: Bitcoin Hash Rate On The Move
The massive growth in hash rate has some speculating on who’s behind such a sizable increase. An update of public bitcoin miners and a new metric for using hash rate to evaluate the bitcoin cycle.
Relevant Articles:
State Of The Mining Industry: Public Miners Outperform Bitcoin
Time-Based Capitulation: Bitcoin Volatility Hits Historic Lows Amid Market Apathy
This Time Isn’t Different: Miners Are Biggest Risk Facing Bitcoin Market In Repeat of 2018 Cycle
Hash Rate Hits New All-Time High: Implications For Mining Equities
Hash Rate On The Move
The Bitcoin network hash rate is on the move this year, now at an all-time high of 350 EH/s and up 36.7% YTD. Hash rate has been following the surge in price, which is the likely result of more machines coming online at a more profitable price point. In 2022, there was a lot of unused, newer inventory of ASICs that sat idle at lower bitcoin prices and have now made their way onto the network as public miners continued to expand, most noticeably in companies like Marathon Digital Holdings, Riot Platforms and Cipher Mining Technologies.
The surge in hash rate is a result of longer-term investment and expansion decisions that are now materializing after a time lag. As noted, some miners kept their machines on the sidelines while the bitcoin price was lower and less profitable to mine. Another possibility, according to an analysis from Miner Mag, suggests a high share of miner rig imports into the U.S. in January may have played a significant role in the expansion of hash rate. Those shipments have since slowed down, which may indicate an upcoming period of cooling off after this recent hash rate growth. Estimating the breakdown and contributions of factors on why exactly the hash rate is rising is always layered in nuance.
Although we’re due for another round of public miner monthly production updates over the next couple weeks, hash rate in aggregate continued to steadily rise over the last few months while bitcoin holdings continued to decline. When we use the reported numbers for public miners’ hash rate at the end of February, the 292 EH/s at the end of February and the 350 EH/s online today, we conclude that public miners make up somewhere between 20% to 25% of total network hash rate on a given day. That’s likely a low estimate considering there are some smaller public miners we’re not tracking and public miner data is released periodically.
March production updates will provide more insight on which public miners made the largest expansion moves over the last month.
Note: We’ve added more miners to these tables so the total comparison for hash rate over won’t compare perfectly with our historical data.
Many are opining on hash rate hitting all-time highs nearly day after day (when using various moving averages to account for variability), but this level of growth isn’t out of the norm for bitcoin on a historical basis — although it is quite impressive as the absolute level of hash rate reaches numbers almost unfathomable only a few short years ago.
Three-month hash rate growth is at a staggering 53%. There are only two times that can compare: the 2021 post-China-ban boom in mining and then in 2019, when there was massive growth in network hash rate after new hash rate finally came online after the orders were fulfilled from the previous bull market in 2017 and infrastructure was built out.
While most mining stocks have outperformed bitcoin by a wide margin in 2023, this can generally be attributed to two rather simple factors:
Mining equities are much more volatile than bitcoin due to various factors, including:
Public equities trading at a multiple of future cash flows (sat flows anyone?).
Potential balance sheet leverage.
ASICs and other operational infrastructure being priced as bitcoin derivatives.
Much smaller market capitalizations, less global access to capital, more illiquidity.
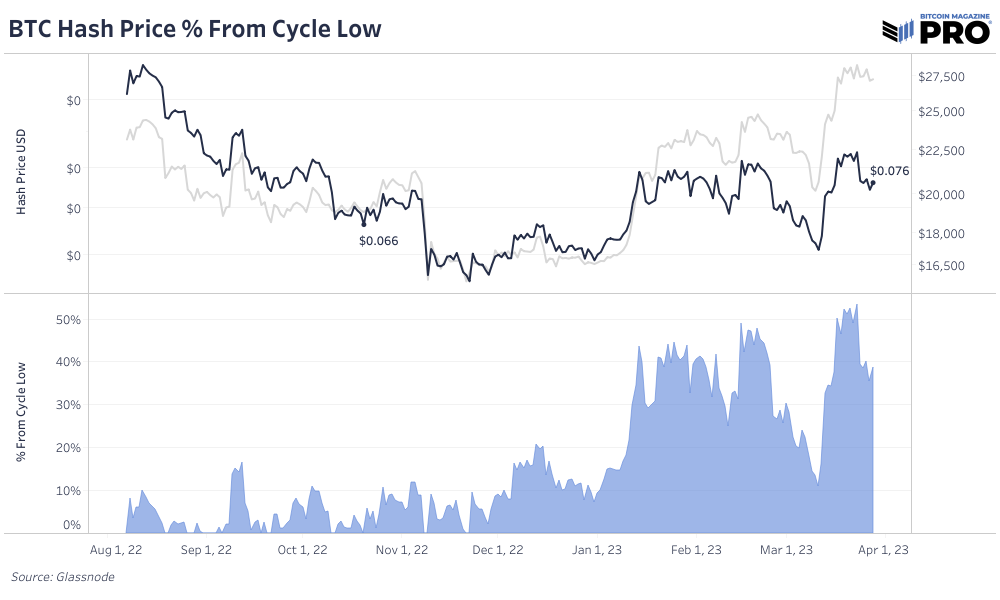
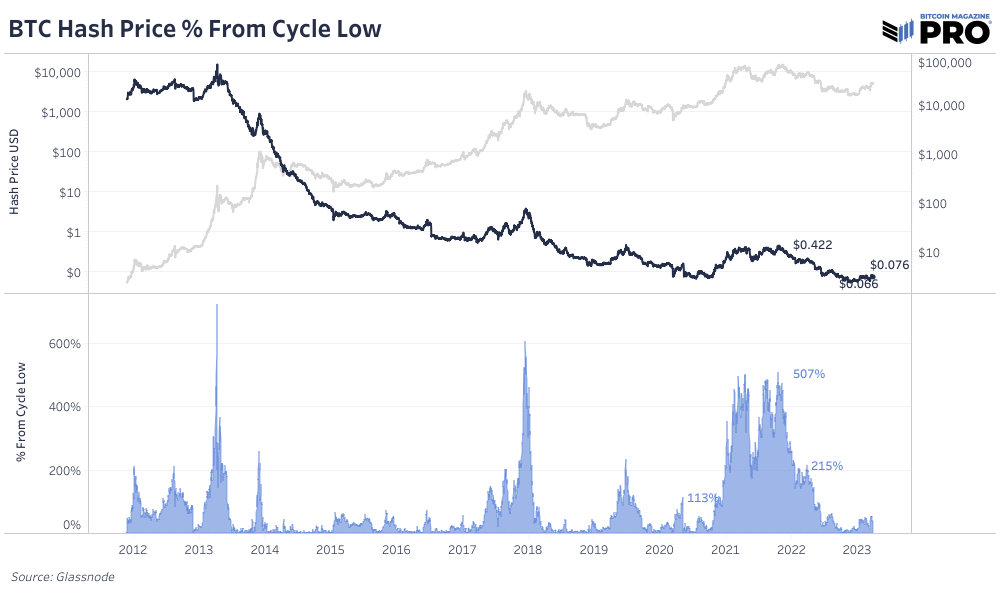
Since the start of the year, price growth has exceeded hash rate growth, meaning hash price has risen. In our mining updates, we often revisit our over-simplified framework for bitcoin mining investing:
Hash price bull market = Bitcoin miners outperform bitcoin.
Hash price bear market = Bitcoin miners underperform bitcoin.
The rest of this article is open to paying members only. Here’s what’s behind the paywall 🔏:
How hash price affects miners and public miners denominated in BTC.
A new metric for using hash rate and market cap to assess the market cycle.
A possible nation state mining operation?
We use hash price as a simple gauge for investment into the mining market due to the empirical reality that mining revenue will continue to fall (in bitcoin terms) due to the asymptotic supply issuance of bitcoin, coupled with mining difficulty that continues to soar as a result of corresponding hash rate growth. Due to these dynamics, bitcoin performance needs to be adjusted against the relative growth in hash rate. For individual companies, it is important to measure their relative hash rate against network hash rate and mining difficulty.
The performance of miners denominated in bitcoin closely correlates to the rise in hash price from cycle lows.
Hash price lows are the default in the bitcoin industry. Gains in chip efficiency and a bitcoin exchange rate that continues to trend higher on a long time horizon means that miner revenue per terahash continues to trend lower. This is a feature, not a bug, but it makes bitcoin mining an incredibly difficult industry to invest capital into because of its cutthroat nature.
The Bitcoin Yardstick
In today’s issue, we are introducing a new metric to evaluate the bitcoin cycle from a cyclical perspective: The Bitcoin Yardstick by Capriole Investments.
The metric is similar to the P/E ratio (price-to-earnings) of a stock, but instead of price to earnings, it is focusing on energy/security: hash rate relative to market cap.
The formula for the Bitcoin Yardstick is as follows:
Bitcoin Yardstick = Market Cap / (Hash rate normalized by a 2-year rolling Z-Score)
While market capitalization is circulating supply multiplied by the exchange rate, the hash rate side of the equation — which is normalized by a 2-year rolling standard deviation — is very interesting. The 2-year rolling Z-score allows for the current hash rate reading to be compared to historical values more easily. By doing so, we can quantify periods when bitcoin may or may not be cheap or expensive with a greater level of statistical precision.
“Yardstick < -1σ under the mean: This indicates that the Bitcoin network is undervalued compared to historical trends, which could be an opportunity to buy.
“Yardstick > +2σ above the mean: This suggests that the Bitcoin network is overvalued compared to historical trends, signaling caution for potential investors.
“Yardstick > +3σ above the mean: This condition represents an even more significant overvaluation, suggesting that investors should exercise extreme caution.”
With the current yardstick reading below one standard deviation from the mean, the Yardstick model suggests that bitcoin’s current market capitalization is cheap relative to the energy work conducted to secure the network.
While it is just one model, the interesting use of both bitcoin’s hash rate and market cap, along with the standardization of the data creates quite an interesting framework with fantastic historical precedent.
ASIC Prices
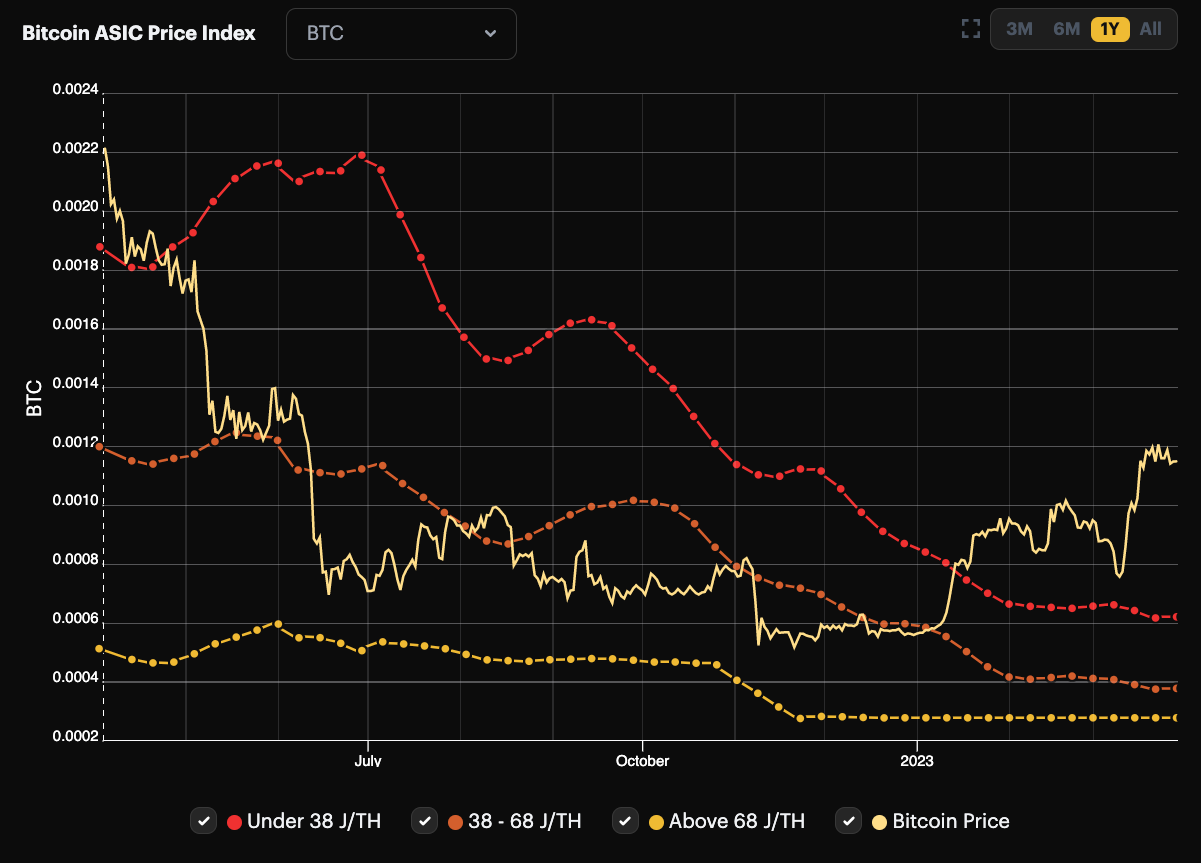
Despite the rebound in the BTC/USD exchange rate and the strong year-to-date performance in mining equities, ASIC prices have remained in the gutter, as a surging hash rate has placed additional pressure on the ASIC market. In both BTC and USD terms, the price of ASICs has essentially flatlined since the fall of 2022.
Source: Hashrate Index
Source: Hashrate Index
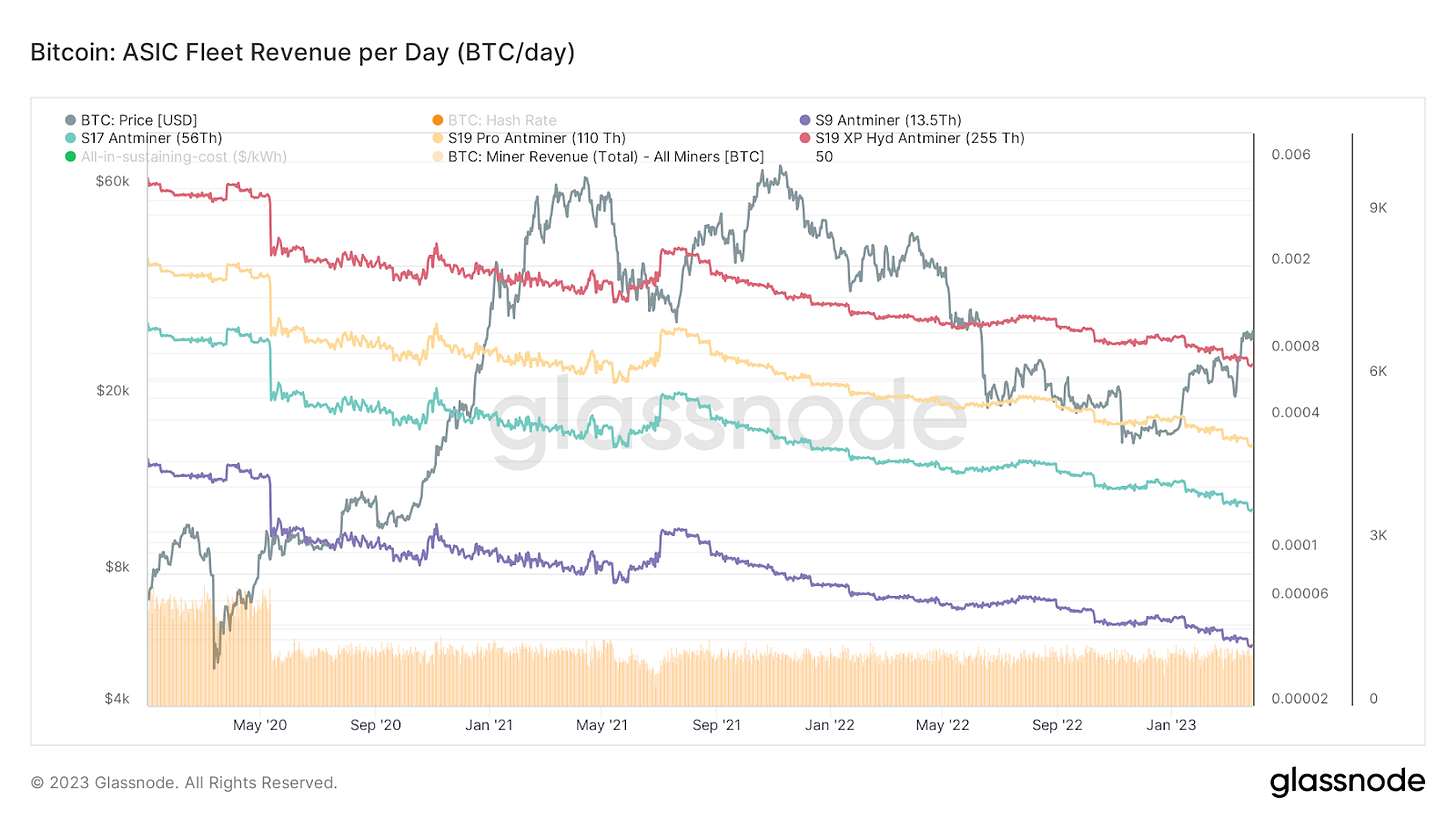
Shown below is the revenue per day in BTC terms for popular ASIC models, displaying the vast efficiency gains of the new S19 XP models, in particular.
Final Note:
There has been speculation about the recent jump in hash rate, with some on social media pontificating about a potential operation at the nation state level. Needless to say, we are skeptical of some of these theories. Nearly 100% of the current total hash rate is mining in identifiable mining pools. If a nation state mining operation was being deployed at scale, it is likely they would operate in a sovereign mining pool or one attributed to a specific country outside the United States, whereas many mining pools are made up of miners from all around the world. This assessment may prove incorrect later down the line, and we will be more than willing to admit our misjudgment, but this recent growth doesn’t seem to be a nation state based on the data we are observing.
A more simple explanation for why the bitcoin hash rate looks to be going parabolic in recent months is that many participants simply forget to set their charts to logarithmic scale.
Thank you for reading Bitcoin Magazine Pro, we sincerely appreciate your support! Please consider leaving a like and letting us know your thoughts in the comments section. As well, sharing goes a long way toward helping us reach a wider audience!


