Part 2: The Everything Bubble - Markets At A Crossroads
After Jerome Powell’s Brookings Institution speech, markets are caught in the middle. Participants are trying to sniff out the first signs of a pivot. Is the bottom in or is more pain on the horizon?
Relevant Past Articles:
Part 2 of “The Everything Bubble: Markets At A Crossroads” published Thursday, December 1, for paid subscribers.
Part 2
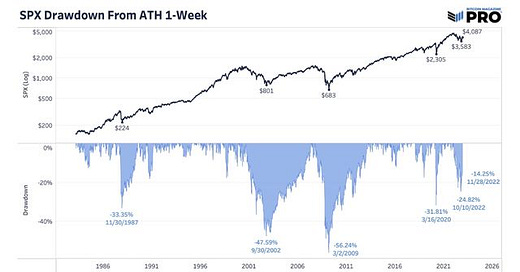
The S&P 500 index reached a peak drawdown from all-time high of 24.82% so far and is currently 14.25% down from all-time highs during the popping of the great everything bubble in a once-in-a-century macroeconomic environment. Either we’re already out of the woods and into a new paradigm of capped downside or we’ve yet to enter the real painful period of this cyclical unwind.
We’ve still yet to see a real blowout in stock market volatility which has always impacted bitcoin. It’s been a core part of our thesis this year that bitcoin will follow traditional equity markets to the downside.
The Federal Reserve’s preferred measure of inflation also came out today, showing the second-lowest monthly rise in core personal consumption expenditures (PCE) this year at 0.2%. The annual inflation rate is still at 5% which is what the Fed says they want to see come down but 0.2% monthly growth is consistent with a 2% path if it holds. In short, today’s print is only one sign of many that the Fed will want to continue to see play out in the coming months. One data point does not make a trend. The preferred view of this data is the three-month annualized trend which is still showing acceleration.
Markets continue to favor a higher rate hike chance of 50 bps instead of 75 bps for the December FOMC meeting while the eurodollar curve shows current market implications of a terminal rate of 5% to peak in March 2023. All of this can quickly change if we’re to see a higher core PCE monthly print for the November data.
Source: Bloomberg, Liz Sonders
Source: BEA
Long-duration Treasurys have rebounded +10.2% from year-to-date lows, after falling -38.65% from historic all-time highs.
While the rebound is notable, we want to continue to highlight the significance in size of the drawdown in U.S. government long-duration debt in inflation-adjusted terms. Shown below is the popular long-term government bond ETF $TLT, with dividends — coupon payments issued by the U.S. Treasury given to you in a fund structure — re-invested, adjusted for the U.S. CPI inflation.
The magnitude of the long-duration debt in REAL terms was, and still is, the biggest story here.
Furthermore, what does this mean going forward for asset valuations?
Below are four previous articles of ours relevant to the matter:
Despite the recent bounce in stocks and bonds, we aren’t convinced that we have seen the worst of the deflationary pressures from the global liquidity cycle. We think there is a meaningful probability that this is just another bear market rally in global risk assets, as deteriorating economic data is just starting to get priced into conditions.
From a bitcoin-native standpoint, the capitulation has been real. Next week, we will cover bitcoin-specific dynamics including mining, exchanges, on-chain and derivative dynamics.
This concludes Part 2 of “The Everything Bubble: Markets At A Crossroads” published Thursday, December 1, for paid subscribers.
Try a 30-day free trial of the Bitcoin Magazine PRO paid tier to receive all of our articles in full as they go live.
Thank you for reading Bitcoin Magazine Pro, we sincerely appreciate your support! Please consider leaving a like if you enjoyed this article. As well, sharing goes a long way toward helping us reach a wider audience!


