This month, we’re releasing the monthly report across both PDF and Substack options. Click the “Read Now” button below to access the full report PDF.
If you have any issues viewing this report through e-mail or mobile, you can view the full report on Substack here.
PREPARED BY:
Dylan LeClair, Head of Market Research
Sam Rule, Lead Analyst
Summary:
Crypto Implosion
LUNA/UST Collapse
Crypto Market Cap Destruction
Capitulation Volume Spike
Derivatives Overview
On-Chain Analysis
Mayer Multiple, Reserve Risk
MVRV Z-Score, Realized Price
HODLer Cost Basis Analysis
Macro Landscape
Macro Correlations Holding Steady
CPI Inflation, Fed Policy
Forward Economic Trajectory
Monetary Tightening Endgame
Bitcoin Mining
Hash Rate, Difficulty
Hash price, Miner Revenue
Puell Multiple, Miner Profitability
Executive Summary
We take a three-pronged approach to market analysis at Bitcoin Magazine Pro. For those who are already familiar with our process and product, all analysis is approached from the view that bitcoin is fundamentally the best monetary asset the world has ever seen. From there, we use the transparency of the Bitcoin UTXO set, the ever-changing derivatives market, and the increasingly volatile macro backdrop to help readers evaluate and contextualize the current state of the bitcoin market.
Throughout 2022, much of our focus and analysis has been around the global macro environment which has seen the highest consumer price inflation readings in four decades, leading to a deteriorating liquidity backdrop and the worst-ever year-to-date performance of the 60/40 equity/bond portfolio weighting. With the deteriorating liquidity environment, bitcoin has also fallen, often trading near 1:1 with the Nasdaq 100 tech index.
Along with the blowup of a major cryptocurrency and algorithmic stablecoin, this correlation led to a quasi-capitulation event for “crypto natives.”
In this report we will use a wide variety of data to articulate our view that bitcoin is objectively extremely cheap at current levels, along with reiterating our core thesis that it is the asset to own near the conclusion of the long-term debt cycle.
Crypto Implosion
While the macro correlations have been the dominant narrative year-to-date, in the bitcoin/broader crypto market every so often there are events that in hindsight are viewed as obvious market tops or bottoms. While it would be wrong to say that absolutely anything in this space is for certain, the LUNA/UST post mortem, and the second-order effects of its collapse, certainly look like one of those obvious moments in hindsight.
The most striking data point we see is the amount of coins that traded hands during the crash, with perpetual swap trading volume across exchanges touching levels only seen during the March 2020 and May 2021 market crashes. Similarly, spot trading volume on Coinbase (the dominant U.S. spot exchange by volume) hit levels only seen three times in history.
With the LUNA/UST crash and the subsequent liquidation of assets by many funds, the overall crypto market cap fell by as much as $570 billion dollars in a span of just six days, from May 7 to May 12.
While there are certainly flaws with measuring the value of the total cryptocurrency market by simply adding up the sum of all tokens and multiply by their circulating supply (because of the illiquidity of many alt tokens), the purpose of stating this figure is to highlight the vast amount of paper (rather: digital) wealth destruction that occurred following the LUNA debacle.
If the May low was a local or even an absolute bottom, it was different from those of the past, with a majority of selling pressure coming from spot markets rather than forced selling in the form of margin calls/derivative market liquidations.
While funding rates did go negative (price of perpetual swap contracts were below that of spot markets), it wasn’t as severe as previous market bottom events.
One of the primary reasons for why this selloff in particular wasn’t as explosive as previous liquidation events was the structural change in the bitcoin derivatives market that has been underway for the last year. The collateral underlying derivative contracts has shifted from 70% bitcoin margined, to just 40% with the other 60% being collateralized with stablecoins such as USDT.
Lastly, while the options market is a bit more esoteric, we can observe the 25-delta skew, which in layman’s terms measures the relative premium placed on put and call options. When the figure is positive, it shows that options traders are willing to pay more for downside protection in the form of puts; when the delta skew is negative, it shows that calls are more expensive (higher implied volatility).
While it’s not our intent to go fully into the weeds on the dynamics of the options market, the main takeaway is to highlight the feverish demand for downside protection during market sell-offs, while also displaying the demand that call options garner during speculative frenzies at market tops. Thus, the relative richness of put options during the market sell-off was quite notable, as it’s the highest reading seen in the history of the data.
One of the best strategies in any market, but specifically in the still nascent bitcoin market, is to back up the truck to buy when others become forced sellers. This often comes in the form of liquidations in the derivatives market, with spectacular unwinds coming sporadically once or twice a year. While this specific market event wasn’t the usual derivative market liquidation event, there was the forced liquidation of the Luna Foundation Guard’s multi-billion dollar bitcoin stash, along with the sell pressure that came from other crypto funds.
Market Cycle Dynamics On-Chain
Our cyclical indicators use both price as well as on-chain dynamics to gauge bitcoin’s relative valuation compared to historical standards. With there being plenty of variables to account for, we find that many of the cyclical indicators do a great job of stripping back all of the noise, sentiment and narratives to objectively display whether bitcoin is relatively cheap or relatively expensive.
The Mayer Multiple, coined by Trace Mayer, simply evaluates the bitcoin price relative to its 200-day moving average. Historically, any reading below 0.8 has served as a tremendous buying opportunity. The current Mayer Multiple reading is in the ninth percentile of historical readings.
The RHODL Ratio takes the ratio between the realized market capitalization of bitcoin, one-week and 1-2 years old. In simple terms, it evaluates how top-heavy the market is using the transparency of the bitcoin blockchain.
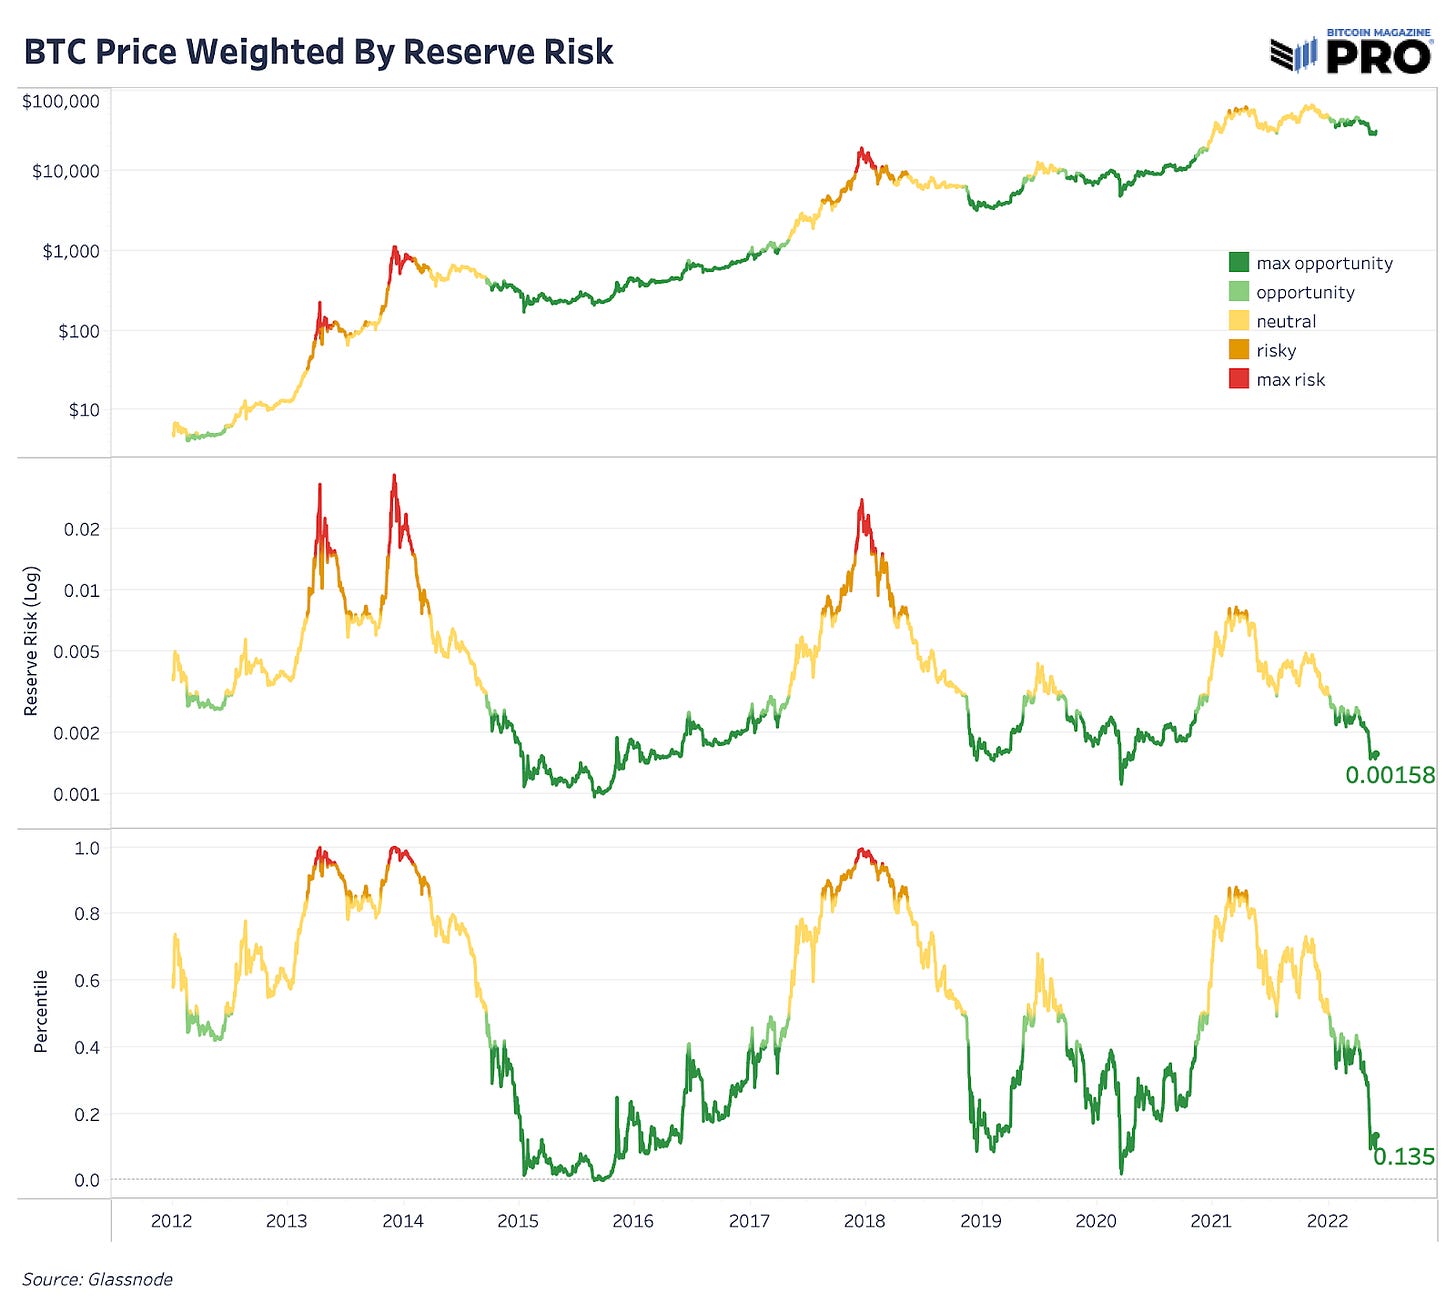
Reserve Risk, one of the most comprehensive on-chain indicators, evaluates price relative to holder confidence. A full write-up and technical explanation of the metric can be found here.
In simple terms, when confidence is low (HODLers dumping) and price is high, risk/reward is skewed to the downside. When Reserve Risk is low, confidence is high (HODLers not selling) and price is low — risk/reward is very attractive.
Reserve Risk is currently in its 13th percentile of historical readings.
The realized price is the average cost basis of all bitcoin as they last moved on-chain, and is one of the best metrics for visualizing the monetization process of bitcoin. Looking at the rate of change of realized price is a great way to view which phase of the cycle bitcoin is in, and what is “fair value” for the average holder.
Currently, the realized price is $23,710 and has fallen over the recent month as buyers have capitulated below their cost basis.
Another fantastic way to visualize the bitcoin cycle is through the Market Value To Realized Value Ratio, a favorite in our analysis. Going back to late 2021, we have been fixated on the realized price level of $25,000 (the realized price level is now $23,700 due to realized losses) as a fantastic entry point if a global deleveraging event in legacy markets took place. A revisit to the realized price has occurred in almost every bear market cycle, and while it isn’t assured to happen again, limit buy orders are certainly a sound strategy for a proportion of your undeployed capital.
The MVRV Z-Score calculates the standard deviation of the metric for a similar signal, currently in the 29th percentile of historical readings.
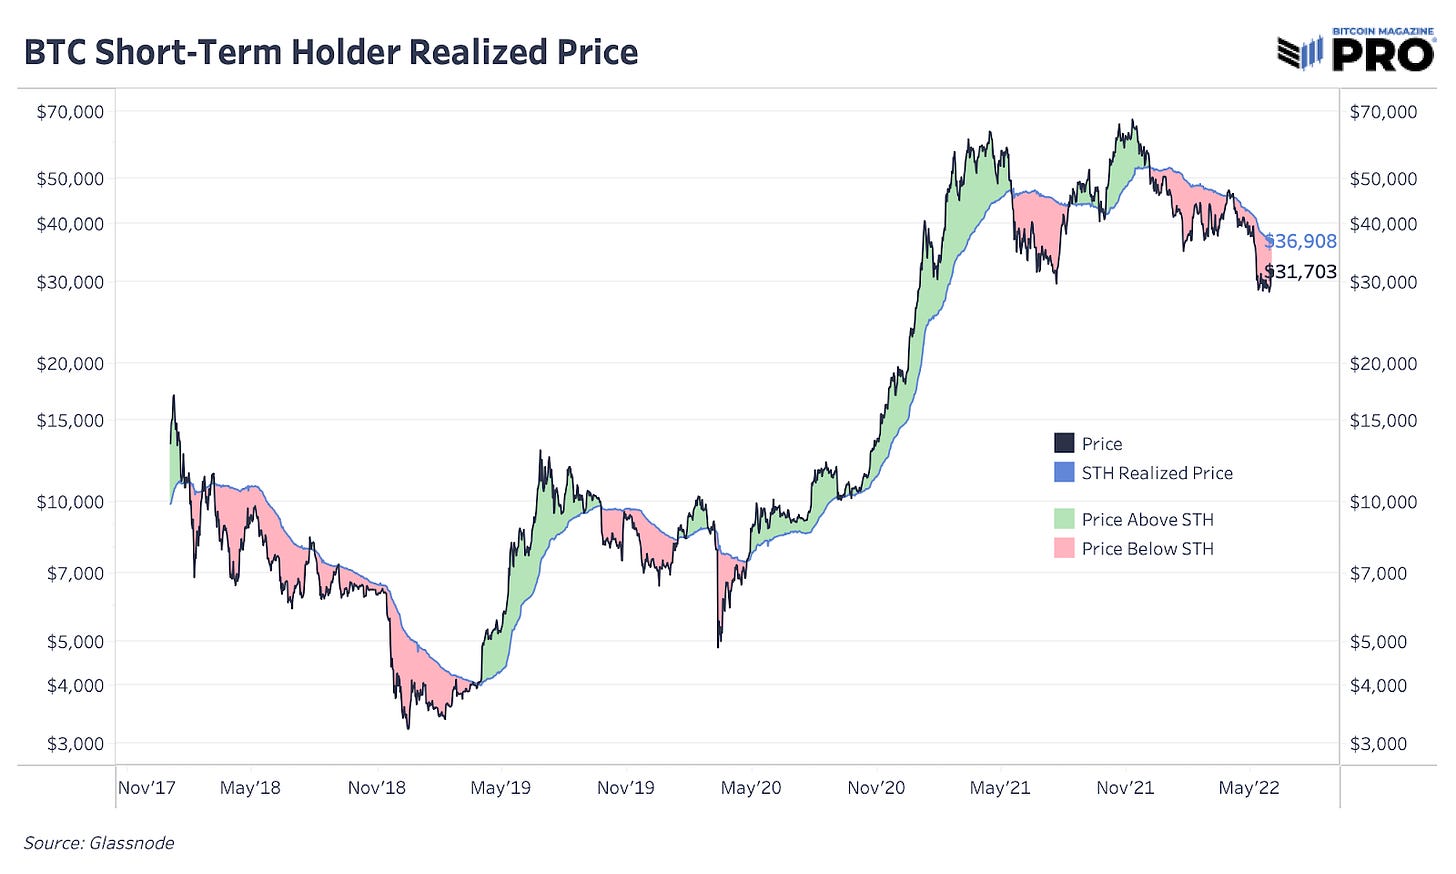
We also look at the breakdown of long-term and short-term holders and their respective realized price levels. Using the cost basis of long- and short-term holders can provide insight into investor activity.
Note that LTH Realized Price was recently impacted by a bug by our data provider which has now been fixed.
With short-term holder cost basis, we can see whether recent investors, in aggregate, are in the money or under water on their recent purchases. A key dynamic of a bull/bear market is whether short-term holders are above/below their average cost basis. When above, new money has to competitively bid up price to secure an allocation; when below, underwater positions capitulate and redistribute. Read “Short-Term Holder Analysis” for an in-depth explanation of this dynamic.
This dynamic is particularly useful for swing/momentum traders looking to ride the tide of the bull/bear cycle.
Similarly, we have STH LTH Cost Basis Ratio, a ratio of the cost basis between short-term holders and long-term holders. When trending upwards, the cost basis of STHs is appreciating relative to that of LTHs, a bullish market dynamic. When trending downwards, the cost basis of STHs is falling relative to that of LTHs, a bearish market dynamic. The STH LTH Ratio is historically one of the most accurate signals in a bitcoin market cycle.
While the current trend is “bearish,” it is important to understand that these are the best times to acquire bitcoin, whether through passive DCA or strategic limit buy orders (or both).
For a more in depth explanation of the metric, read “Short-Term: Long-Term Cost Basis Ratio.”
Almost all of the primary cyclical on-chain indicators we use are flashing increasing strength as bitcoin trades around the $30,000 level. The pros and cons of these indicators is that there is no context provided except the pure numbers/data itself, which strips away all nuance around the current macroeconomic backdrop.
While this may give readers cause for some pause, we believe that much of the worst has been priced into the market already at this time, with bitcoin’s asymmetry of future potential returns as advantageous as it’s been since 2020.
Macroeconomic Backdrop
The most blatant narrative for bitcoin is that it’s simply an ultra-speculative asset, similar to tech stocks, which is why bitcoin has been nearly 1:1 correlated to the Nasdaq tech index. While it is true that bitcoin has been trading like a 24/7/365 inverse VIX over the course of 2022, it is a development that was not entirely unpredictable. In our July 2021 Report, in a heading titled “Long Everything Bubble = Implicitly Short Volatility,” we covered this key concept.
“While it may or may not be becoming increasingly obvious that we are in some form of “everything bubble” across asset classes, the question that should be on the mind of every investor is: Where can I hide?”
We’ll come back to this question.
The current macroeconomic backdrop has been one of the most challenging landscapes for investors to navigate in decades. The combination of accelerating inflation and record-low interest rates has caused a world of pain for all investors who have become accustomed to a Federal Reserve backstop for a greater part of the last two decades.
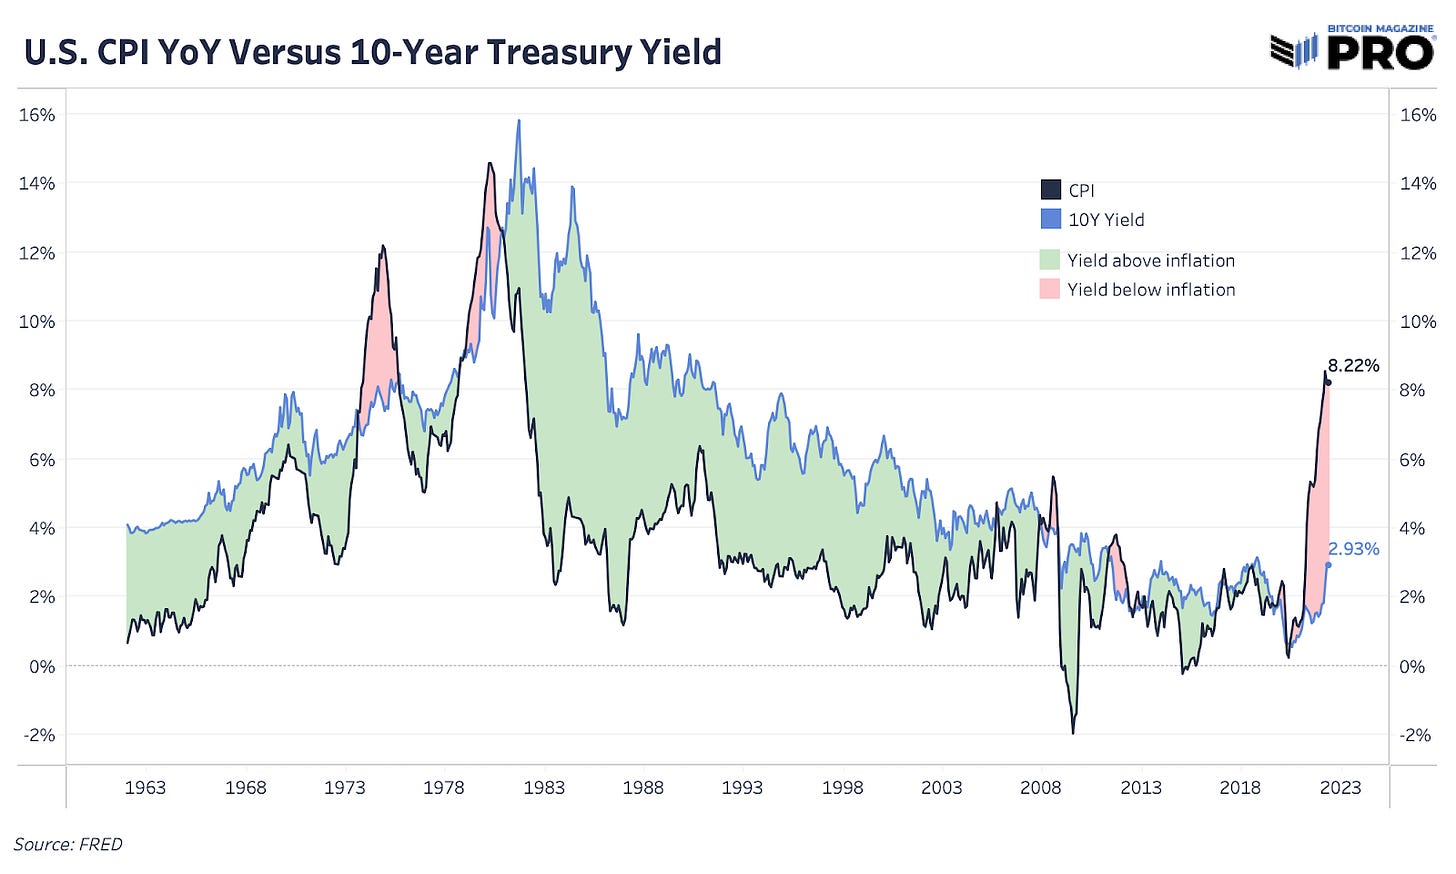
The Fed has now changed its stated goals, with its primary focus on getting a handle on the year-over-year inflation readings that have far overshot their 2% target, with the remedy being a hike of the Federal Funds Rate to “above neutral.”
“If that involves moving past broadly understood levels of neutral we won’t hesitate to do that. We will go until we feel we’re at a place where we can say financial conditions are in an appropriate place, we see inflation coming down… We’ll go to that point. There won’t be any hesitation about that,” - Federal Reserve Chair Jerome Powell
The Fed is attempting to engineer a reverse wealth effect in order to dampen consumer spending and activity, which subsequently would rein in inflation. Month-over-month CPI readings will be a major tell on this front with the latest month-over-month reading accelerating, a sign that the Fed has much more demand destruction to attempt.
While financial markets have fallen markedly since the Fed’s policy stance shift in November, where they distanced themselves from the word transitory and stated their intentions to address inflation, the situation is very different from that of previous tightening cycles. In the 1970s, Fed Chair Paul Volcker famously raised benchmark rates up to 21.5% to stamp inflationary pressures.
However, today is much different from the 1970s, with the largest difference being that debt levels, most importantly U.S. Federal Debt to GDP, is at historic levels.
The implications are that Treasury yields (2.93% US10Y) cannot meaningfully rise from the level of where they are today without collapsing the credit-based economy. In our February Monthly Report, we covered some of the first-order and second-order effects of the Russia/Ukraine conflict, and its direct impact on global energy and commodity markets. While there is plenty of nuance around the exact implications of the conflict, what is known is that it is disastrous for citizens’ pockets and policymakers’ approval ratings.
While the U.S. is in a better position relative to most nations in the world due to its role as the issuer of the world reserve currency, there is little policymakers can do to meaningfully lower the price of energy, even with a collapse in demand which is what the Federal Reserve is intending to accomplish.
The current regime of monetary tightening likely ends with a collapse in:
Financial markets.
Consumer spending.
Emerging market currencies against the dollar.
A massive response from U.S. policymakers following intense pressure to act.
While the order of operations is not entirely known, the reality is that a global economy engorged in dollar-denominated debt cannot handle sustained periods of both high interest rates nor sky-high energy prices, which both cause economic activity to slow, while foregin economies are massively short dollars. This short dollar position, while economic activity is grinding to a halt globally, is what leads to the collapse in exchange rates relative to the USD, and what will worsen the global recession yet to come. The response, in some form, will be stimulative fiscal/monetary policy in the United States, even in the face of soaring energy/food prices. It’s important to remember that the vast amount of energy and food consumption are price inelastic, i.e., you still need to put food on the table, and that food requires a whole lot of energy to arrive at your table in the first place.
This far along the debt cycle, the economic endgame is binary. The first option is a deflationary collapse, where a soaring currency value leads to mass insolvencies and soaring counterparty risk. The second option is (in theory) infinite monetary debasement. While this sounds hyperbolic, the nature of a credit-based fiat monetary system where every unit of currency is lent into existence requires perpetual monetary expansion.
Policymakers have a hammer, and everything looks like a nail. The U.S. government will spend, and someone will have to finance it (cough, cough, Fed).
All roads lead to monetary easing.
Returning to Bitcoin
While the past six months have led to a steep drawdown in the price of bitcoin, a core understanding of the economic endgame, a detailed view of the historical cyclicality of a bitcoin market cycle, and a competent view of the Bitcoin protocol layer leaves one with more conviction than ever.
To again quote our July 2021 Report,
“With bitcoin, you not only have the assurance of 21,000,000 forever, but you also have the ability to securely store your wealth without the counterparty risk that has haunted those who grew to trust banking institutions throughout modern history.
With bitcoin, you hold an insurance contract on the entire game, that you only have to pay for once, and which never expires.
We happen to think that alone is worth immense amounts of value”
Actionable Information
Disclaimer: Not financial advice.
Expect volatility over the coming months. The rut in bonds and equities is likely not over, and the next leg of the global economic slowdown will be seen through interest rates, corporate earnings and credit spreads. Steady economic deterioration is already underway, and it’s likely to worsen with far more speed and velocity than many policymakers expect.
The time is now for bitcoin accumulation. Spare cash should be deployed through a mix of passive allocation strategies (dollar-cost averaging) as well as scaled limit orders to achieve the best possible exchange rate.
A key point to understand is that when the inevitable turnaround in monetary policy comes, bitcoin is primed to fly like few market participants are expecting.
No allocation is the riskiest position you can have.
Bitcoin Mining
In our April Monthly Report, we highlighted the case for more Bitcoin mining capitulation unfolding as price turns over, hashrate expansion for the year continues, energy prices rise, hash price falls and public mining equities continue their 70%-plus drawdowns from all-time highs.
After reaching an all-time high of 226 EH/s earlier in the month, hash rate has come down to 217 EH/s after a capitulation-like spike lagging behind price. Still 25.45% growth on the year, hash rate continues to rise but now at a 61% annualized pace — which would put the hash rate around 279 EH/s if this trend continues (below many optimistic estimates for 300 EH/s at the end of the year).
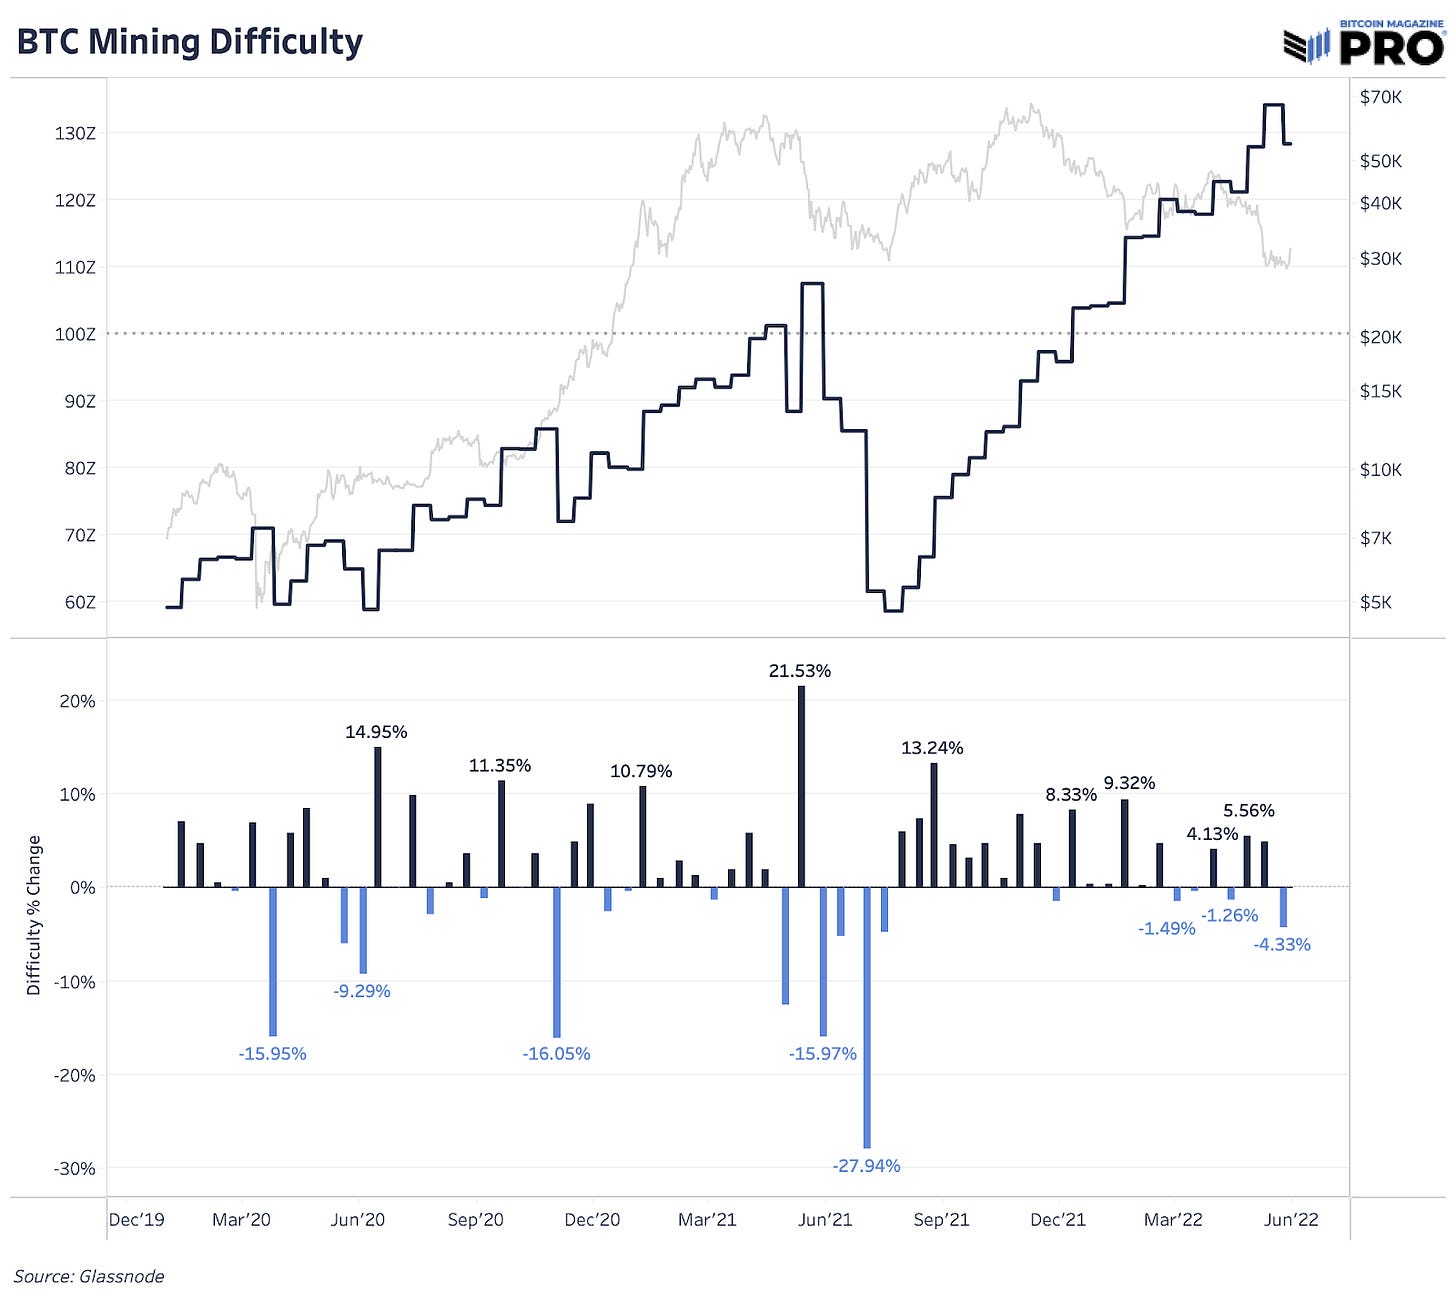
Falling hash price following a fall in bitcoin price and rising difficulty adjustment continues its free fall from over $0.42 at 2021 peak, down to $0.137. Some relief has come to miners with the latest downward network difficulty adjustment of 4.33%, the largest decline over the last year.
As we highlighted recently in our issue, “Mining Equity Performance Cycle,” public mining company equities continue to follow bullish and bearish dynamics in hash price. Although public miners have much lower bitcoin production costs than the overall market, there will be mining operations with older, less efficient machines, higher energy costs and less effective cash flow that will have to turn off or shut down completely if price is to remain in this range and trend lower. S9 machines, which are estimated roughly to account for 25% of all network hash rate, are near break-even operating prices assuming $0.05 kilowatt-hour electricity costs and current level of hash rate.
As for risks to larger industrial-scale public miners, we’re likely to see a continued trend of less produced bitcoin being added to treasuries and an impact on hash rate expansion plans depending on the health of specific miner financial conditions. Some miners have shown glimpses of this in recent financial updates with Riot selling more of their production bitcoin in April and Core Scientific downgrading 2022 hash rate projections to 32 EH/s from 42 EH/s, citing a challenging capital environment.
In the latest March monthly production data, bitcoin treasuries largely increased month over month while there was an increase in selling more of miners’ produced bitcoin. On another note, both private and public miners have used both bitcoin and ASIC machines as collateral to secure financing at relatively high interest rates in 2021, which is a key dynamic to pay attention to as margins fall and available credit tightens.
Using Glassnode’s estimated data for bitcoin sent from miners to exchanges as proxy data for total miner selling pressure, we’ve seen a slight increase in this transfer volume on a 30-day cumulative basis. As one miner example, Cathedra Bitcoin sold most of their bitcoin holdings this month, citing measures to prepare for a prolonged market downturn, to raise and conserve cash, reduce risk and strengthen its balance sheet.
None of the mentioned examples are meant to highlight any one company in particular but more to provide context of market dynamics and headwinds that are unfolding for the broader industry.
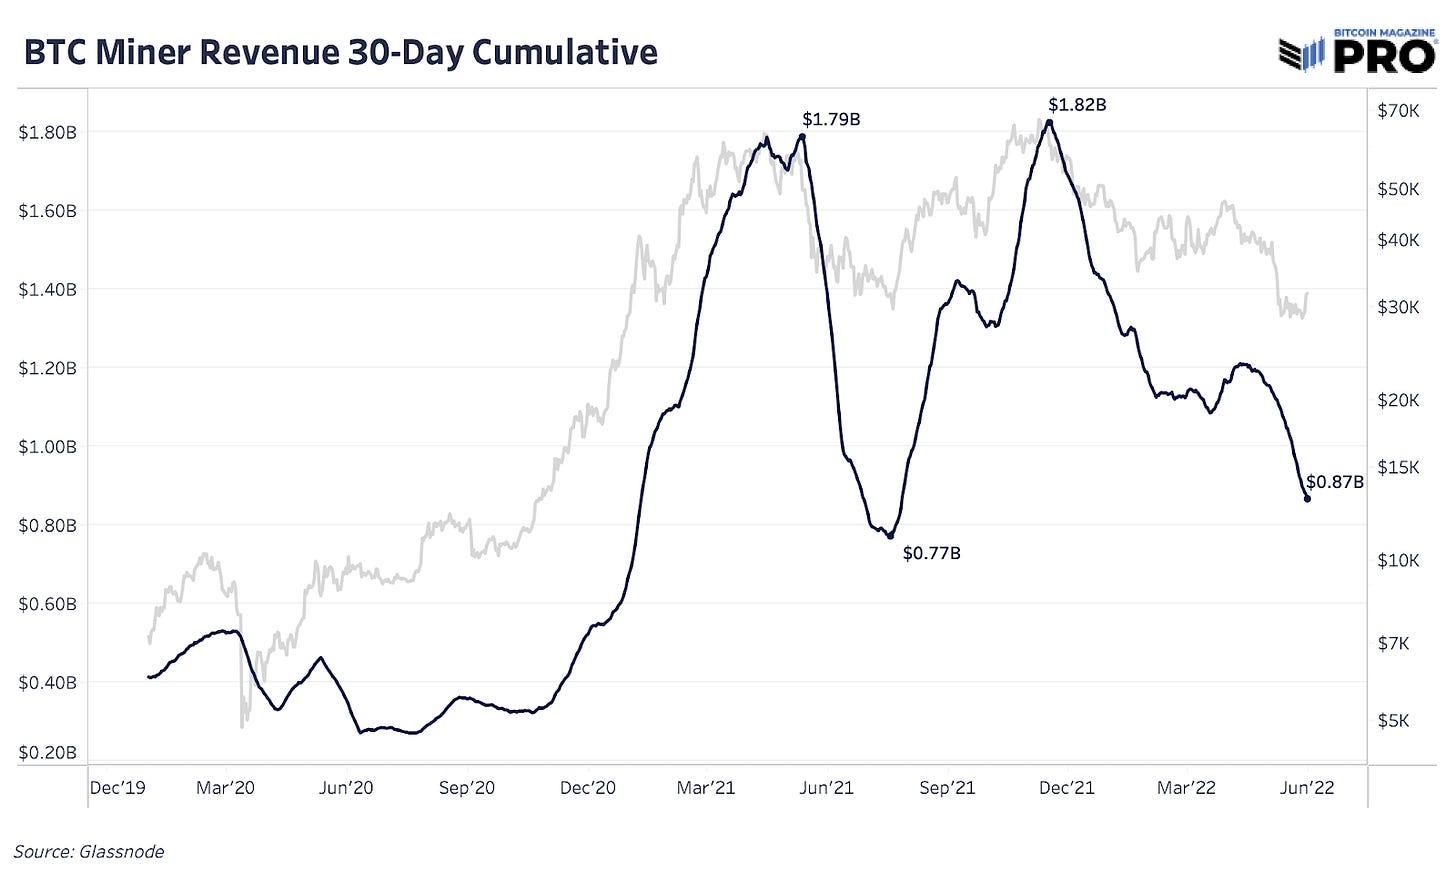
Lastly, the Puell Multiple which tracks miner USD revenue relative to the rolling 365-day miner revenue average, shows current revenue at 72% relative to the annual average. Said otherwise, what revenue miners are taking in today is much lower than the revenue taken in over the last 365 days. Sustained periods of this playing out in bear-like markets have resulted, and likely will result in, increased miner capitulation. Over the last 30 days, total cumulative miner revenue is below $1 billion and now trending towards June 2021 lows.










nice analysis sirs🤝