This month, we’re releasing the monthly report across both PDF and Substack options. Click the “Read Now” button below to access the full report PDF.
If you have any issues viewing this report through e-mail or mobile, you can view the full report on Substack here.
PREPARED BY:
Dylan LeClair, Head of Market Research
Sam Rule, Lead Analyst
Summary:
On-Chain Market Dynamics
On-Chain Cyclical Indicators
MVRV, Realized Price To Liveliness Ratio
Last Active Supply, Adjusted Supply
LTH Capitulation And Accumulation, Exchange Balances
Whale Accumulation And Purpose ETF
Bitcoin Derivatives
Perpetual Swaps Market Funding Rate
Futures Open Interest, Perpetual Futures Open Interest
Stablecoin Margin And Stablecoin Supply
Bitcoin Mining
Hash Rate, Hash Price, Difficulty
Miner Capitulation, Puell Multiple
Bitcoin Production Cost, Bitcoin Energy Value
Macro Landscape
U.S. Treasury Yields, Fed Funds Rate Projections
BTC VIX Correlation, High Yield Credit Spreads
BTC DXY Correlation, Concluding Thoughts
Executive Summary
Markets have continued selling off throughout April across credit and equity, bitcoin included. Now down 43% from the all-time high, bitcoin continues to make higher lows in the face of a major macro credit deleveraging scenario unfolding. Compared to the drawdowns in various equity indexes and tech stocks, bitcoin still trades like a high beta risk-on asset, but it has held up surprisingly well when comparing all-time high and year-to-date drawdowns.
Zooming out, a logarithmic view of bitcoin’s average price by quarter shows that adoption and monetization carries on. Even with market liquidity fading and a bearish market scenario looming, long-term holders and investors continue with accumulation opportunities like they have every cycle. March and April were the second and third-largest outflow months for bitcoin leaving exchanges, hash rate reached new all-time highs, and another sovereign nation, Central African Republic, adopted bitcoin as legal tender.
On-Chain Market Dynamics
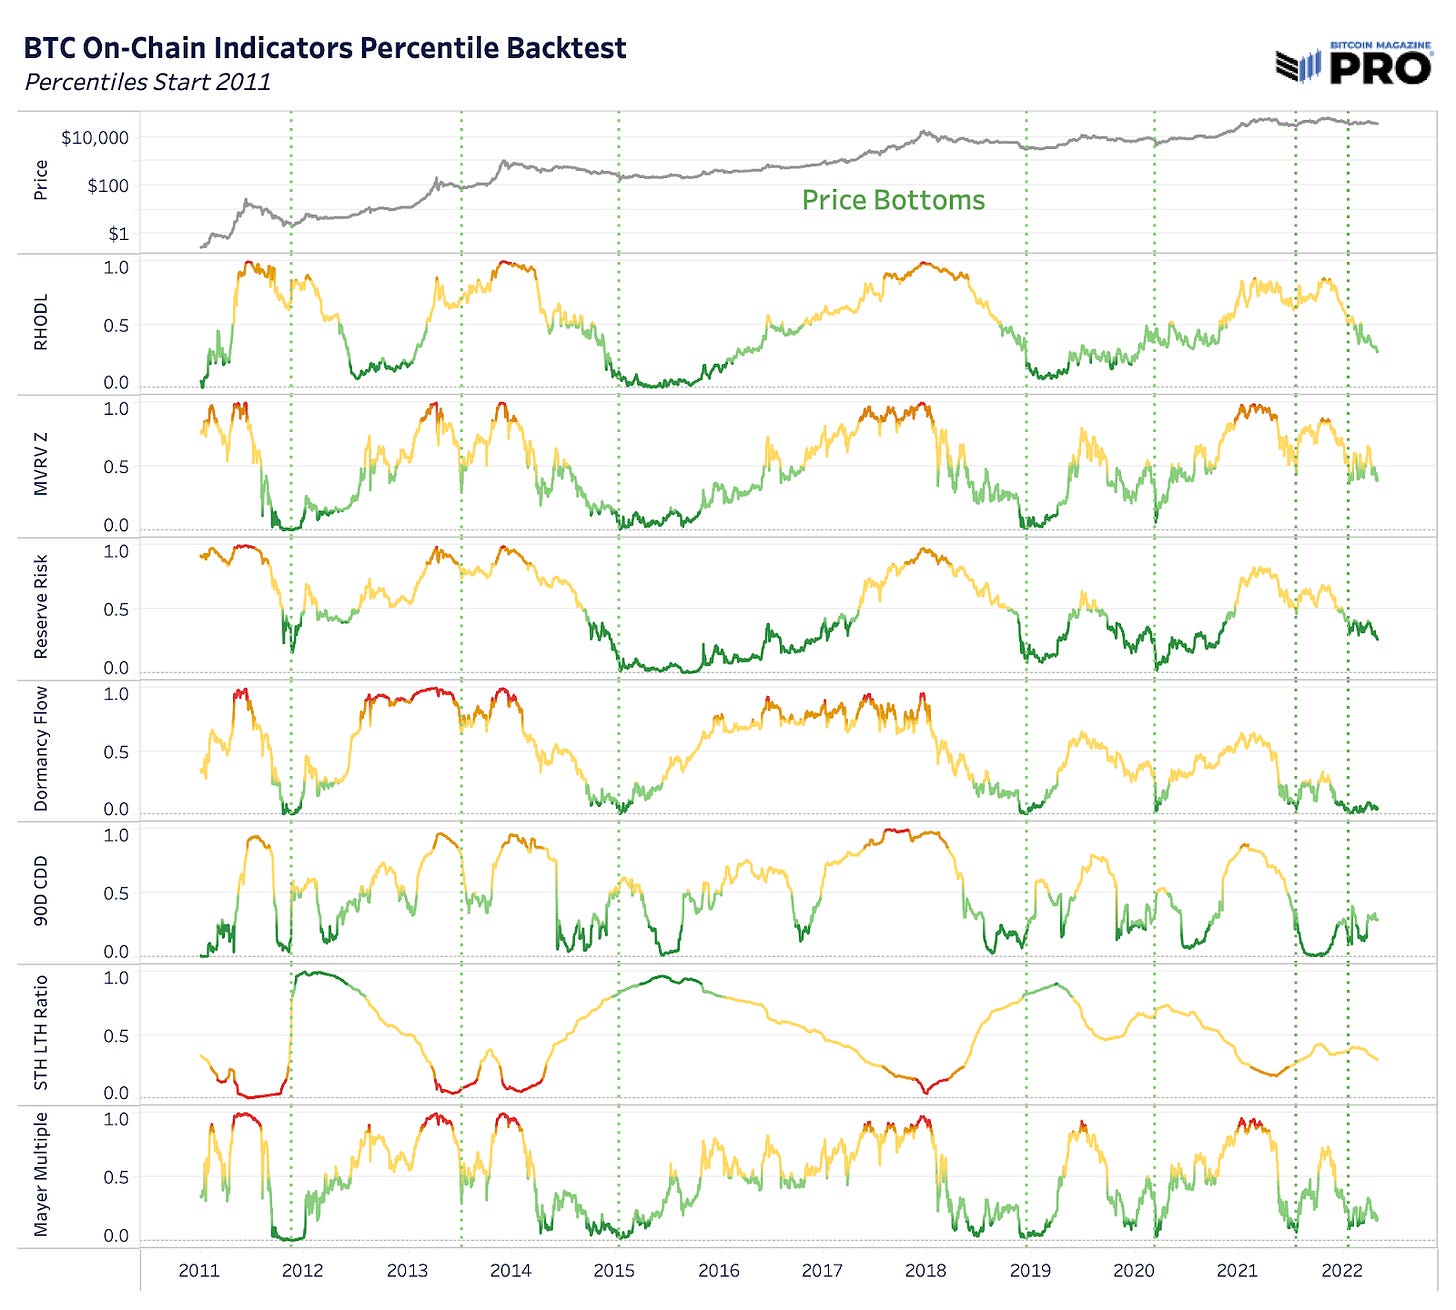
There’s a variety of on-chain analysis metrics that can help signal changes in economic behavior and market structure when bitcoin cycles are close to tops and bottoms. Over the last month, some key on-chain metrics across Reserve Risk, Dormancy Flow, and 90 Days Coin Days Destroyed have signaled that bitcoin may be close to a cyclical bottom showing that long-term this is yet another significant accumulation opportunity even pending further drawdown in price.
Yet, timing bottoms is near an impossible feat and the unique macro conditions we find ourselves in today make it that much more difficult to assess. Bitcoin’s ongoing monetization and adoption process is up against a larger force: macro credit deleveraging while bitcoin maintains a tight relationship with liquidity and risk assets early in its adoption curve. The charts below show key bitcoin market indicators tracking percentiles and percentile thresholds over time. More about the methodology can be read here.
The Market Value to Realized Value Ratio, a ratio of price and bitcoin’s realized price (cost basis) of the network, has yet to revisit market capitulation levels we’ve seen throughout bitcoin’s history. These events, where price falls below the entire cost basis of the network for a short period of time, have acted as generational buying opportunities in bitcoin’s history.
Currently at $24,511 with a strong technical price support at $30,000, this becomes a key range to watch if risk assets see greater outflows and bitcoin faces more downside over the coming months.
To supplement these on-chain metrics, there is also the Realized Price to Liveliness Ratio developed by Don Shahar. This metric divides bitcoin’s realized price by Liveliness, the sum of coin days destroyed over all coin days created. Liveliness increases when there is more distribution from holders and decreases when there is more accumulation. The ratio creates a view of useful support and resistance areas based on bitcoin’s fair value price weighted by the state of holding activity. Currently, bitcoin has struggled to remain significantly above the ratio for the entire year, now at a resistance of $39,933.
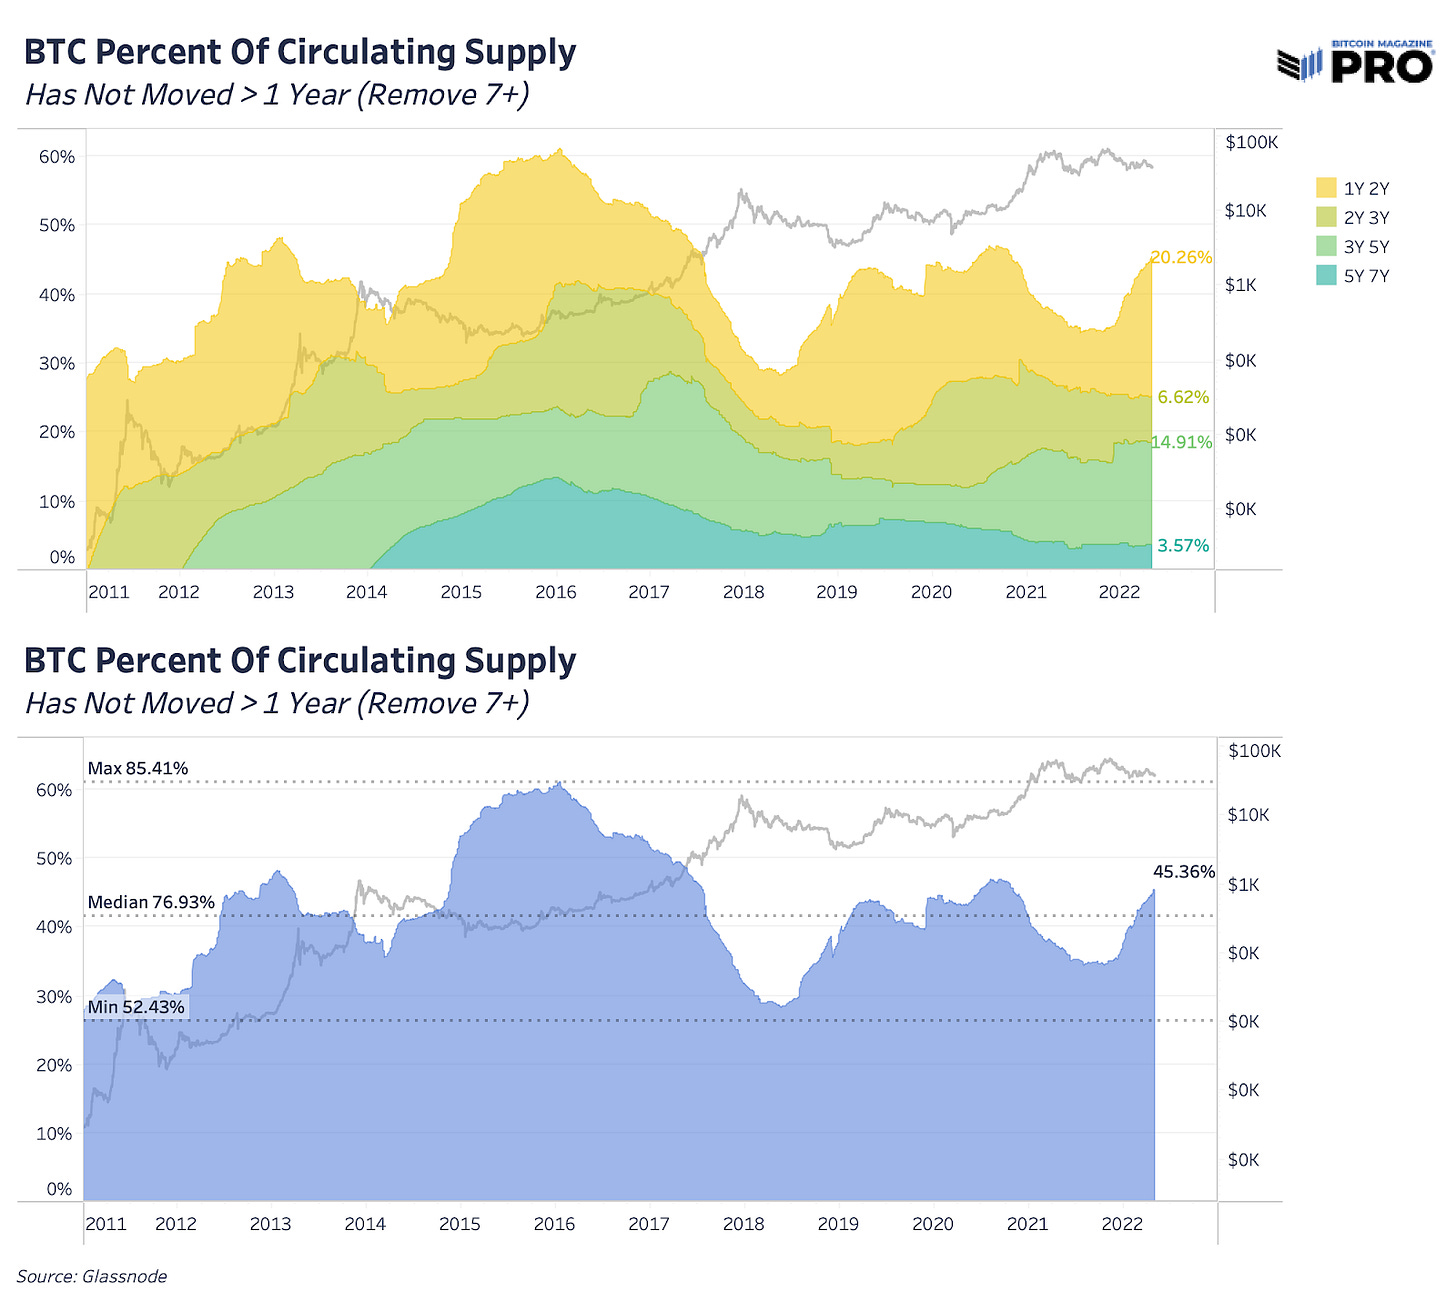
In our March Monthly Report, we highlighted the percentage of circulating supply that has been held for over one year. That is now at a new all-time high of 64.81% consisting of 12.33 million bitcoin valued at a $475 billion market cap. This trend continues to climb higher just like previous accumulation cycles as newer coins acquired over the last year continue to sit dormant but new all-time highs have been helped by a growing number of older coins.
Breaking this down by HODL Waves to look at the various age bands of coins that haven’t moved, there’s been a rising impact on the percent of supply that hasn’t moved because of much older coins over Bitcoin’s lifetime. Older coins that haven’t moved in over seven years now make up nearly 20% of that 64.81%.
Removing the older, largely-assumed lost coins, we still have a rising trend of coins that haven’t moved in the one-to-two year range but it’s not as significant as previous cycles. What this does show, however, is the rising impact of potentially lost bitcoin on circulating and HODLed supply.
Although 21 million is bitcoin’s hard cap supply, there’s nearly 3.5 million coins that are more than seven years old and can be assumed lost or likely to never move again. Some of these coins will likely make their way onto the market but many won’t, increasing Bitcoin’s supply scarcity over time. Currently, those lost coin estimates are worth $11.5 billion and leave Bitcoin’s adjusted supply around 15.5 million, versus the 19.02 million circulating supply today.
Over the last month, we’ve also seen a rise in long-term holder capitulation, specifically newer long-term holders. The long-term holder realized price has been declining at its fastest rate in bitcoin’s history, falling 17.71% over the last 30 days down to just below $13,000. We can see these dynamics more closely in the long-term holder spent price which tracks the average price long-term holders are spending coins at.
The long-term holder spent price, now just shy of market price, shows long-term holders on average are currently selling at breakeven. Long-term holders on average selling at breakeven or at a loss is rare in Bitcoin’s history, only occurring a few times during bear markets.
Yet all of this capitulation from relatively newer holders seems to be getting absorbed by the broader long-term holder market. Long-term holder supply, instead of falling, has been increasing during this capitulation and up 1.5% on the year to 13,549,822 BTC.
Long-term holder supply continues to rise as this is the fastest accumulation and aging of coins that we’ve seen since November 2021 with supply growing 1.15% over the last 30 days alone. So even if we’re seeing some capitulation in newer long-term holders, overall the selling is getting absorbed by stronger accumulation.
Apart from long-term holders building a larger accumulation zone, the growth in estimated whale supply has been accelerating over March and April with supply increasing 1.2% over the last 30 days as well. Although it’s difficult to fully measure and assess market whale behavior, looking at entities who have over 1,000 bitcoin while removing exchange balances gives us an idea of overall accumulation and distribution trends. More on these estimates can be found here.
These estimates would include various companies, custodians, funds, institutions, individuals and the Luna Foundation Guard as an example, which further grew their bitcoin treasury holdings by 38% this month to a total of 42,530 valued at $1.64 billion.
Some of that accumulation can be seen through the lens of exchange balance netflows with March and April being the second and third-largest outflow months in bitcoin’s history. Although the significant outflows, 164,591 BTC worth $6.33 billion, don’t seem to have had much impact on short-term price appreciation, this increased demand may be what’s keeping bitcoin from hitting lower lows in the short-term.
Another important dynamic in April was the downward pressure from bitcoin fund flows. As a proxy for many bitcoin financial vehicles available and traded globally, the Purpose Bitcoin Spot ETF had some of its largest outflows since the fund’s inception with a 17% fall in bitcoin holdings over the last 30 days before starting to turn over again.
Although this is only one fund and a reflection of a much larger market, the holdings outflow coincides with bitcoin’s recent price decline. Ever after the outflows, Purpose Bitcoin ETF holdings are still positive on the year, up 5.6%.
Bitcoin Derivatives
For most of 2021, derivatives played a key role in determining bitcoin’s short-term price at extremes for both tops and bottoms. Yet, as the long-biased speculative bid has largely left markets in 2022, perpetual swap funding rates continue their regime of neutral-to-negative funding over the last few months leaving price with less explosive and volatile moves.
Another way to see this dynamic and effect on price is to look at funding rates on an annualized basis (annualized cost to go long bitcoin on leverage). Using a seven-day moving average of both annualized funding and price, we can see the clear impact and sentiment changes this year as price tops out when annualized funding starts to reach 4-5% on average.
The USD value of futures open interest continues its downtrend from November’s peak of over $26 billion. Now at $14.27 billion, the perpetual swap futures market still makes up a majority share of total open interest at 67% across $9.86 billion.
As highlighted in the March monthly report, the collateral makeup of the bitcoin derivatives market continues a complete shift relative to 2021 with 39.80% of open interest being collateralized with bitcoin/crypto versus 70%. Quoting from that monthly report,
“This leads to less volatility to the downside due to the relationship between collateral value and position profit-and-loss for traders looking to open long positions. This trend can be expected to continue as the stablecoin ecosystem continues to grow at an explosive rate.”
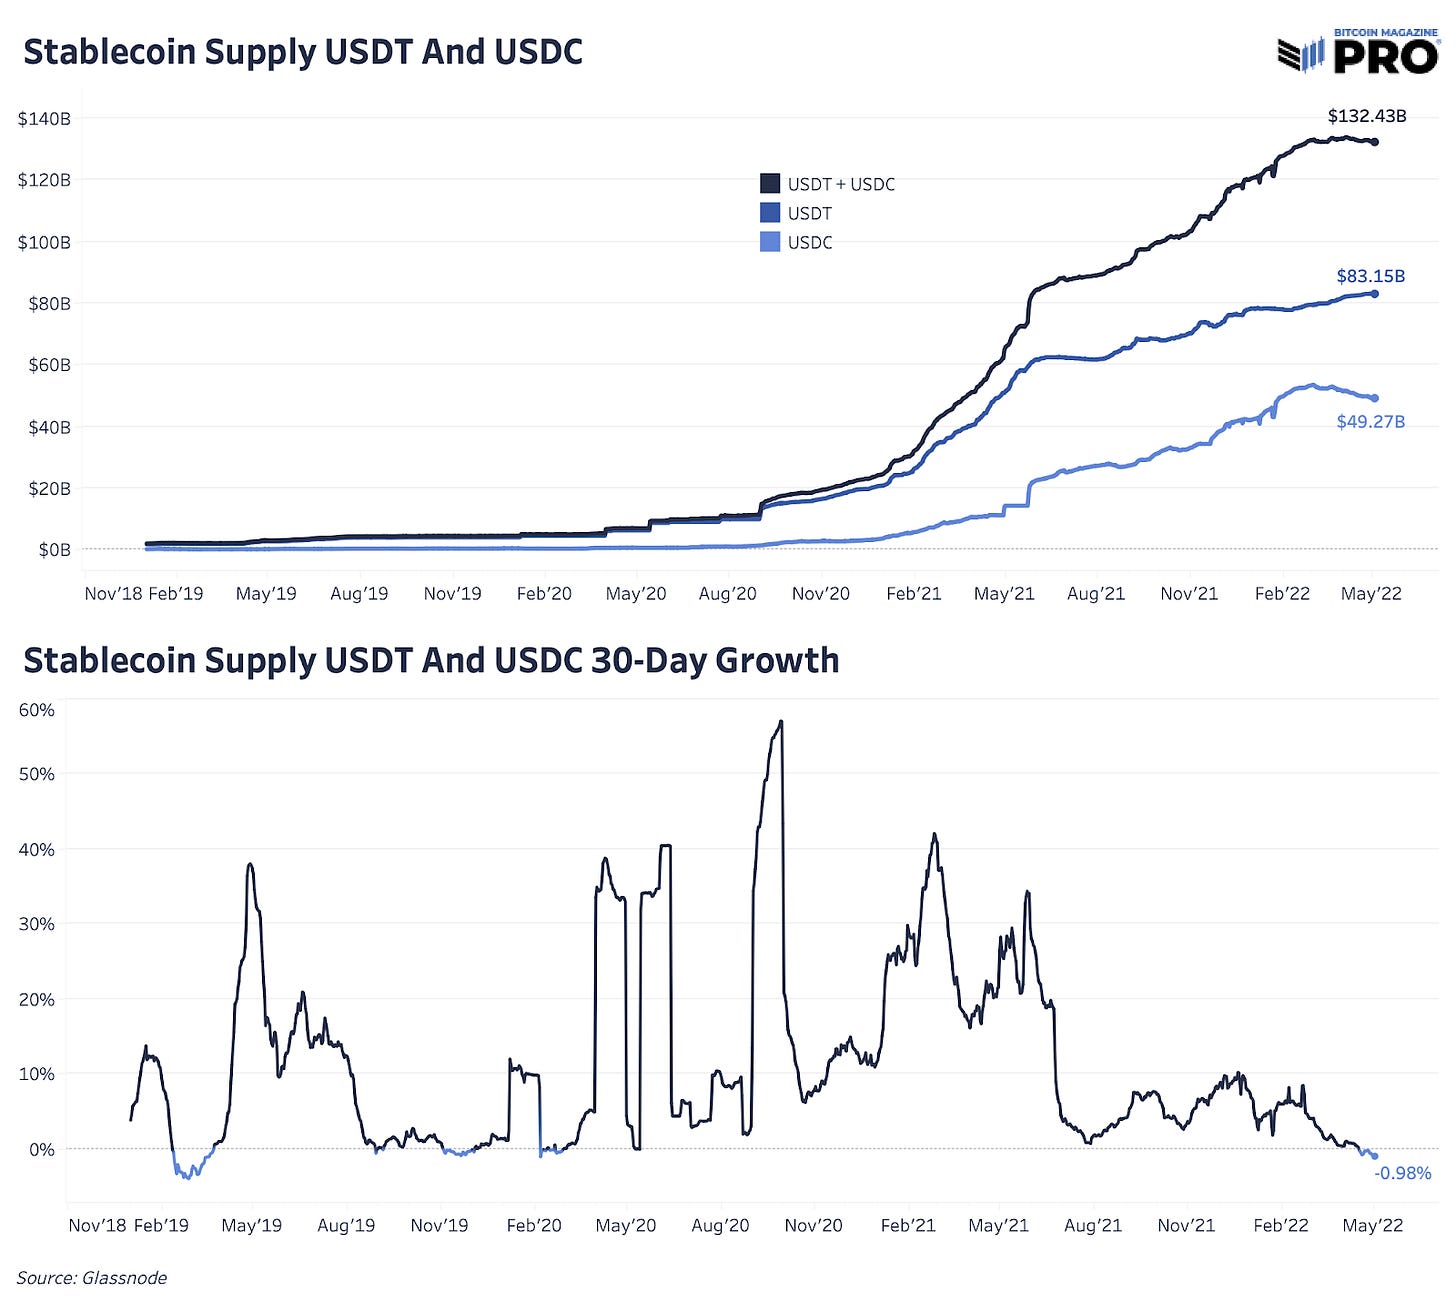
We’ve seen a small break in trend of the declining bitcoin margin open interest at the same time that stablecoin supply across Tether and USDC has decreased over the last 30 days. Largely driven by a USDC decline in circulating supply, that can signal some fleeting or changing stablecoin demand for mostly Western investors or increased demand for various stablecoins outside of Tether and USDC with the recent rise of Terra as of late.
Bitcoin Mining
During a brutal month for public Bitcoin miner stocks and valuations, Bitcoin’s network hash rate expansion carries on this year with growth up 28% year-to-date while price has fallen 20%. In a zoomed-out view, Bitcoin’s hash rate grew 22% in 2021 even during the most significant event in bitcoin mining history with the China ban and hash rate exodus. Annual hash rate growth is climbing back up to the 83% and 80% growth we saw back in 2019 and 2020.
Although hash price is still relatively high from its larger macro downtrend and remains lucrative for miners, it continues to fall from its $0.42 peak back in October 2021 to $0.162 today. As hash rate continues its expansion this year accompanied with rising difficulty and a stagnating price, we expect hash price to continue falling further this year putting more potential capitulation pressure on bitcoin miners.
There’s a few useful metrics to gauge capitulation potential across the Puell Multiple, created by David Puell, and Bitcoin Production Cost and Bitcoin Energy Value, both created by Charles Edwards. As for the Puell Multiple, the metric is just shy of 1, telling us that miners' daily USD bitcoin-issuance revenue is just below the average revenue they made over the last 365 days. Typically for major capitulation events, daily issuance revenue would be nearly half of the 365 days’ average. To reach the Puell Multiple lows in the past, price would need to fall roughly another 48% to around $18,000.
At a high-level view, that gives us a useful floor to think about when major, peak miner capitulation could play out. Leveraging an estimated bitcoin production cost alongside the Puell Multiple shows a network cost currently around $33,767 and an electricity cost of $20,260. This is the global average U.S. dollar cost of producing one bitcoin per day.
Historically, the electricity cost to produce a bitcoin has represented an interesting price floor in the market price. Bitcoin’s energy value at $32,863 shown below shows the bitcoin price mean reversion to its energy value, energy input in joules that can be used to estimate a bitcoin fair price. More can be read on Bitcoin production cost calculation here and more on Bitcoin’s energy value here.
Macro Landscape
The key focus of the larger macroeconomic landscape as of late is credit, credit selling off, the rate of change in credit interest rates across global debt and the second order effects of this move. With the market responding to elevated global inflation and with real bond yields deeply negative, interest rates across the U.S. Treasury curve have soared since November 2021 with the U.S. 10-year rate recently hitting 3% for the first time in over three years. The speed at which this has happened has completely taken the life out of risk-assets and overall market liquidity sending market volatility higher.
We find ourselves today in one of the fastest monetary tightening cycle periods in history into a deteriorating growth outlook and sustained period of elevated inflation, even with U.S. inflation potentially peaking in the coming months.
With the Federal Reserve Board committed to fighting 40-year inflation highs and far behind the financial conditions tightening underway in the market, the market sentiment of the “Fed can’t raise raises” to pricing in a 2.75% federal funds target rate by the end of this year has shifted dramatically over the last few months. These market probabilities equate to the Fed raising rates by 50 bps for every Federal Open Market Committee (FOMC) meeting left this year.
Although that may seem like a ridiculous feat, the swiftness in Federal Reserve monetary policy change likely will last for a couple of quarters before market conditions and economic conditions worsen. Already dealing with a significant, likely policy error by not tightening sooner and now catching up to the market, the FOMC is left with few politically viable options. Our base case is still that a Federal Reserve dovish pivot will happen after market conditions worsen further.
Tightening financial conditions can also be measured through the widening of credit spreads, i.e., the difference in yields between corporate credit and treasuries. Credit spreads are the additional yield demanded by investors compensating for credit risk over risk-free rates. As rates rise and spreads widen, the cost of capital and financing is increasing for all. In major crash periods like March 2020, credit spreads blowout with equity volatility. If economic conditions continue to worsen, the next bearish catalyst to the market will likely show up in further deterioration in credit with credit spreads widening further.
Another blowup in credit spreads with further decline in broader equity indexes would be the signs to start anticipating a Fed policy reversal based on historic precedent.
So following the trail of credit, credit spreads, its unwind and the impact it has on market volatility is more reason to closely watch the relationship of equity volatility with bitcoin. After a sustained period of relatively low volatility, the VIX (Chicago Board Options Exchange's CBOE Volatility Index) is spiking back over 33 and has had a relatively strong inverse correlation with bitcoin price throughout April. Other than a few periods in its history over the last two years, bitcoin has certainly acted like an “inverse VIX” rather than its own monetary asset. Although that view is shortsighted in our opinion relative to bitcoin’s long-term potential, it is the current truth of how bitcoin is currently traded on the market.
The relationship speaks to 1) the incredibly small size of bitcoin’s market cap relative to the rest of the market and 2) in times of credit market volatility and deleveraging, everything becomes correlated.
Bitcoin’s inverse correlation with a rising DXY is back again as well, reaching -0.813 as the U.S. dollar strength, relative to other major currencies, soared over 100 as the Bank of Japan continues aggressive, yield curve control measures. Even with the U.S. dollar losing significant value in purchasing power for various goods and services, many foreign currencies are much worse.
The rising U.S. dollar strength not only negatively affects everything it trades against and corporate earnings potential, but is a global recession risk concern as the world reserve currency and U.S. dollar-denominated debt held by foreign institutions becomes more expensive.
The main conclusion from all of this is that there is a wide variety of evidence showing up in markets that something is due to break drastically over the next 12 months and has likely already started. The deflationary forces and potential economic destruction that will follow will leave central banks and governments with little options but to increase monetary easing and pursue fiscal policies yet again.
That, in our view, is the next major catalyst for bitcoin to not only benefit from the accelerated market liquidity but also a time to solidify its use case and competitive edge as a non-sovereign, trustless, scarce, decentralized superior money and monetary network open to anyone globally who chooses to use it while allowing individuals to escape the inevitable financial repression measures and increased fiat debasement to come.


Bitcoin will absorb significant "DeFi" money during the next all-time high. Just saying.