The Deep Dive Monthly Report, March 2022
This month, we’re releasing the monthly report across both PDF and Substack options. Click the “Read Now” button below to access the full report PDF.
If you have any issues viewing this report through e-mail or mobile, you can view the full report on Substack here.
PREPARED BY:
Dylan LeClair, Head of Market Research
Sam Rule, Lead Analyst
Summary:
On-Chain Market Dynamics
Last Active Supply, Illiquid Supply
Market Momentum, STH LTH Ratio
Delta Gradient, Exchange Balances
Top BTC Treasuries
Bitcoin Derivatives
Perpetual Swaps Market
Futures Annualized Rolling Basis
Risk-Free Rate, Crypto-Margined Open Interest
Bitcoin Mining
Hash Rate Growth YTD
Hash Price, Monthly Revenue
Transfer Volume Miners To Exchange
Macro Landscape
U.S. Treasury Yields
Bitcoin VIX Relationship
10-2 Spread, High Yield Index Less CPI
Market Outlook, Concluding Thoughts
Executive Summary
Bitcoin began trading the month at $44,000, with a monthly low of $37,000 before rebounding along with a basket of risk assets, reaching as high as $48,000, reclaiming critical technical support levels along the way. The rally in bitcoin in particular was additionally fueled by short covering by defensive derivative traders who went entirely risk-off, as shown by funding rates in the perpetual swap market. While macroeconomic uncertainty remains despite the strong rebound in risk assets, bitcoin remains uniquely positioned to outperform due to its extremely strong supply side dynamics and lack of long-biased derivative market positioning.
On-Chain Market Dynamics
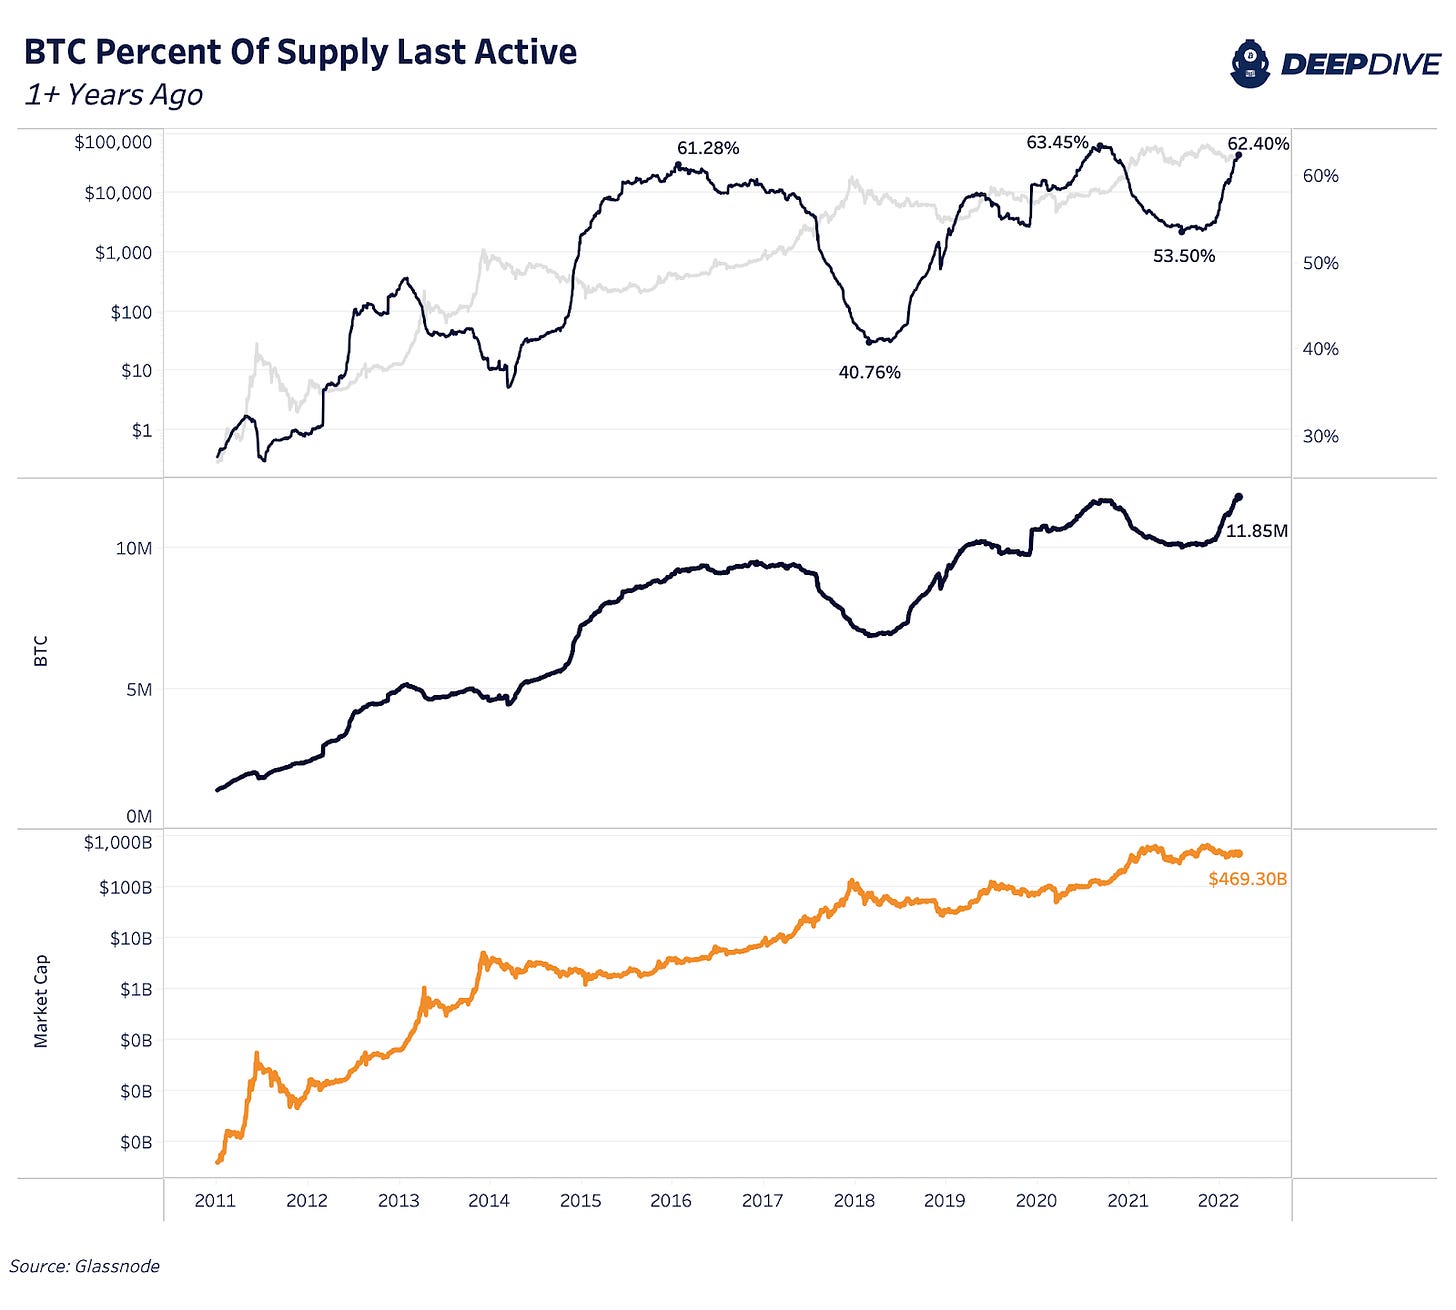
As mentioned in the executive summary, the bitcoin market so far in 2022 has been pricing in two separate realities. The first being a deteriorating global economics picture and a risk-off sentiment, with the second being bitcoin supply side dynamics that haven’t looked as strong since before the market went parabolic in early 2020. We have a few ways of quantifying the supply side dynamics for bitcoin, and we can start with the most intuitive: the percentage of circulating supply that has been held for over one year.
The price of bitcoin (as well as any other asset) rises when the marginal seller is exhausted, and thus the larger the percentage of circulating supply that is being held and not traded on the market, the easier it becomes for buyers to absorb sell pressure, and the more likely that supply-and-demand imbalance is resolved by higher prices.
It is no coincidence that the prior periods where 60%+ of the circulating supply of bitcoin were held for over one year was right before price went parabolic. While it is certainly no guarantee that price goes parabolic in short order, what we do know is that there is only one other time in history where coins have been this tightly held over a one-year time frame.
In aggregate terms, because there are more outstanding bitcoin today than in September 2020, there has never been a period where more bitcoin hasn’t moved over a one-year time frame: 62.40% of held bitcoin supply equates to 11.85 million bitcoin with an approximate market capitalization value of $469 billion.
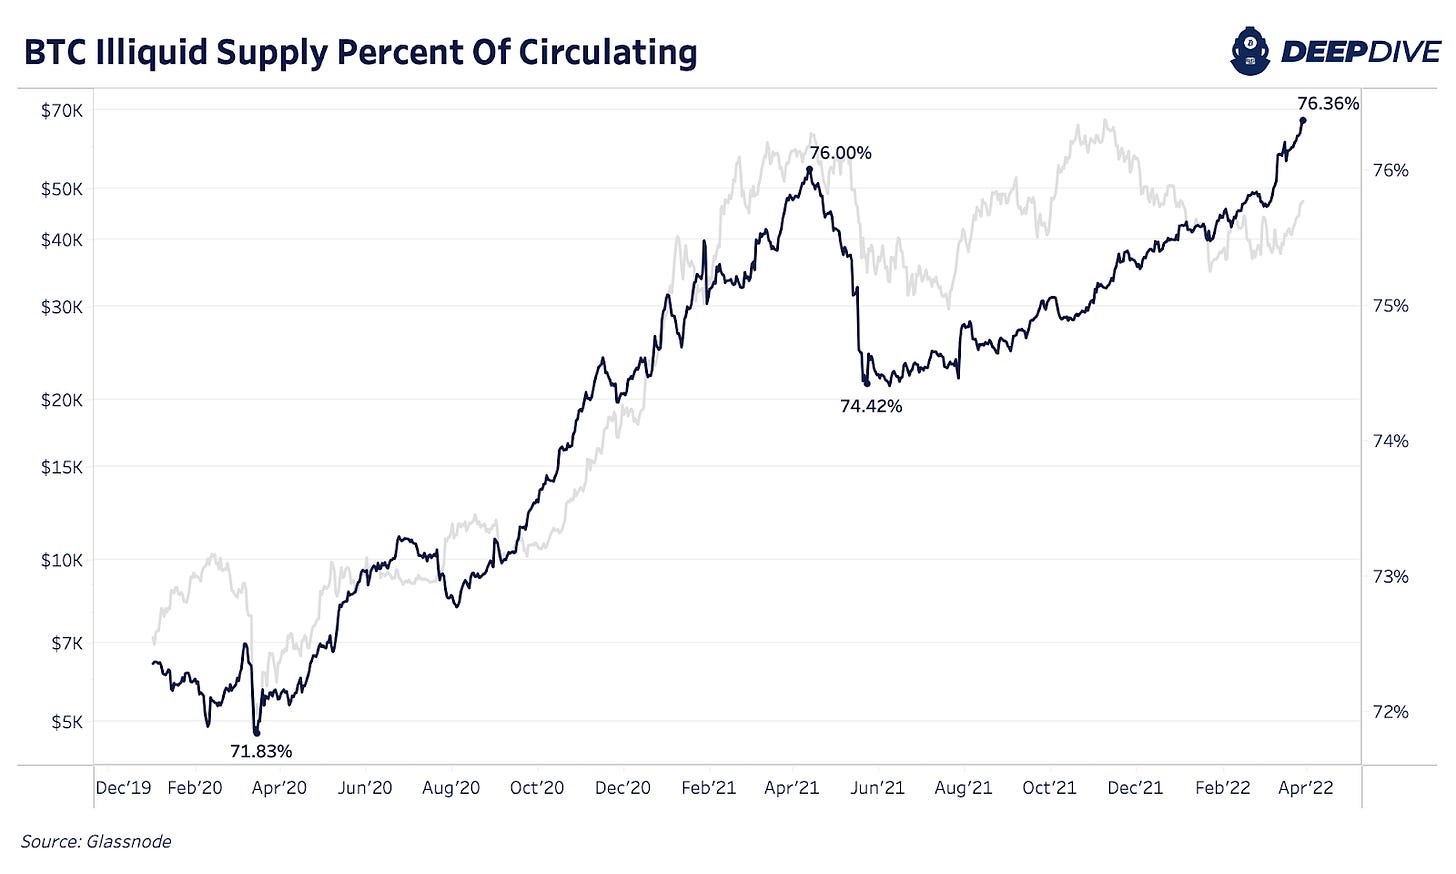
Similarly, we can look at illiquid supply as a metric for quantifying bitcoin’s supply side dynamics. Illiquid supply essentially is defined as the cohort that is the statistically least likely to move/spend their coins once they have been acquired.
To read more about the quantification of supply liquidity, read here.
Illiquid supply continues bending upwards, as a relentless accumulation by HODLers continues, with over 76% of circulating supply now being quantified as illiquid, a four-year high.
While one may look at the chart above and come to the conclusion that price is directly correlated to the percentage of illiquid supply, a look at the all-time chart quickly disproves that, but why?
The most important change in the supply side dynamics, and the reason for the distinct trend shift in 2020 is the bitcoin halving. Since the third halving on May 11, 2020, where the block subsidy halved from 12.5 BTC per block to 6.25 BTC, an additional 623,343 BTC were added to the bitcoin circulating supply. In that same period, illiquid supply increased by 1,170,404 BTC.
Essentially, what we can take from these numbers is that with the third bitcoin halving event, organic reservation demand for bitcoin as a reserve asset for the first time began to severely outpace new additional supply issuance, which continues to restrict the bitcoin supply as time goes on.
A look at the 30-day rate of change of illiquid supply also displays the powerful trend that has emerged, with relentless accumulation occurring since the start of 2020. The only exception to this trend is the reaction to the Chinese mining ban, in which a large amount of previously strongly held coins hit the market in short order.
Market Momentum
Historically, one of the best ways to gauge the status of the bitcoin market was to look whether price was trading below the cost basis of short-term holders. In the world of on-chain analytics, we refer to this cost basis as realized price, and the history of the realized price of short-term holders and the bitcoin market is significant. When price is trading above the cost basis of short-term holders, the bull market feeds on itself, as most market participants are in the money and unwilling to sell. Any additional market actor competes on the bid side to secure an allocation. Bitcoin, due to its absolute scarcity, trades unlike many other assets on the planet, with positive market momentum oftentimes feeding on itself. Shown below is a history of the bitcoin market and its position relative to short-term holder cost basis.
We have covered this dynamic extensively in previous issues, but it is of particular importance because price just recently reclaimed this pivotal level.
Similarly, a look at the ratio of the cost basis of short-term holders and long-term holders, which is eloquently named the “STH LTH Ratio,” yields quite the significant historical backtest.
While we have explained this ratio in depth in previous issues, a summarized version is as follows: the price of bitcoin rises when the marginal seller is exhausted, which forces new money to competitively bid to acquire a position (as described above for the cost basis of short-term holders).
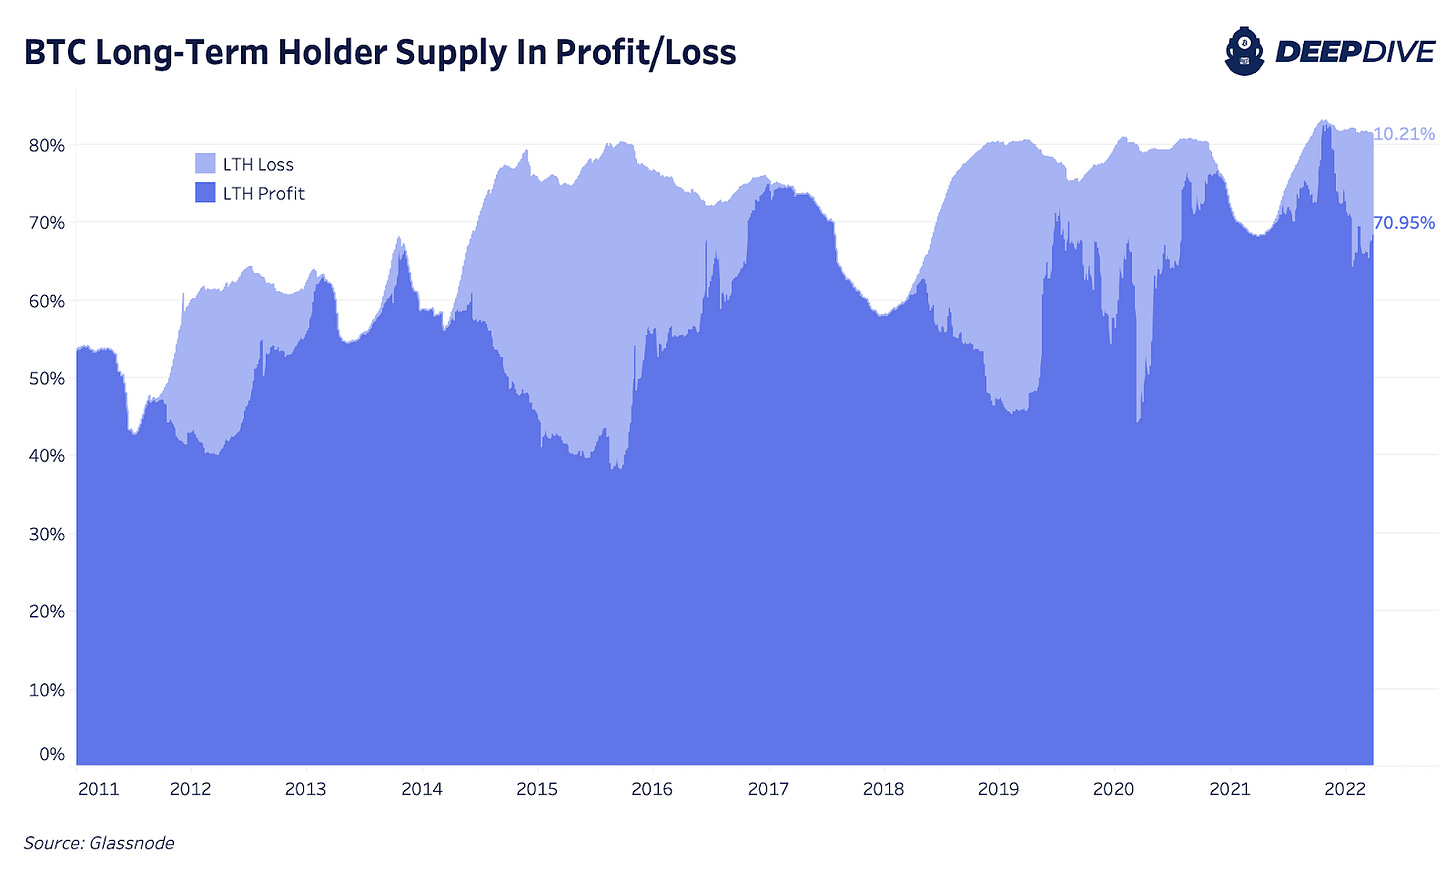
Just recently, this ratio has flipped and is trending downwards (bullish), flashing a buy signal for one of the market’s strongest cyclical indicators. This occurs because long-term holders diligently cornered the market during the bear market/consolidation period. Long-term holders currently hold just slightly below a record level of circulating supply (exchange balances are excluded from this metric).
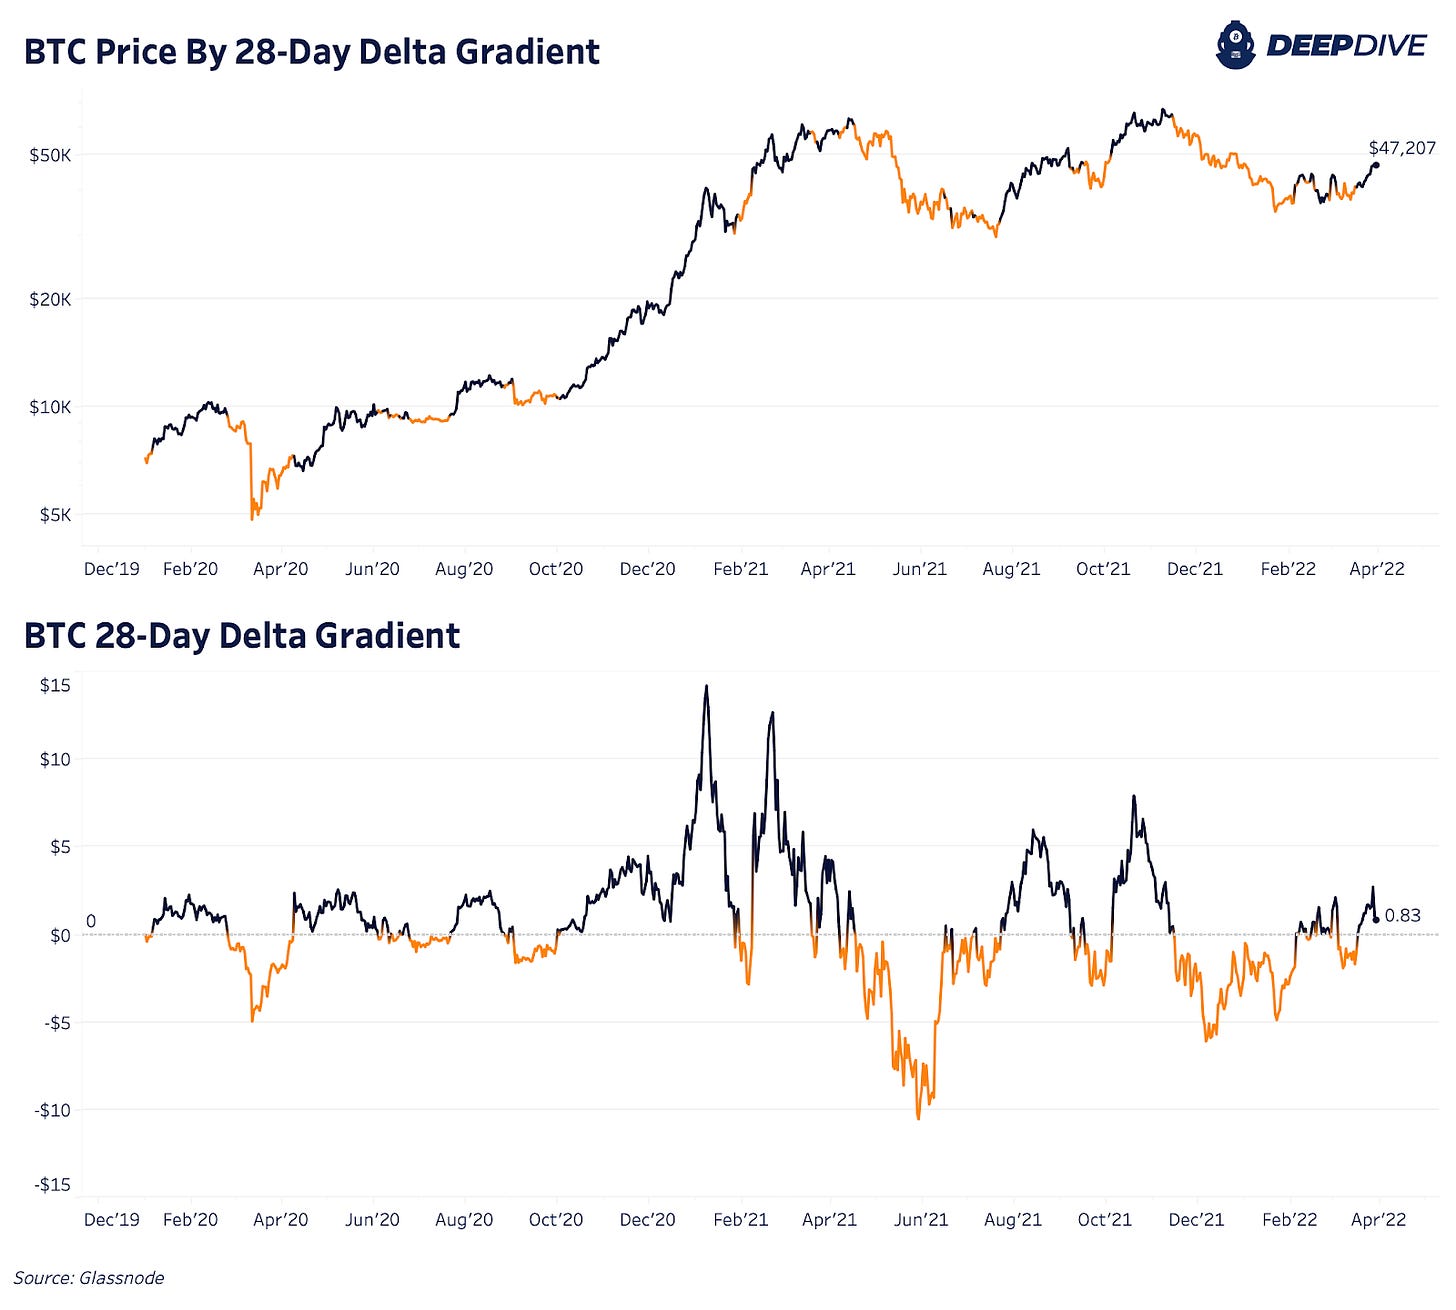
Lastly, in terms of momentum metrics, we have the Delta Gradient, which measures the difference between the gradient of the spot price and the gradient of the realized price (average on-chain cost basis). In simple terms, the metric measures the relative change in momentum between speculative value and true market capital inflows.
This metric therefore measures the relative change in momentum between speculative value and true organic capital inflows. When the Delta Gradient is positive, it indicates that an expected uptrend is in play which can be expected to last for a similar period of time as the length of the oscillator, which in this case is 28 days. The 28-day Delta Gradient turned positive on Mar. 17.
Exchange Balances
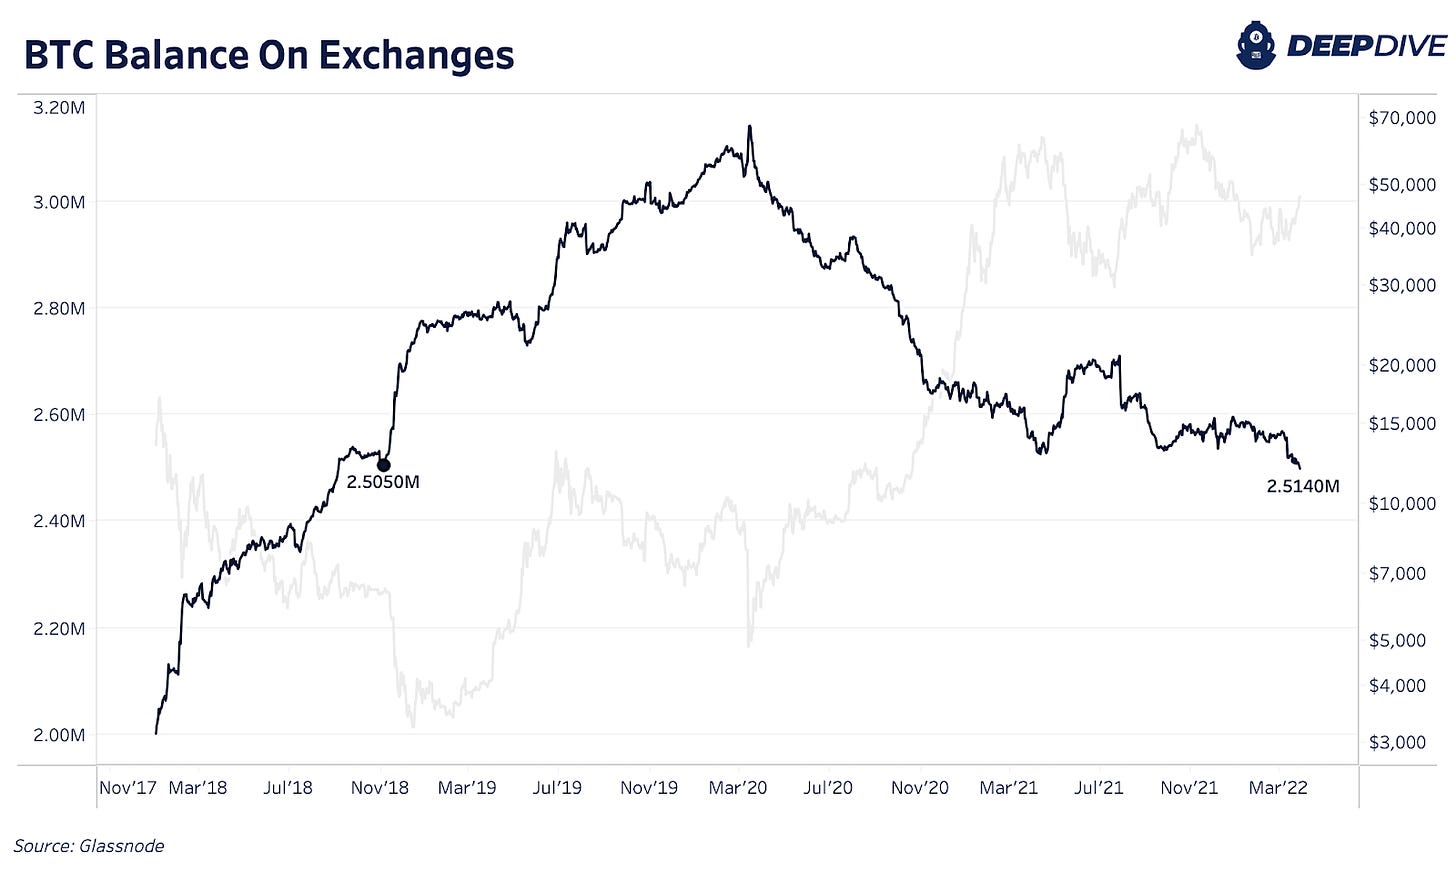
Total bitcoin on major exchanges continues to fall to multi-year lows, now at the lowest level since late 2018, at approximately 2.5 million bitcoin, accounting for slightly more than 13% of total circulating supply.
Similar to the illiquid supply dynamics, a structural shift seems to have occurred in early 2020, with an all-time-high level of bitcoin on exchange having been reached during the COVID crash, and a secular downtrend following ever since.
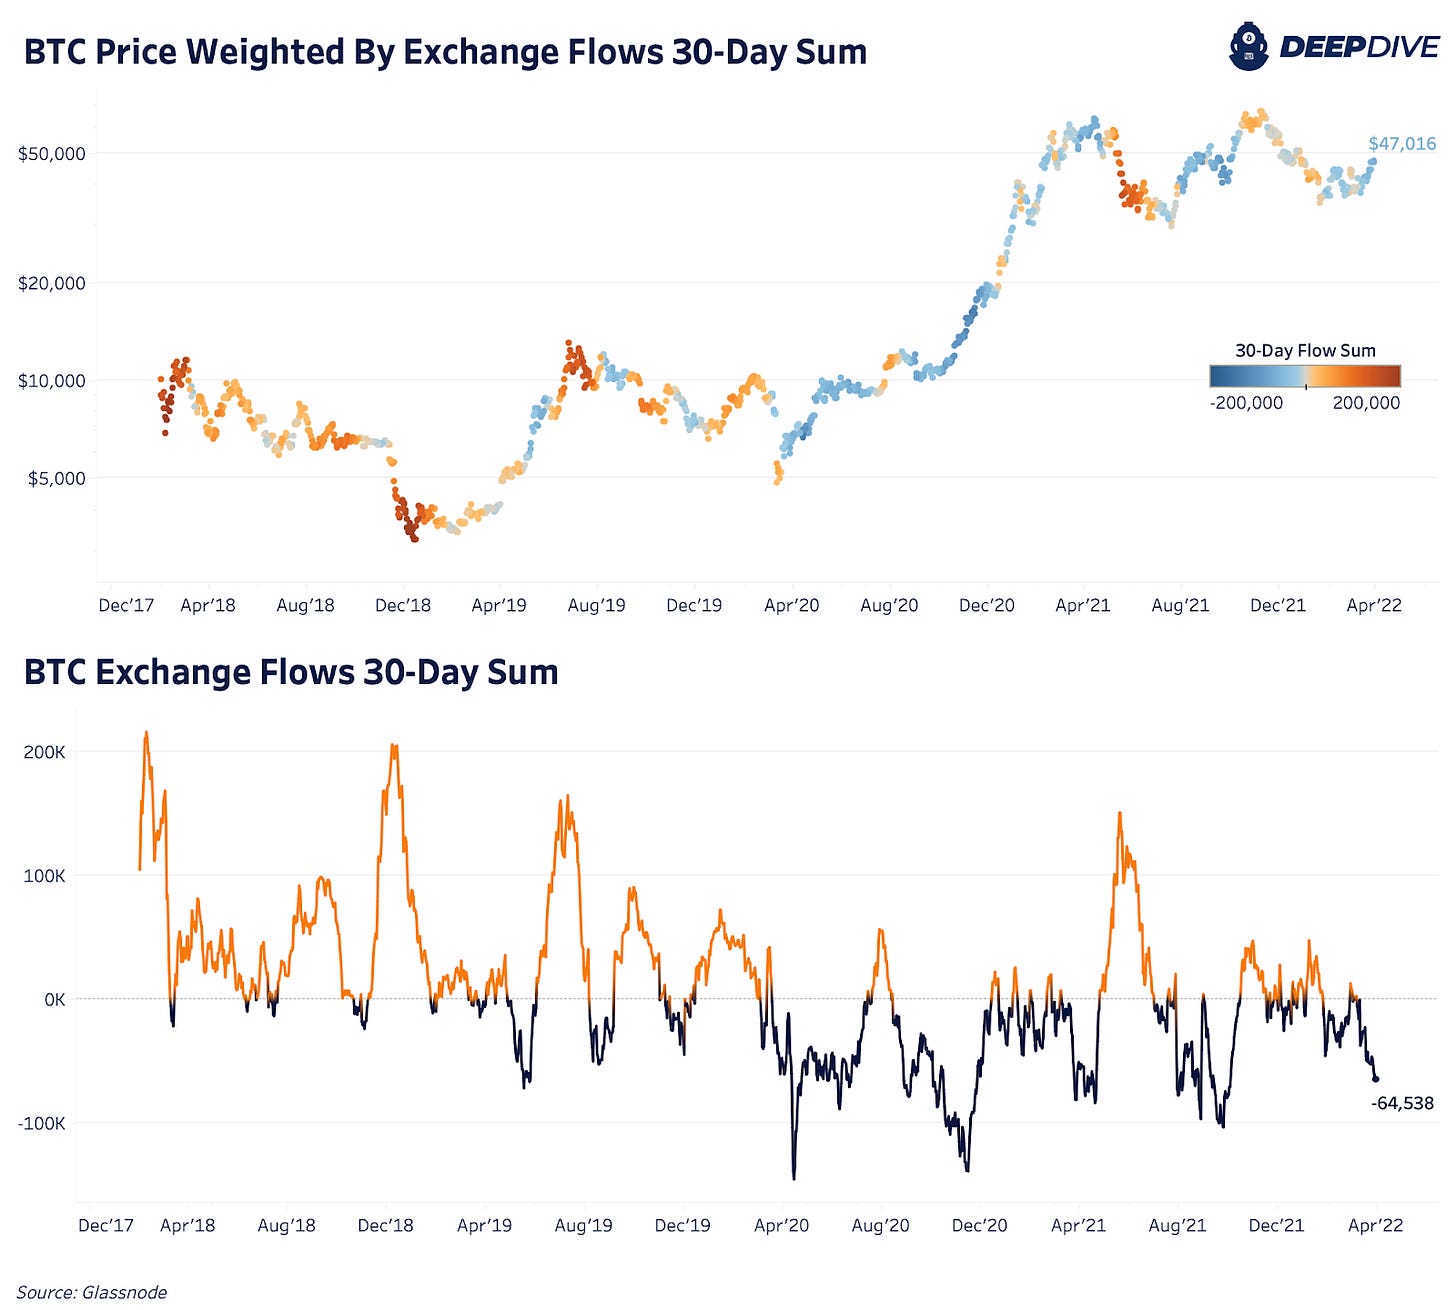
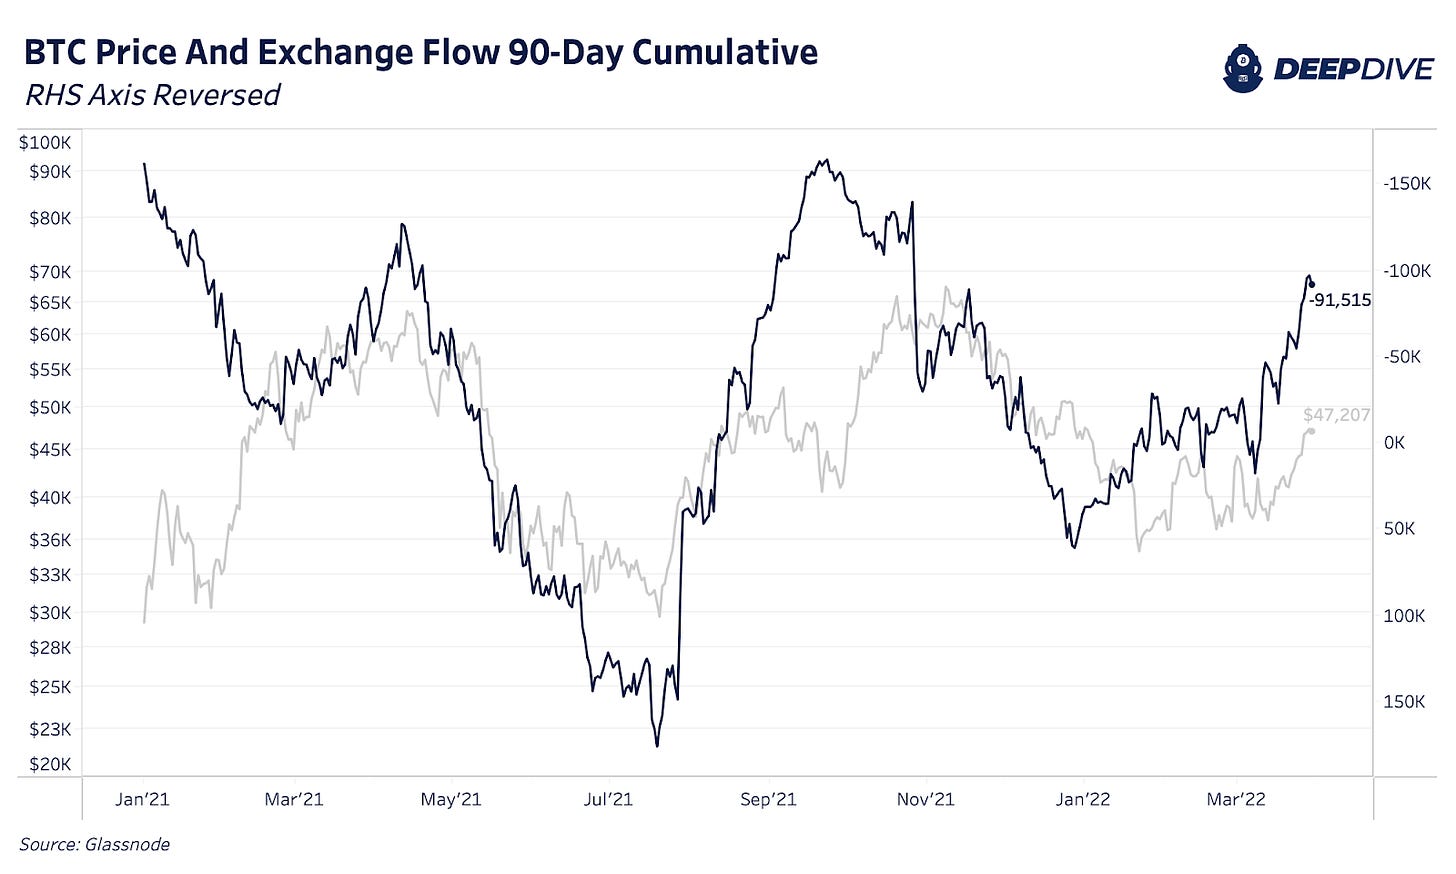
We can view this dynamic through the 30-day change to see just how strong the structural shift has been towards coins being withdrawn from exchanges. At the time of writing, another 64,538 bitcoin have been taken off exchanges in the month of March, highlighting a strong demand for the asset in its current price range. At the time of writing, March 2022 has been one of the top-five strongest exchange outflow months in bitcoin’s history.
An Unexpected Buyer Emerges
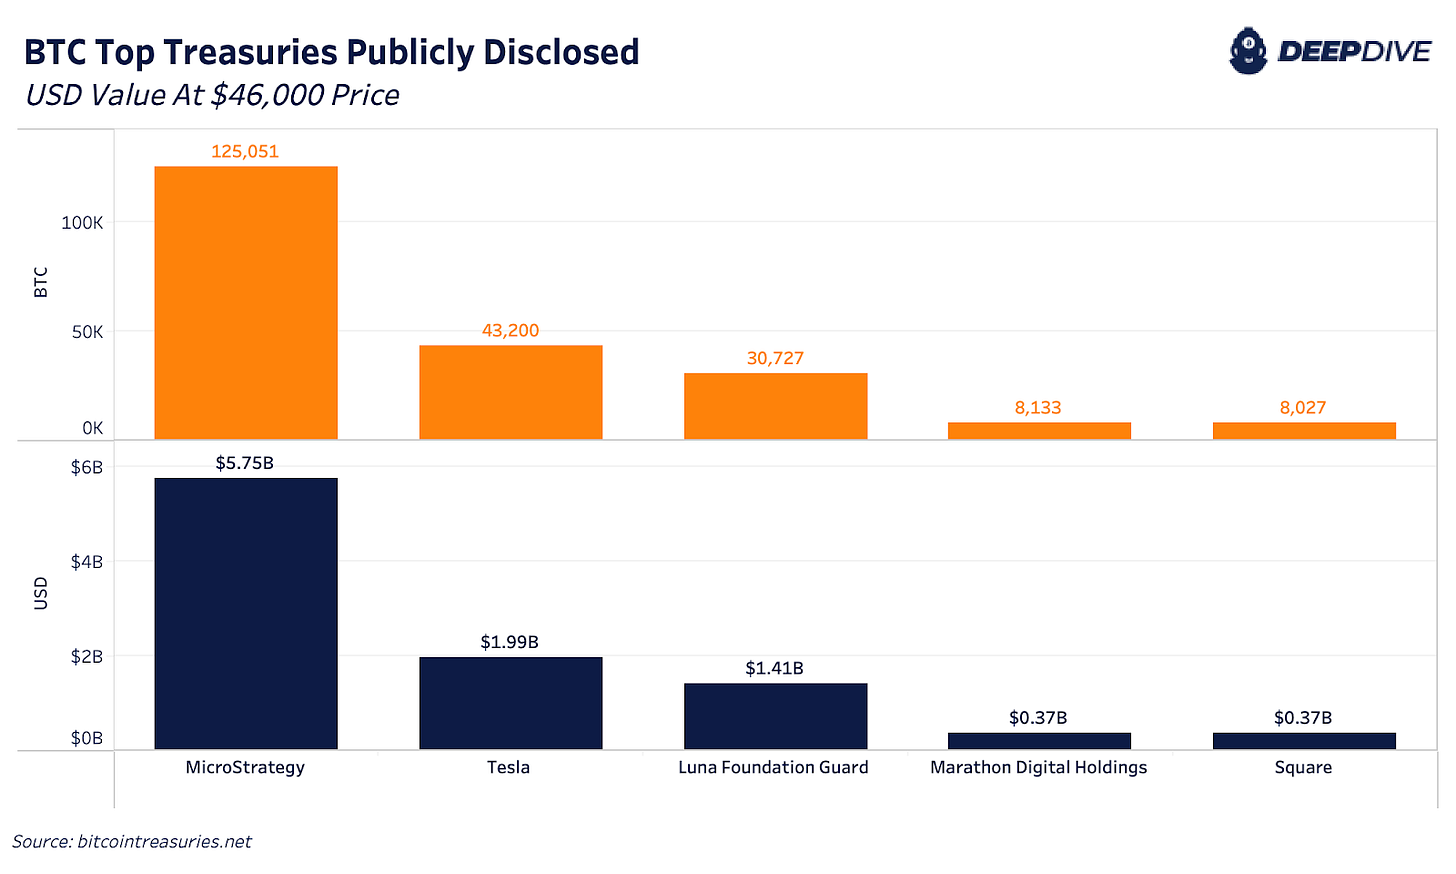
There’s a new bitcoin whale in town, and they’re going for the crown. Do Kwon, founder of Terraform Labs, has announced his intention for the Luna Foundation Guard to become the second-largest known bitcoin holder in the world outside of Satohi Nakamoto.
The Luna Foundation Guard is using funds it received from Terraform labs from the Luna ICO to acquire hoards of bitcoin for its UST reserves, an algorithmic stablecoin built on the Luna blockchain. While this report won’t delve into the specifics of the protocol or how the algorithmic stablecoin officially functions, the bitcoin is to be used in reserves to backstop the peg in times of volatility. Kwon spoke on the decision to buy bitcoin instead of other digital assets, and said it was due to the asset’s predetermined monetary policy and credibility neutral state which made it the most obvious choice.
Across March, the Luna Foundation Guard was buying $100+ million worth of bitcoin per day, and has amassed an extremely impressive 30,727 BTC at the time of writing.
While the long-term viability of the protocol is an entirely different subject matter, in a market without many natural sellers, a buyer of this size is sure to make an impact over the short/medium term.
Bitcoin Derivatives
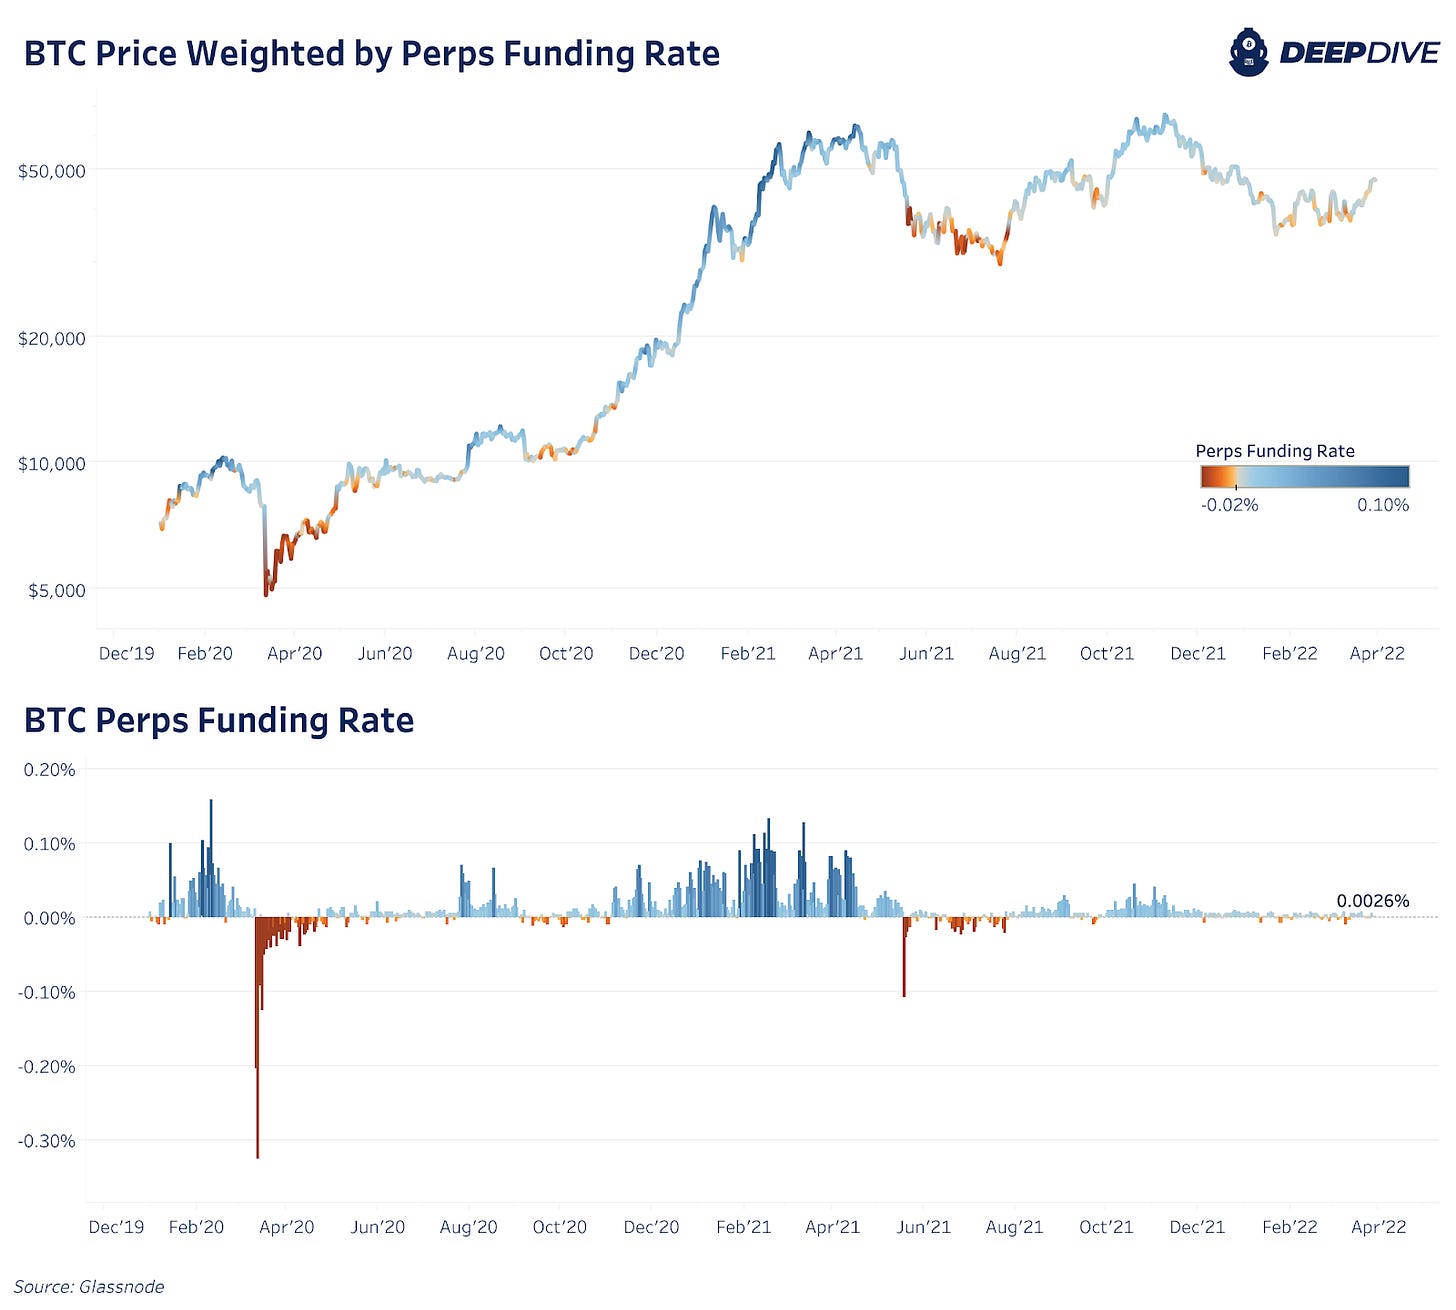
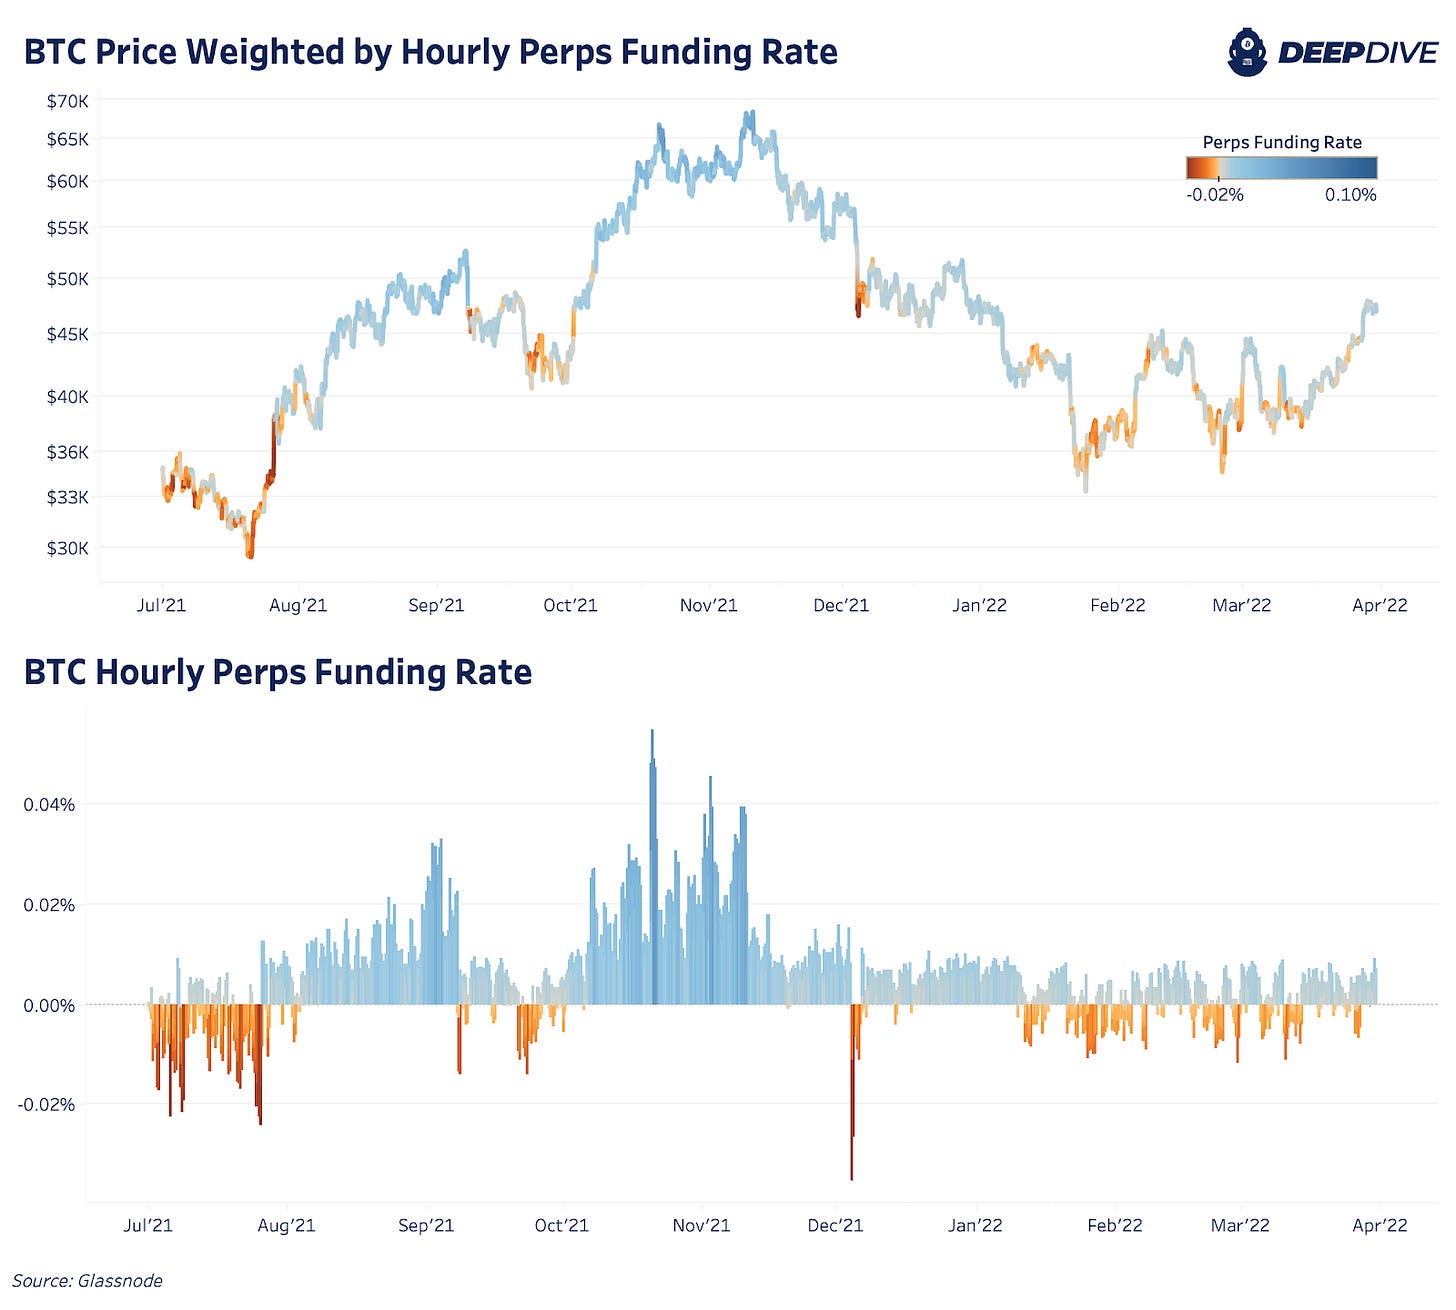
The recent action in derivative markets has been eerily quiet since the start of 2022, which in comparison to 2021 is somewhat of a positive development. A quick glance at the perpetual swap funding rates during previous visits to today’s bitcoin price level shows just how different the derivative landscape is today.
During the initial run-up in the spring of 2021, derivative speculators were often paying excess of 50% annualized to hold their long positions, while during the second run-up in the fall, funding rates were far less excessive but still very skewed to the upside.
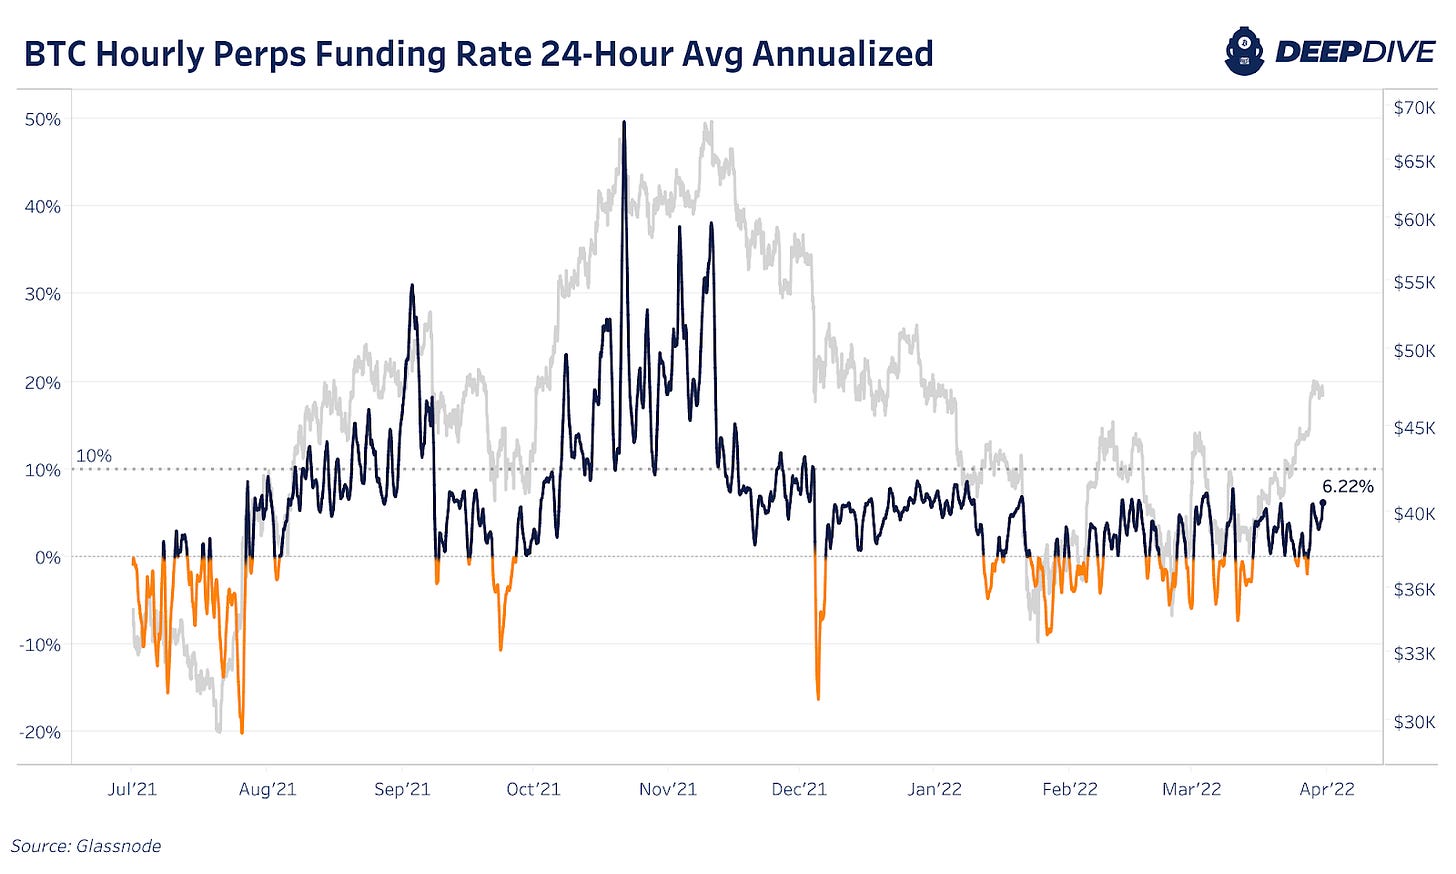
This dynamic shows that derivatives speculation played a large role in the market’s appreciation, and interestingly enough, the long-biased speculation is entirely non-existent this time around. While traders aren’t outright aggressively fading the rally as they were in the summer of 2021, funding rates have flipped periodically from neutral to negative since the start of the new year.
A view of the funding rates on an annualized basis (annualized cost to go long bitcoin on leverage) provides additional context.
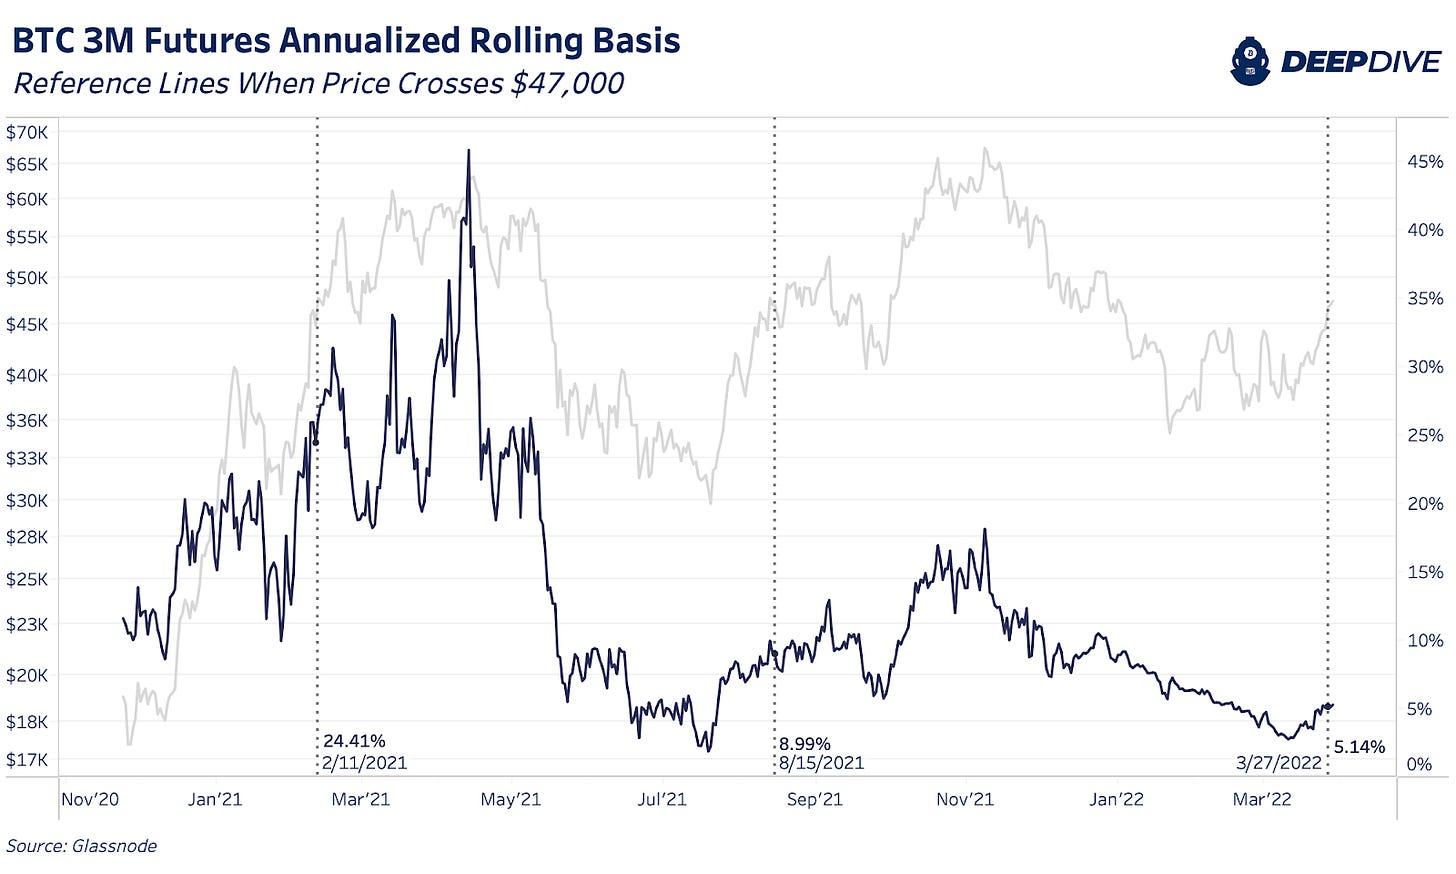
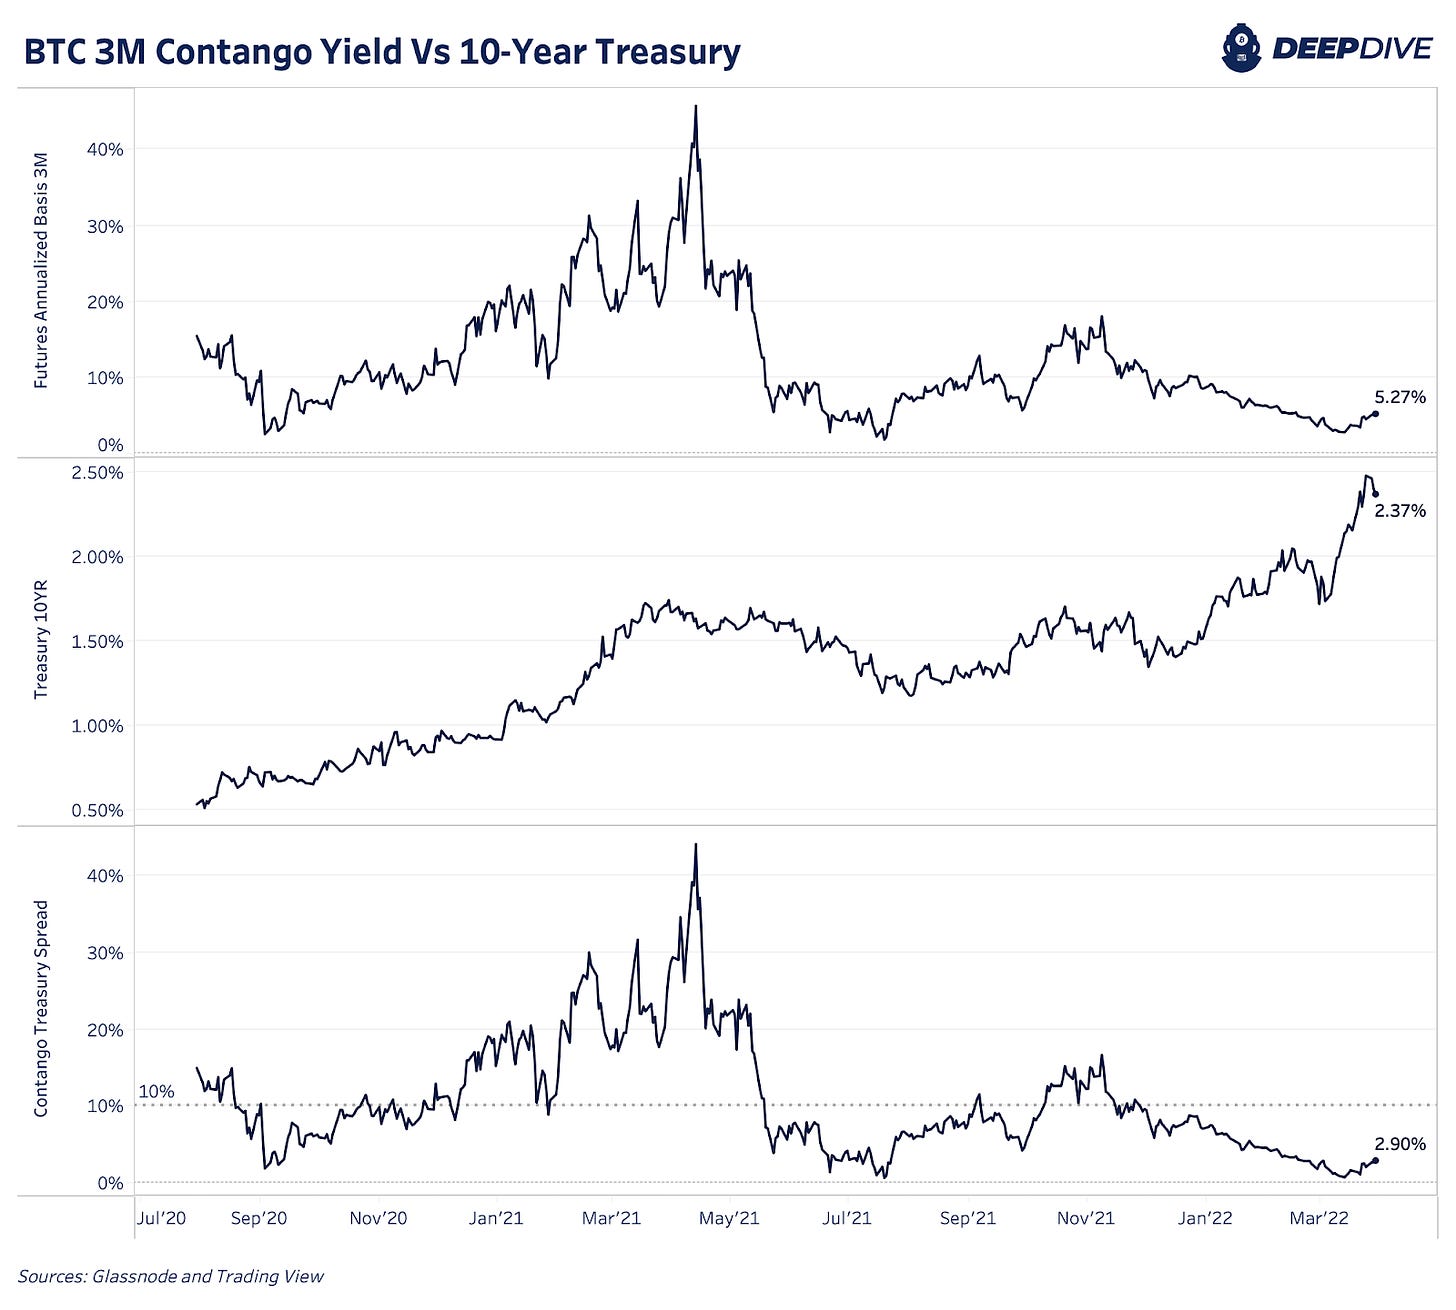
Similarly, a look at the annualized basis for forward three-month futures presents a similar outlook. The first time bitcoin visited the current price level, forward three-month futures were trading at a 26% annualized premium to spot. During the second visit in October, forward three month futures were trading at a 9% annualized premium. This time, the forward month annualized futures basis is only at 5%, showing that with every subsequent visit the market is fueled by less leverage and derivative speculation, and more by spot demand. This confirms much of what we are seeing in regards to the on-chain supply side dynamics.
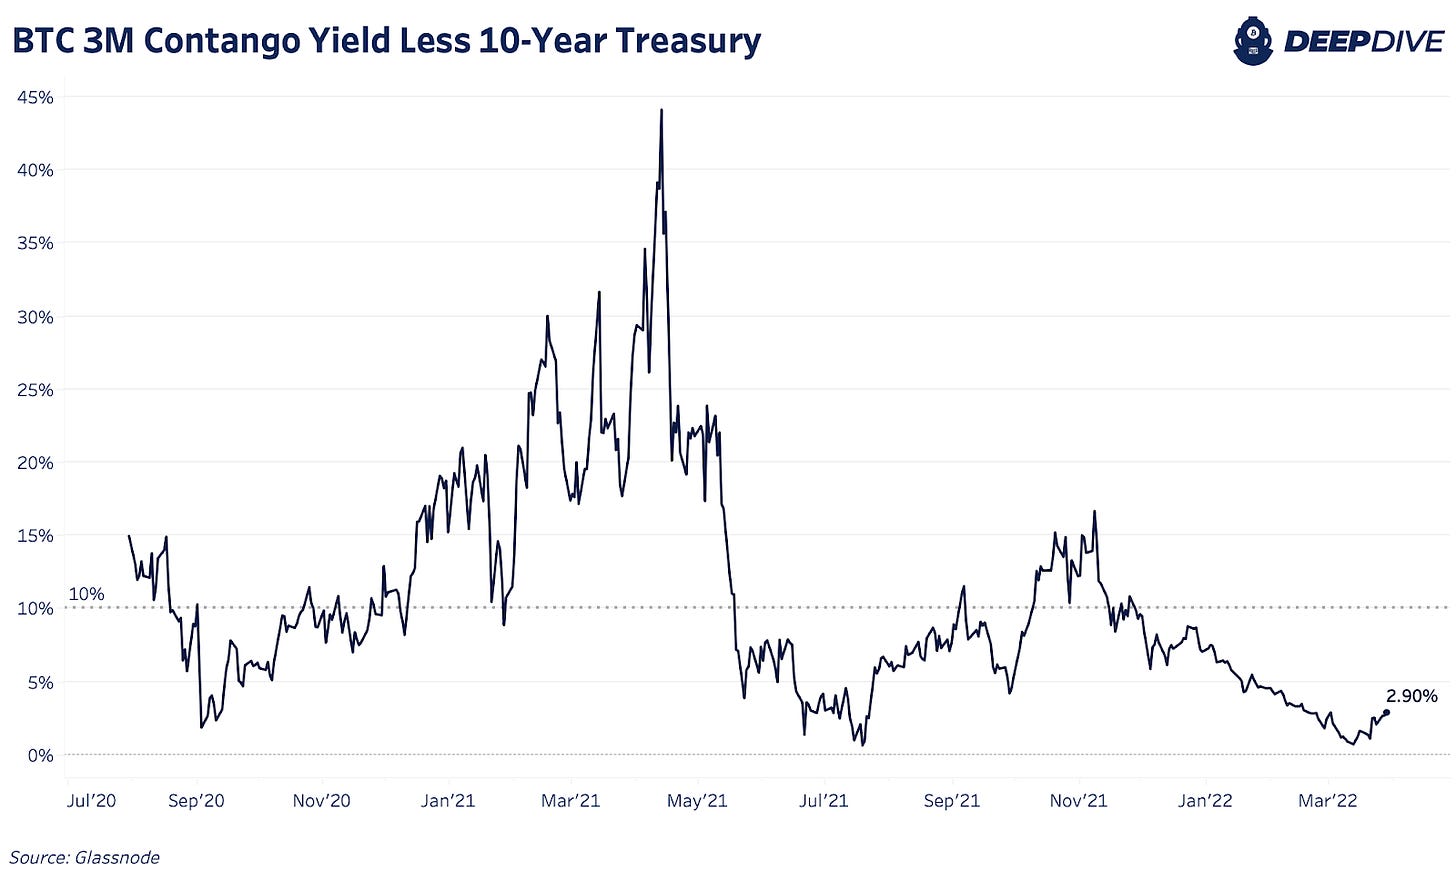
In recent weeks, we compared the “risk-free rate” available in the U.S. Treasury market to that available in the bitcoin derivatives market, to gauge relative market positioning. While the U.S. Treasury market is the largest liquid capital market in the world, with tens of trillions’ worth of actively traded debt securities, the bitcoin derivatives market is much smaller at just under $17 billion today.
The reason we compare the two at all is that many of the capital allocators that entered the bitcoin market in 2021 came in looking to capture the market-neutral rates offered in derivative products (long spot, sell futures, capture the spread).
Thus, by comparing the three-month basis to what all of the largest capital allocators in the world today view as the risk-free rate (which has been steadily increasing since the summer of 2020), we see that the bitcoin quarterly derivatives were the most risk off they’ve been since September of 2020 and July of 2021.
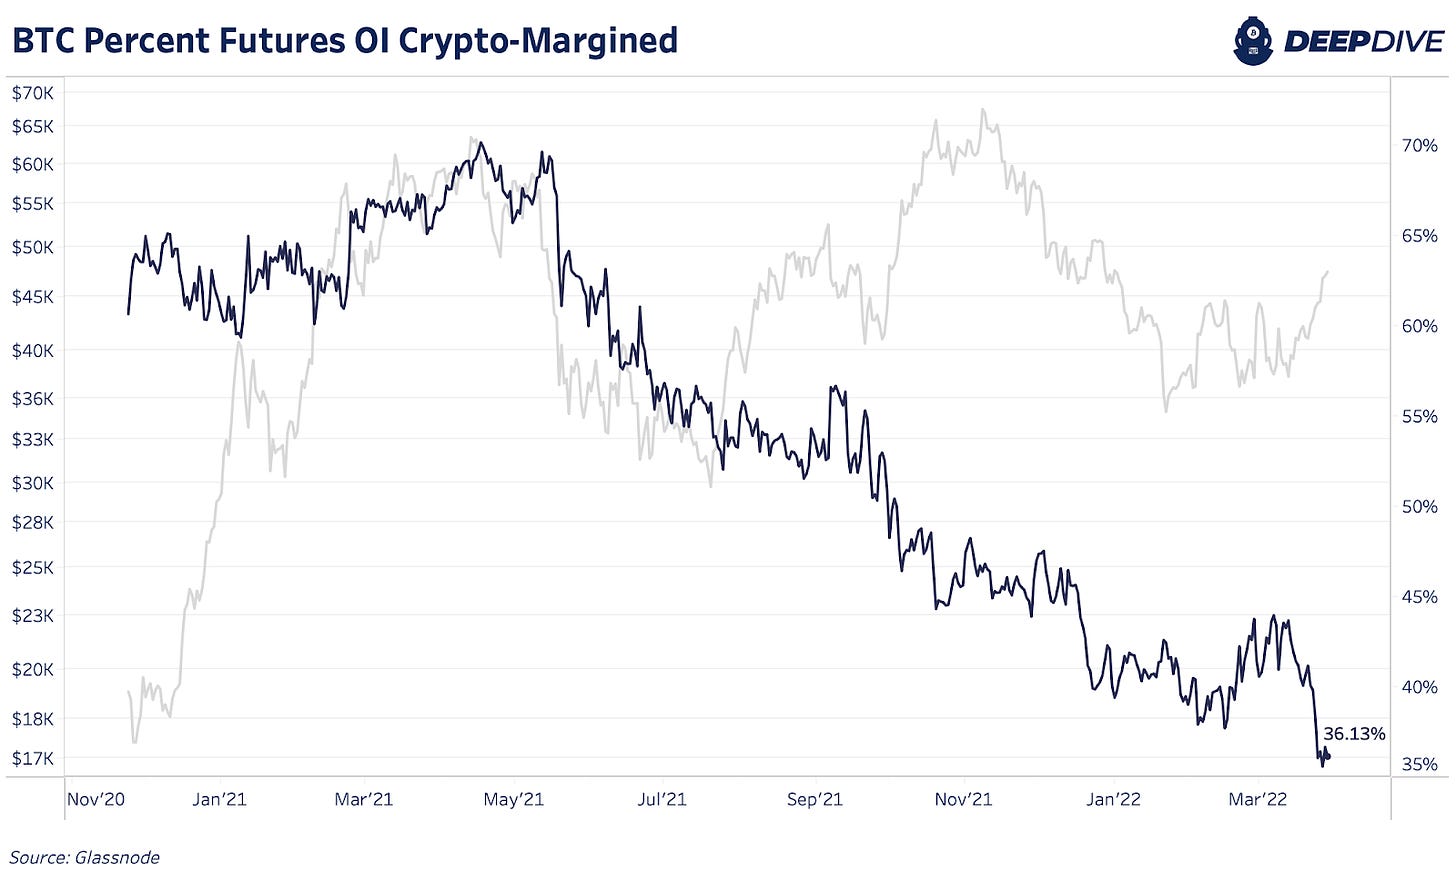
Lastly, the collateral makeup of the bitcoin derivatives market has completely changed since the start of 2021, shifting from 70% of open interest being collateralized with bitcoin/crypto, to now just 36%, with the rest of the collateral being stablecoins.
This leads to less volatility to the downside due to the relationship between collateral value and position profit-and-loss for traders looking to open long positions. This trend can be expected to continue as the stablecoin ecosystem continues to grow at an explosive rate.
Bitcoin Mining
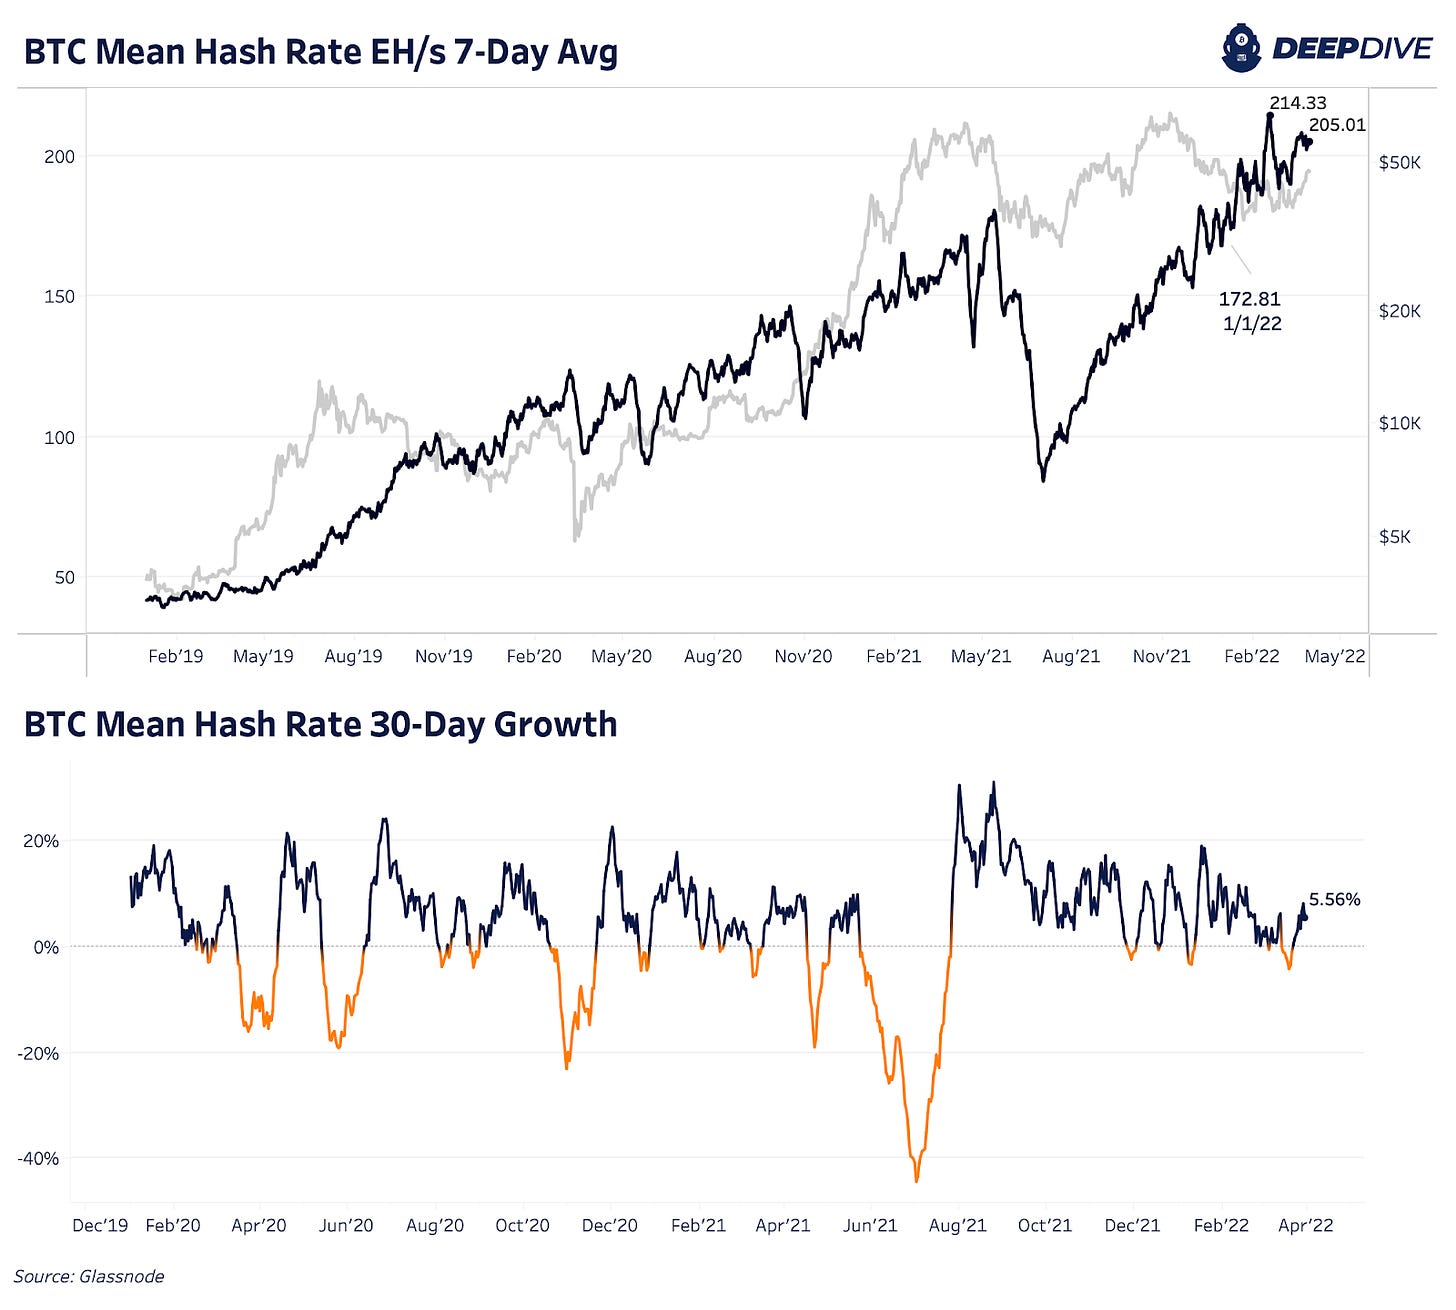
Through the month of March, Bitcoin’s 7-day average hash rate sits around 205 EH/s, up 18.63% year-to-date and 5.56% over the last 30 days. Annualizing the first-quarter growth puts the hash rate on pace to grow 74.52% for the year which would imply a 2022 end-of-year hash rate of approximately 300 EH/s.
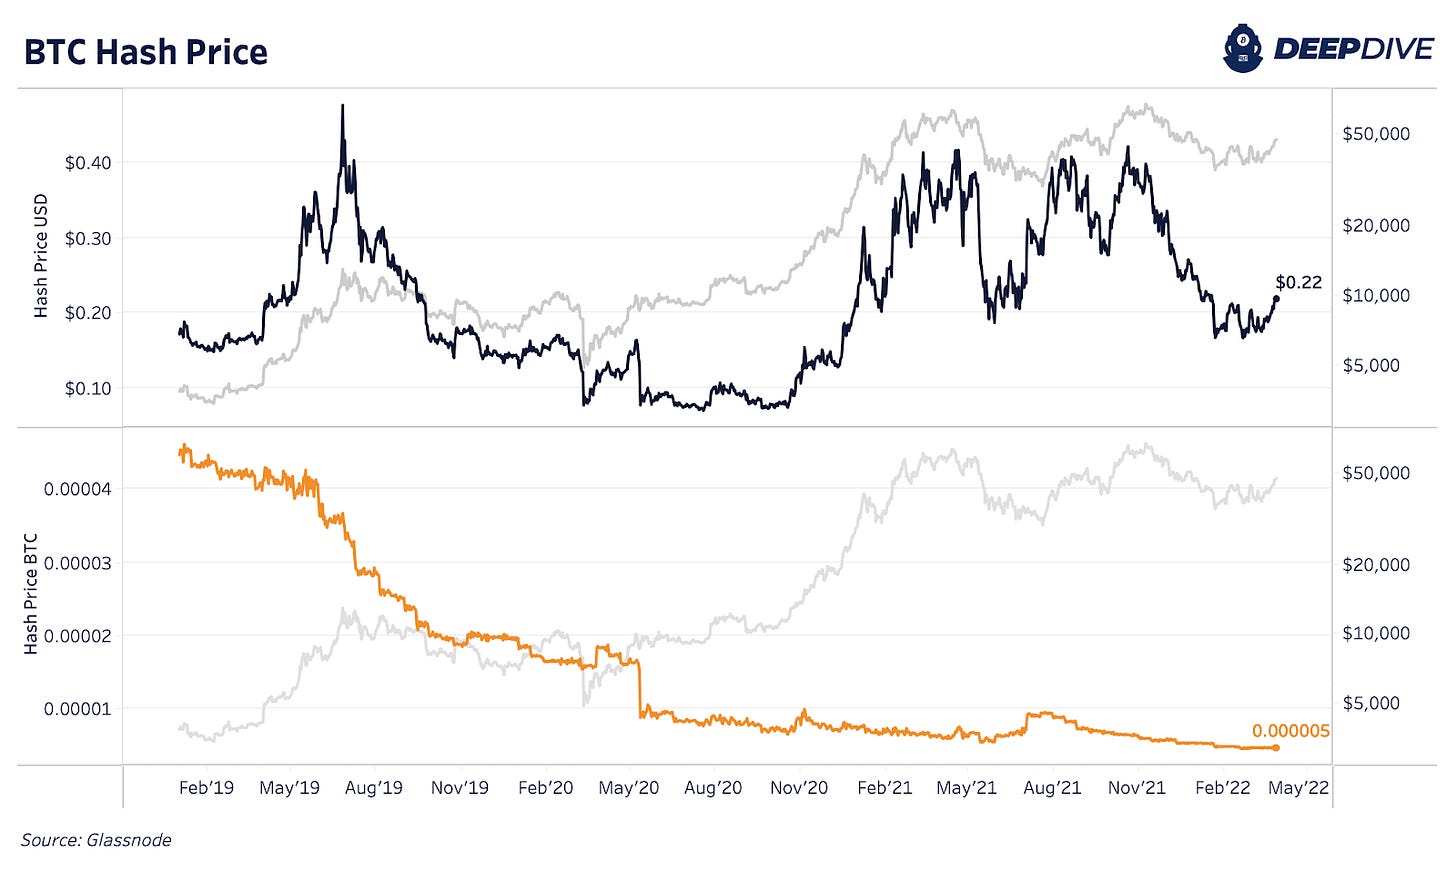
With the recent surge in price outpacing hash rate growth, hash price (USD revenue per terahash per day) is $0.2179, up 30.71% from its recent February low. This will be a welcome short-term sign by miners as profitability rises outpace hash rate expansion plans. Hash price over $0.20 has been a golden era for miners’ profitability as they have been expanding capacity to take full advantage of the opportunity.
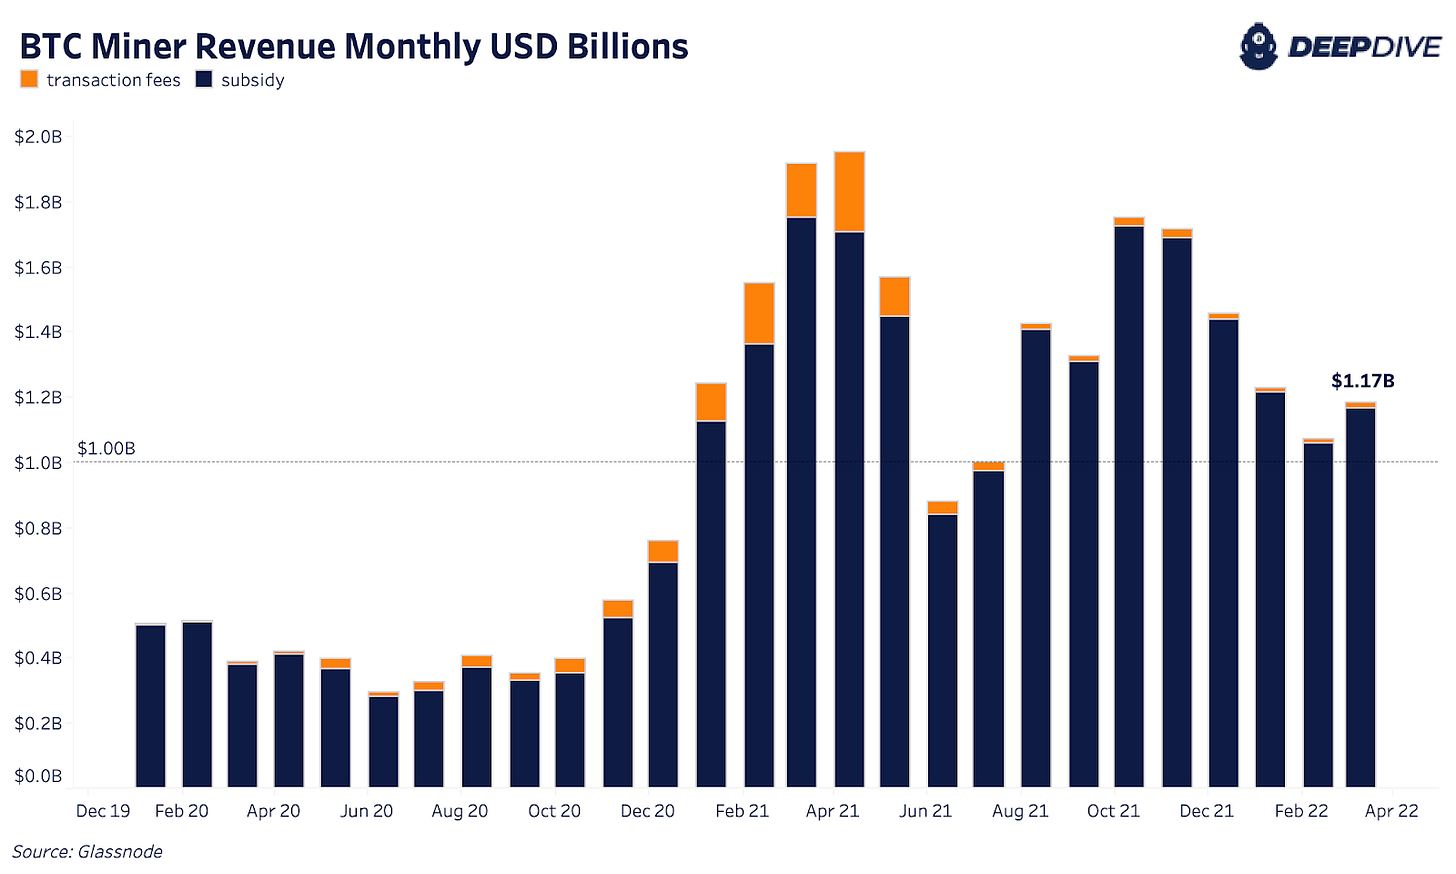
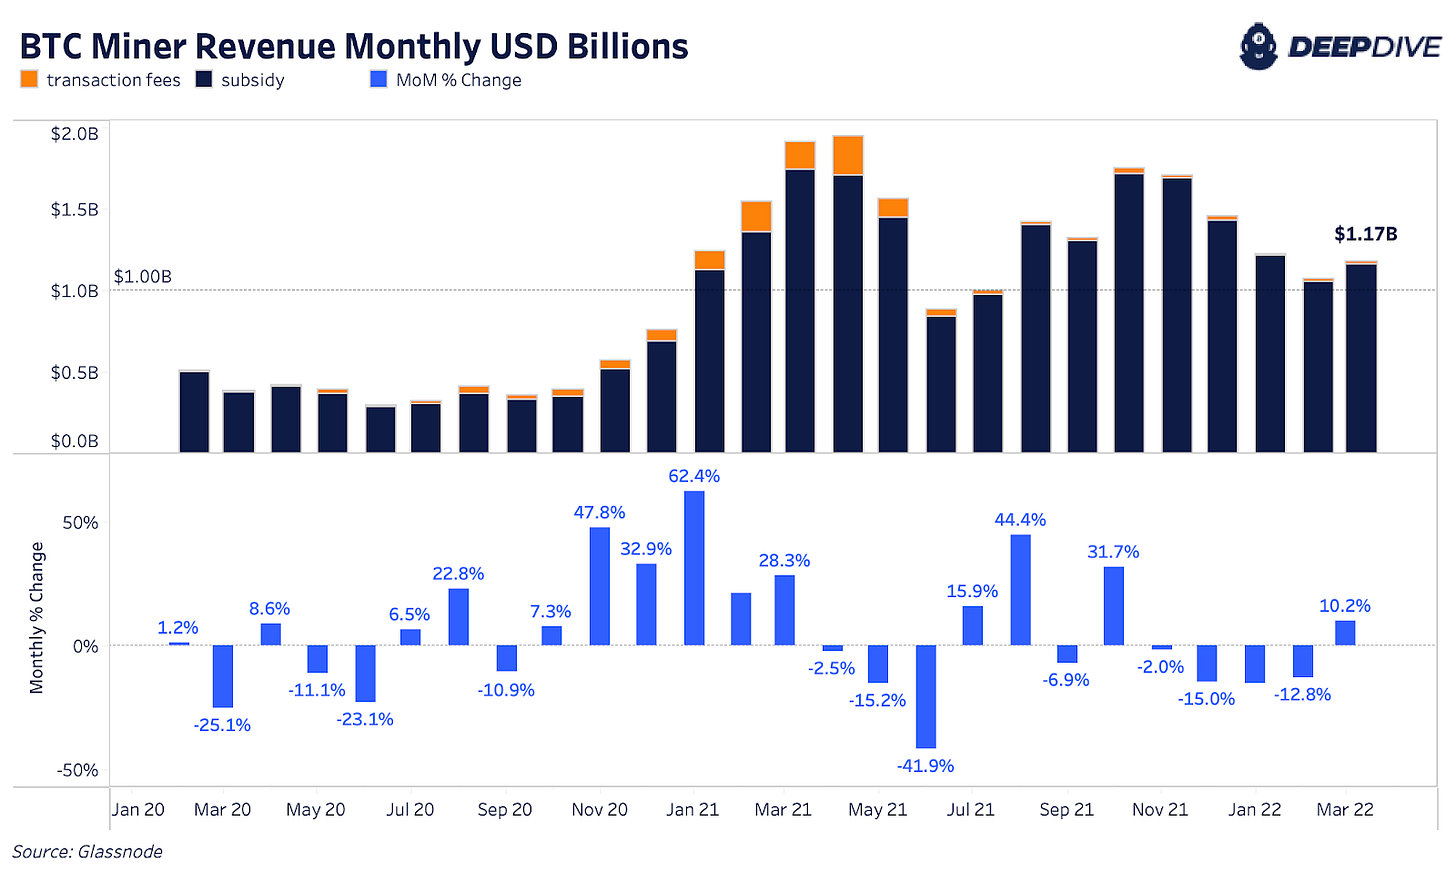
So far this year, the mining industry is pulling in over $1 billion in total revenue per month across Bitcoin’s block subsidy and transaction fees. At the time of writing, miners made approximately $1.17 billion of revenue in March. Although down nearly 33% from monthly revenue last year during the month leading up to miner monthly revenue all-time high, miner revenue grew 10.2% month over month.
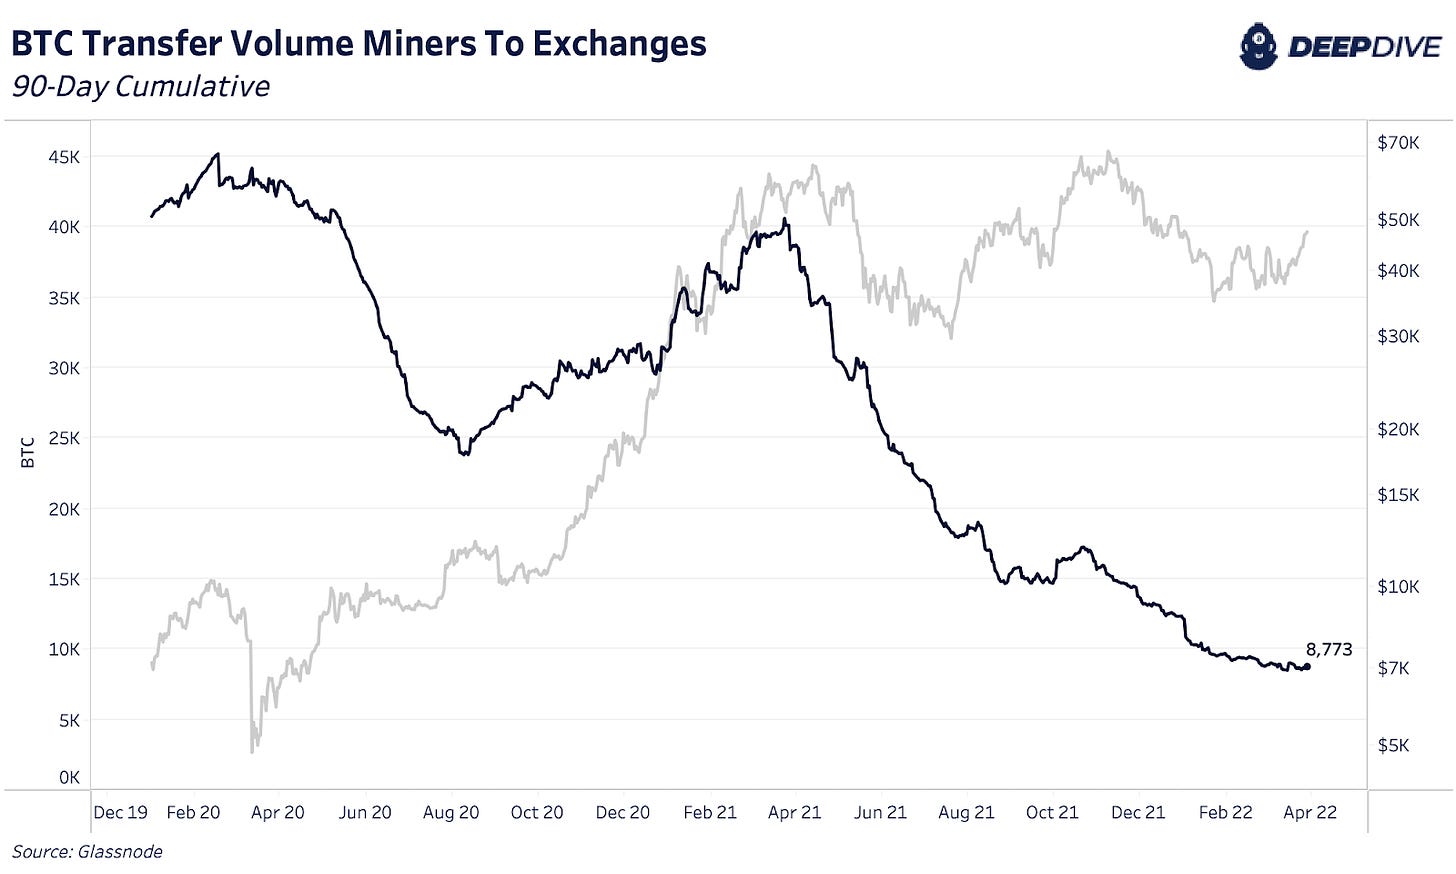
While miners continue to see elevated revenues and strong profit margins, the trend of miners holding their produced Bitcoin continues. As tracked by the transfer volume from known miners to exchanges, only 8,773 BTC over the last 90 days has been moved compared to periods in the past of over 35,000 BTC transferred.
A more macro trend has formed where miners, especially large public miners, are amassing as much bitcoin as possible. The key risk or reversal to this trend playing out would be macro headwinds arriving for risk assets this year forcing bitcoin’s price lower and triggering a miner capitulation event.
But even at the recent lows visited this quarter, increased miner sell pressure seems insignificant to HODLing behavior, indicating that the industry is well-positioned to absorb a severe negative price shock if we’re to see one.
The key mining news released this month was Exxon Mobile’s partnership with Crusoe Energy surrounding a confidential bitcoin mining pilot program that’s been operating over the last year in North Dakota as a viable alternative to natural gas flaring. With bitcoin mining as a new incentive, a multi-decade long problem is finding a unique solution. As Cully Cavness, president of Crusoe Energy highlights,
“Solve the energy appetite of bitcoin and solve the stranded energy, flare gas problem for the energy industry.”
We only expect these types of programs to expand and this trend to continue as the United States now has both ExxonMobile and ConocoPhillips — two of the largest energy companies in the world — assessing the viability and integration of bitcoin mining.
Macro Landscape
The highest consumer price inflation in four decades. That has been on top of everyone’s mind since November when inflation continued to increase instead of being “transitory” as the political class and officials at the Federal Reserve had promised.
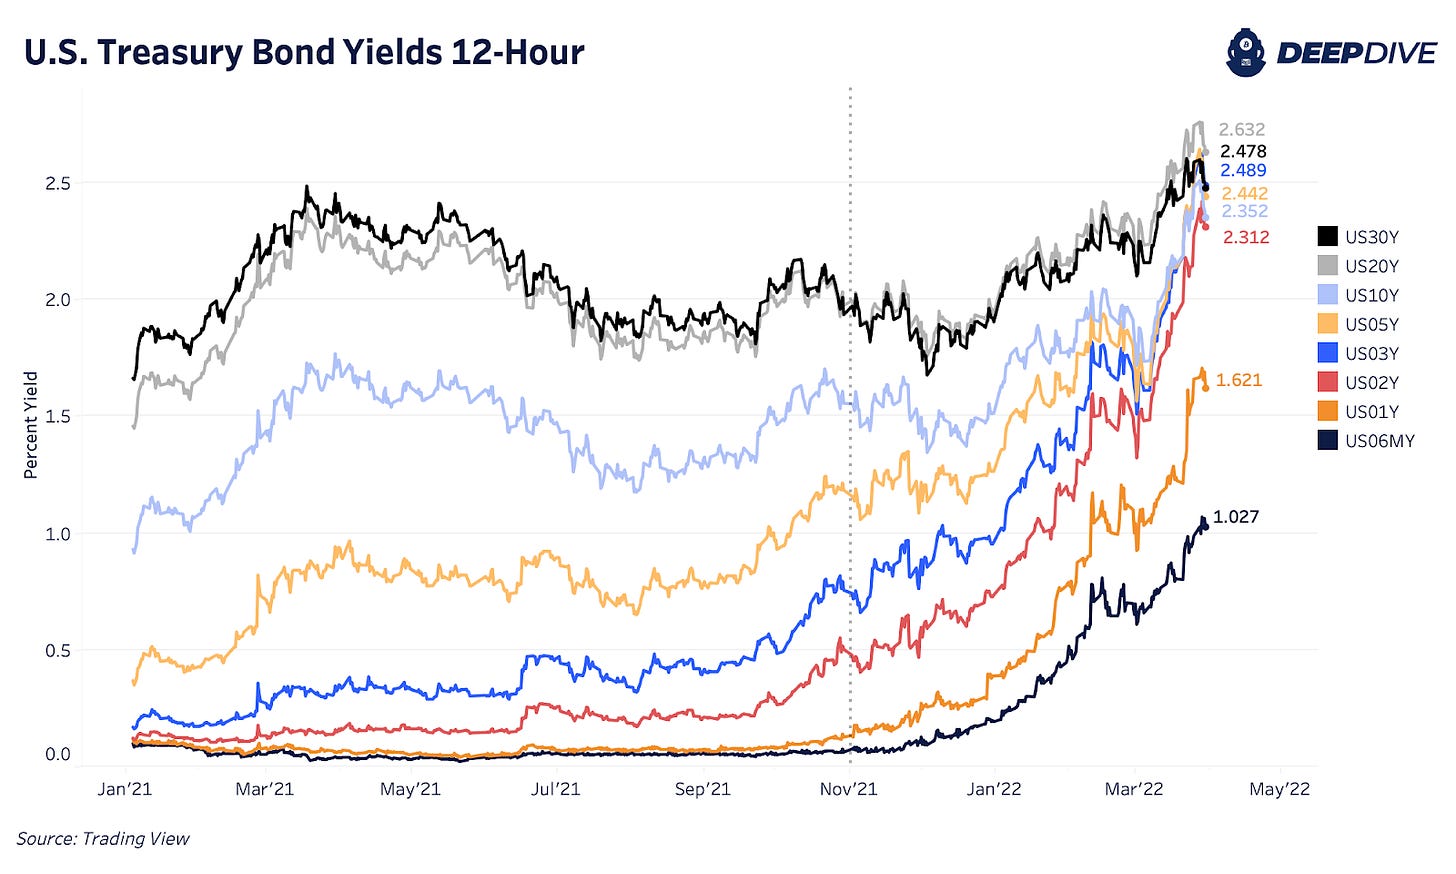
What has followed has been a broad-based selloff in fixed-income securities, most notably in the U.S. Treasury market, where front-end yields have risen aggressively. This has led to a sharp selloff in risk assets since November 2021.
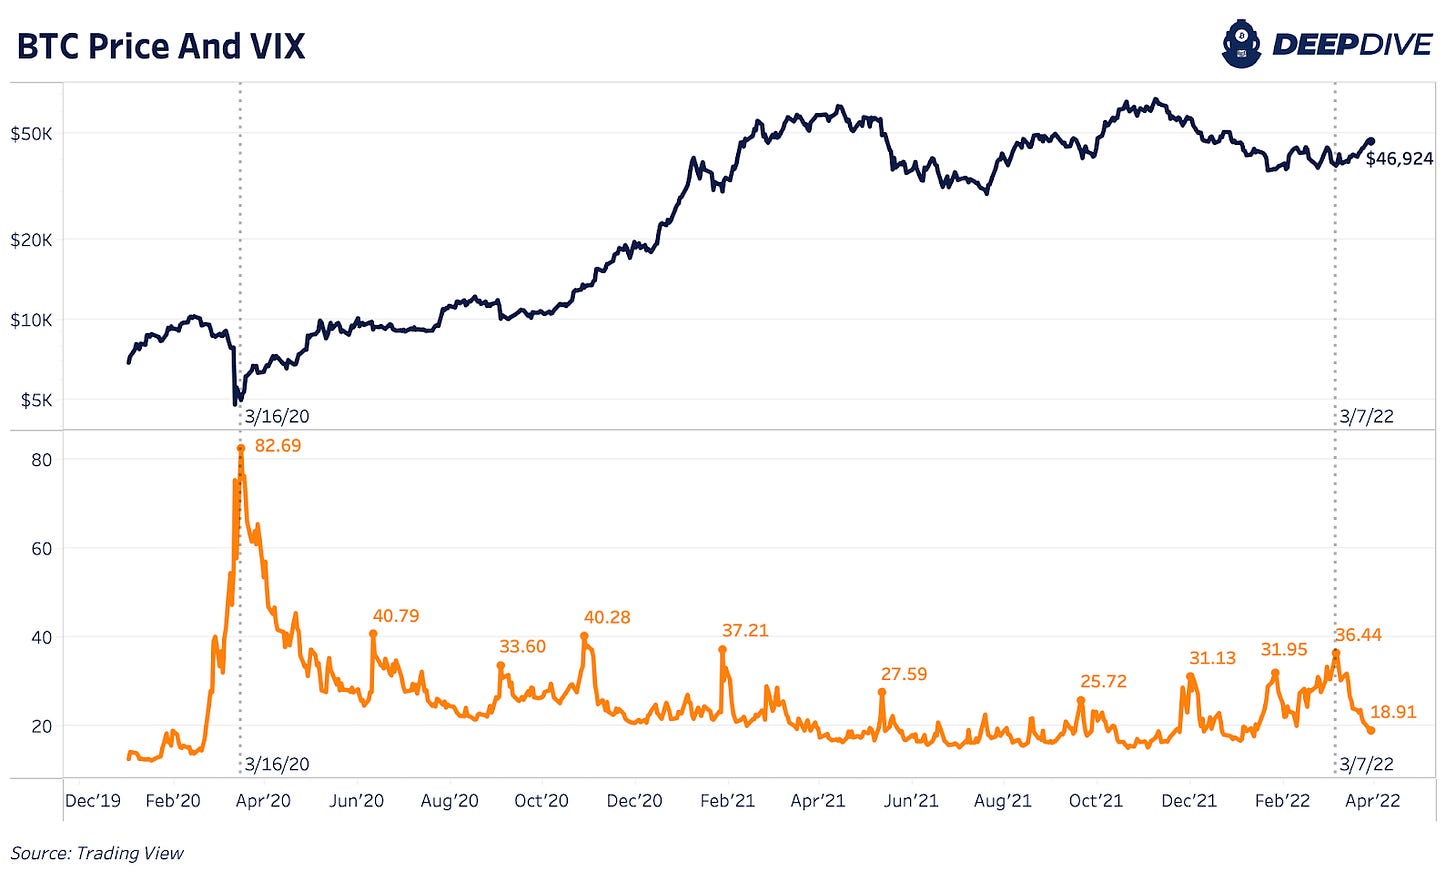
In our previous monthly report, we discussed the macroeconomic backdrop in great detail, including the spike in volatility and the deteriorating credit markets. Since then, risk assets have bounced meaningfully, with equity market volatility as defined by the VIX falling significantly.
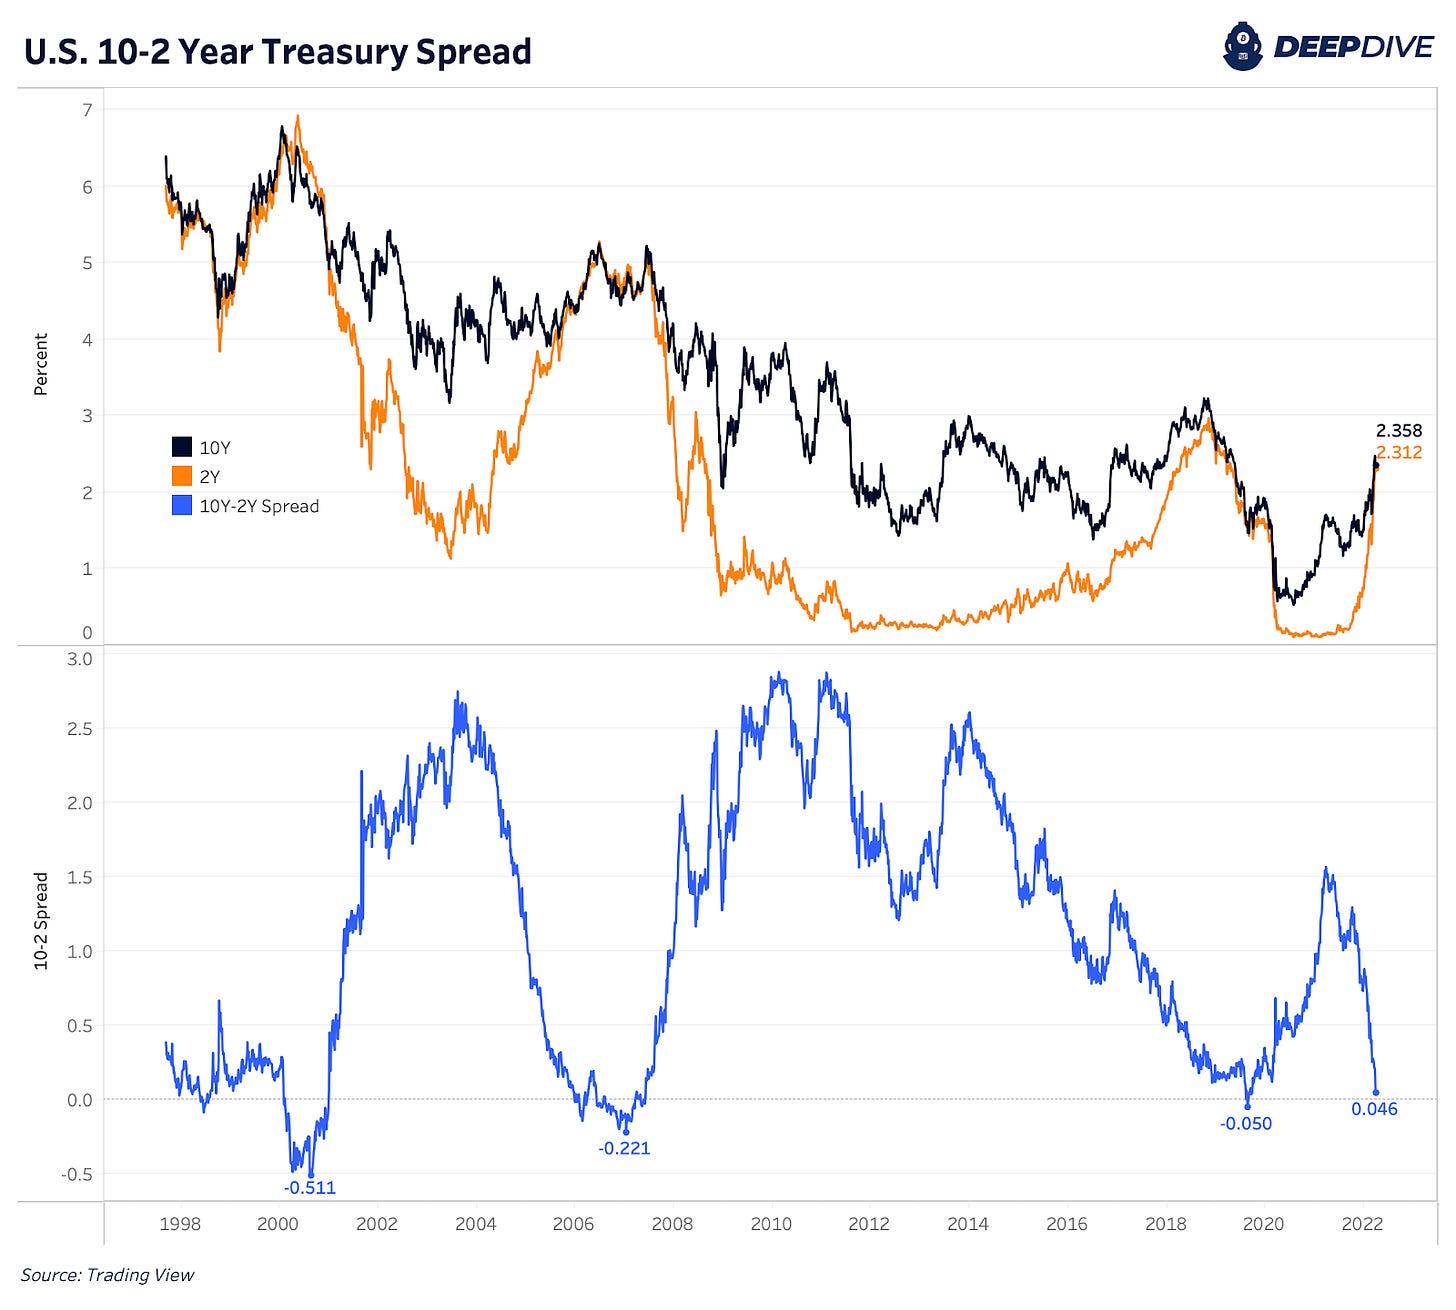
While credit, equites and bitcoin have bounced in tandem from their February lows, many signals in the traditional markets are still pointing to troubling times ahead, with the difference in yields between the 10-year and two-year U.S. Treasury likely holding the most significance.
The yield curve, which has famously predicted every recession since the 1960s with an inversion, briefly fell below zero this Wednesday. However, whether an official inversion has technically occurred or not, the signal remains, and it presents problems for the legacy financial system.
A yield curve inversion presents such a large problem in the banking system because creditors build their business model on the ability to take on short-dated liabilities to acquire long-dated assets (i.e., borrow short to lend long to capture a spread). When the yield curve inverts, it breaks this mechanism, and leads to liquidity issues in a credit system that is dependent on rolling over debt to maintain functionality.
With this in mind, coupled with the soaring price of commodities and impacts of rising yields, the economy appears to be headed towards a recession. While the timeline is not definitive, a slowdown in growth is coming and it doesn’t bode well over the short/medium term for risk assets.
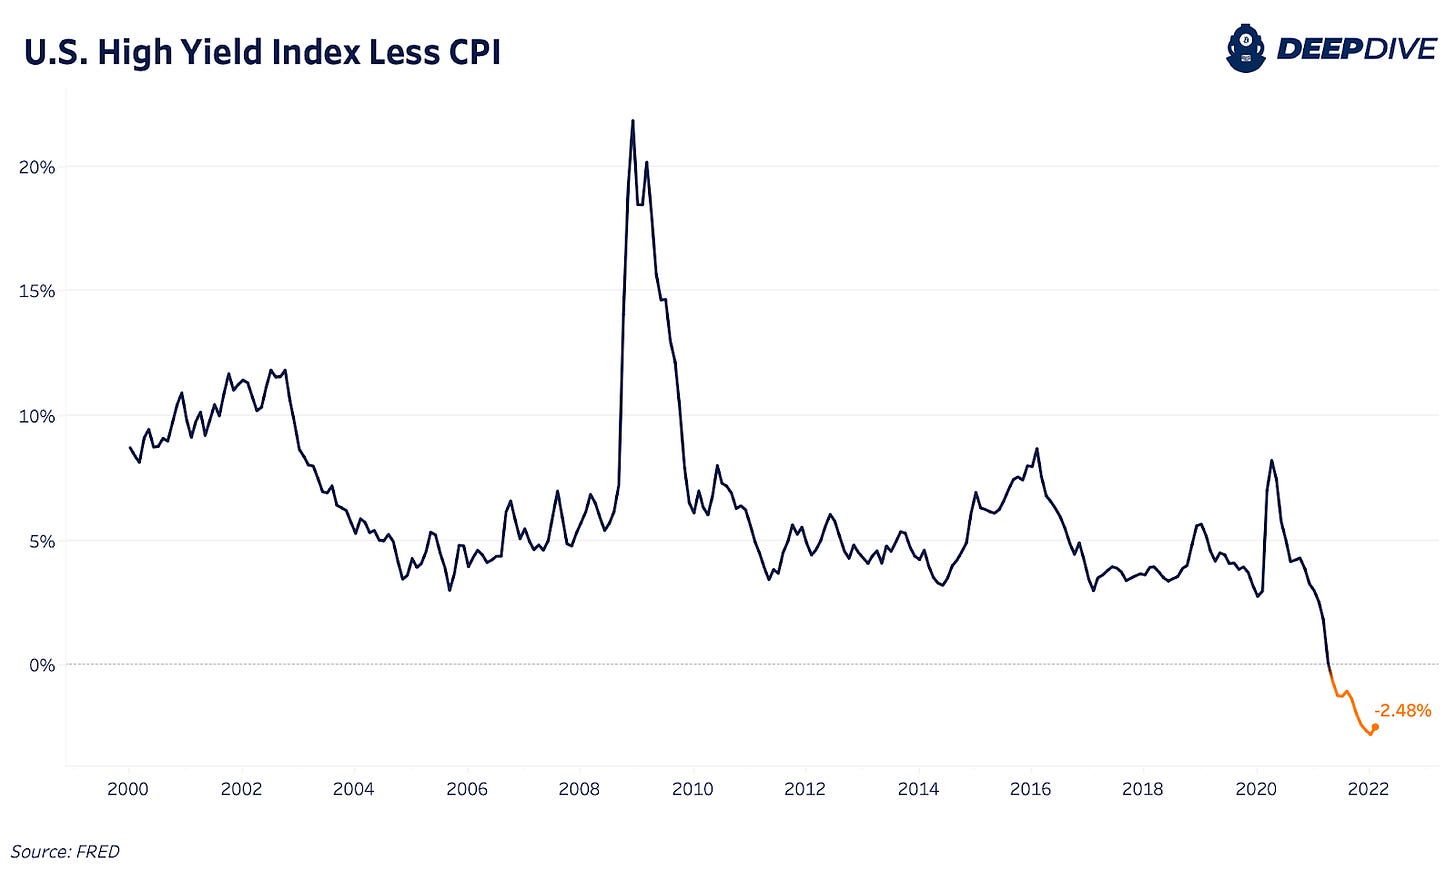
This comes at a time when credit markets still remain completely distorted from reality, with real yields across the board deeply negative. Even corporate junk bonds currently carry a negative real yield, meaning that bond investors are guaranteed to lose purchasing power before accounting for default risk.
One can assume that if inflation continues to accelerate, corporate credit instruments will continue to perform poorly, leading to even higher yields in a historically over-indebted economic system.
Market Outlook And Concluding Thoughts
The biggest risk factor to the bitcoin market over the short/medium term remains a broader risk-off move in credit and equities, as a large class of investors continue to treat bitcoin as a “24/7 inverse VIX. However, any market downturn isn’t likely to be sustained, due to the further monetary and fiscal stimulus that would follow such a move in markets. While the Fed has voiced their intentions to tighten, it remains somewhat of an impossible task to meaningfully raise interest rates for a sustained period of time given the debt dynamics of the domestic and global economy. Real rates will remain negative (treasury yields minus year-over-year CPI) due to the size of the Federal debt burden relative to gross domestic product, and thus, we remain supremely confident in the need for a credibility neutral, non-sovereign, absolutely scarce reserve asset.
Supply side dynamics in the bitcoin market look extremely strong, and bitcoin-native derivative markets have been sufficiently risk-off months.
The stage is set for the next bull market, it is now simply a matter of waiting for the hundreds of trillions of dollars of capital in global fixed-income markets to realize they are sitting in securities guaranteed to debase in real value.
Bitcoin will be waiting.




I wanted to get Deep Dives thoughts on having the same charts posted more frequently so that we can use them for making decisions. Some of the charts are so periodic/infrequent that the information can't be used for investing purposes.