


Backtesting On-Chain Indicators
In previous Daily Dives and analyses, we’ve highlighted the importance and trends of major on-chain cyclical indicators across the realized HODL ratio, market-value-to-realized-value z-score, reserve risk, dormancy flow, 90-days coin days destroyed and the ratio between short-term holders and long-term holders. The analysis today covers these metrics in aggregate including the Mayer Multiple.
By no means are these metrics perfect at predicting the market in the short term but they do provide us with valuable insights on when the market may be at a secular or cyclical turning point. We prefer to use these metrics together to get confluence around long-term signals and changing behaviors in the market.
One way to do that is to look at these top on-chain metrics across their historical percentile distributions in different time periods. For example, when a metric is at or above its 95th percentile, it may be signaling a unique, overheated period in the market. This holds true for when metrics are at or above lower percentile thresholds which can signal an overcooled period in the market.
To make sense of the percentile data for each metric, we segment the percentiles into five different groups and colors ranging from dark green to green, yellow, orange and red. Lower percentiles correspond to the greens while higher percentiles correspond to orange and red.
After going through approximately 20 on-chain macro indicators, our general criteria for percentiles and colors are shown below. That said, we subjectively adjust each metric’s percentile threshold based on the historic performance so not all will follow this template exactly.

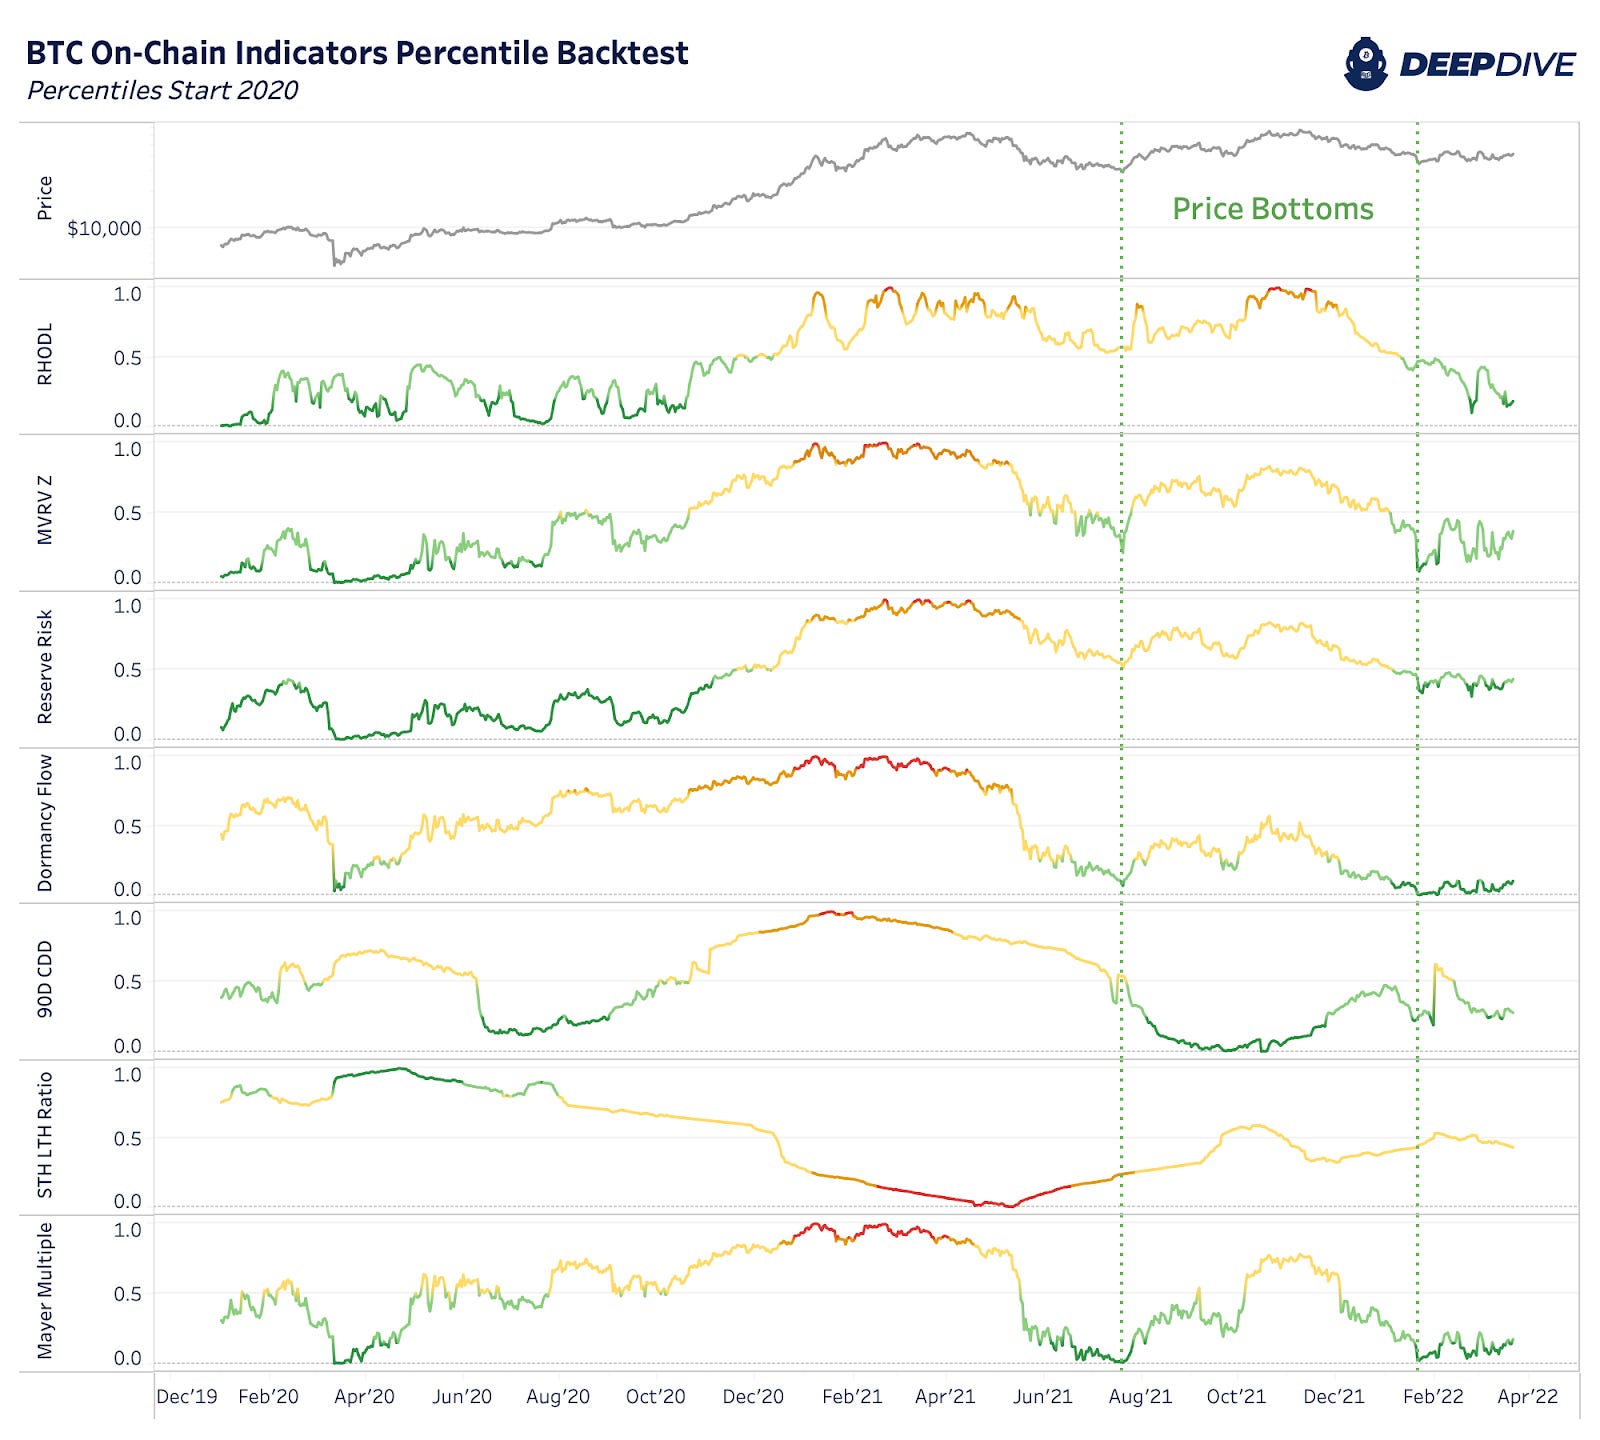
Doing it this way provides us with a stacked view of indicators during previous price bottoms and price tops. Below you can see how some of the best on-chain indicators did well at identifying the March 2020 bottom and the April 2021 top.
For March 2020, every indicator other than 90-day coin days destroyed were at incredibly low percentiles. January 2022 shows a similar dynamic signaling that we may have already reached the recent bottom around $35,000.
As for the April 2021 top, every indicator in this analysis was showing overheated signs right before or during the price peak.
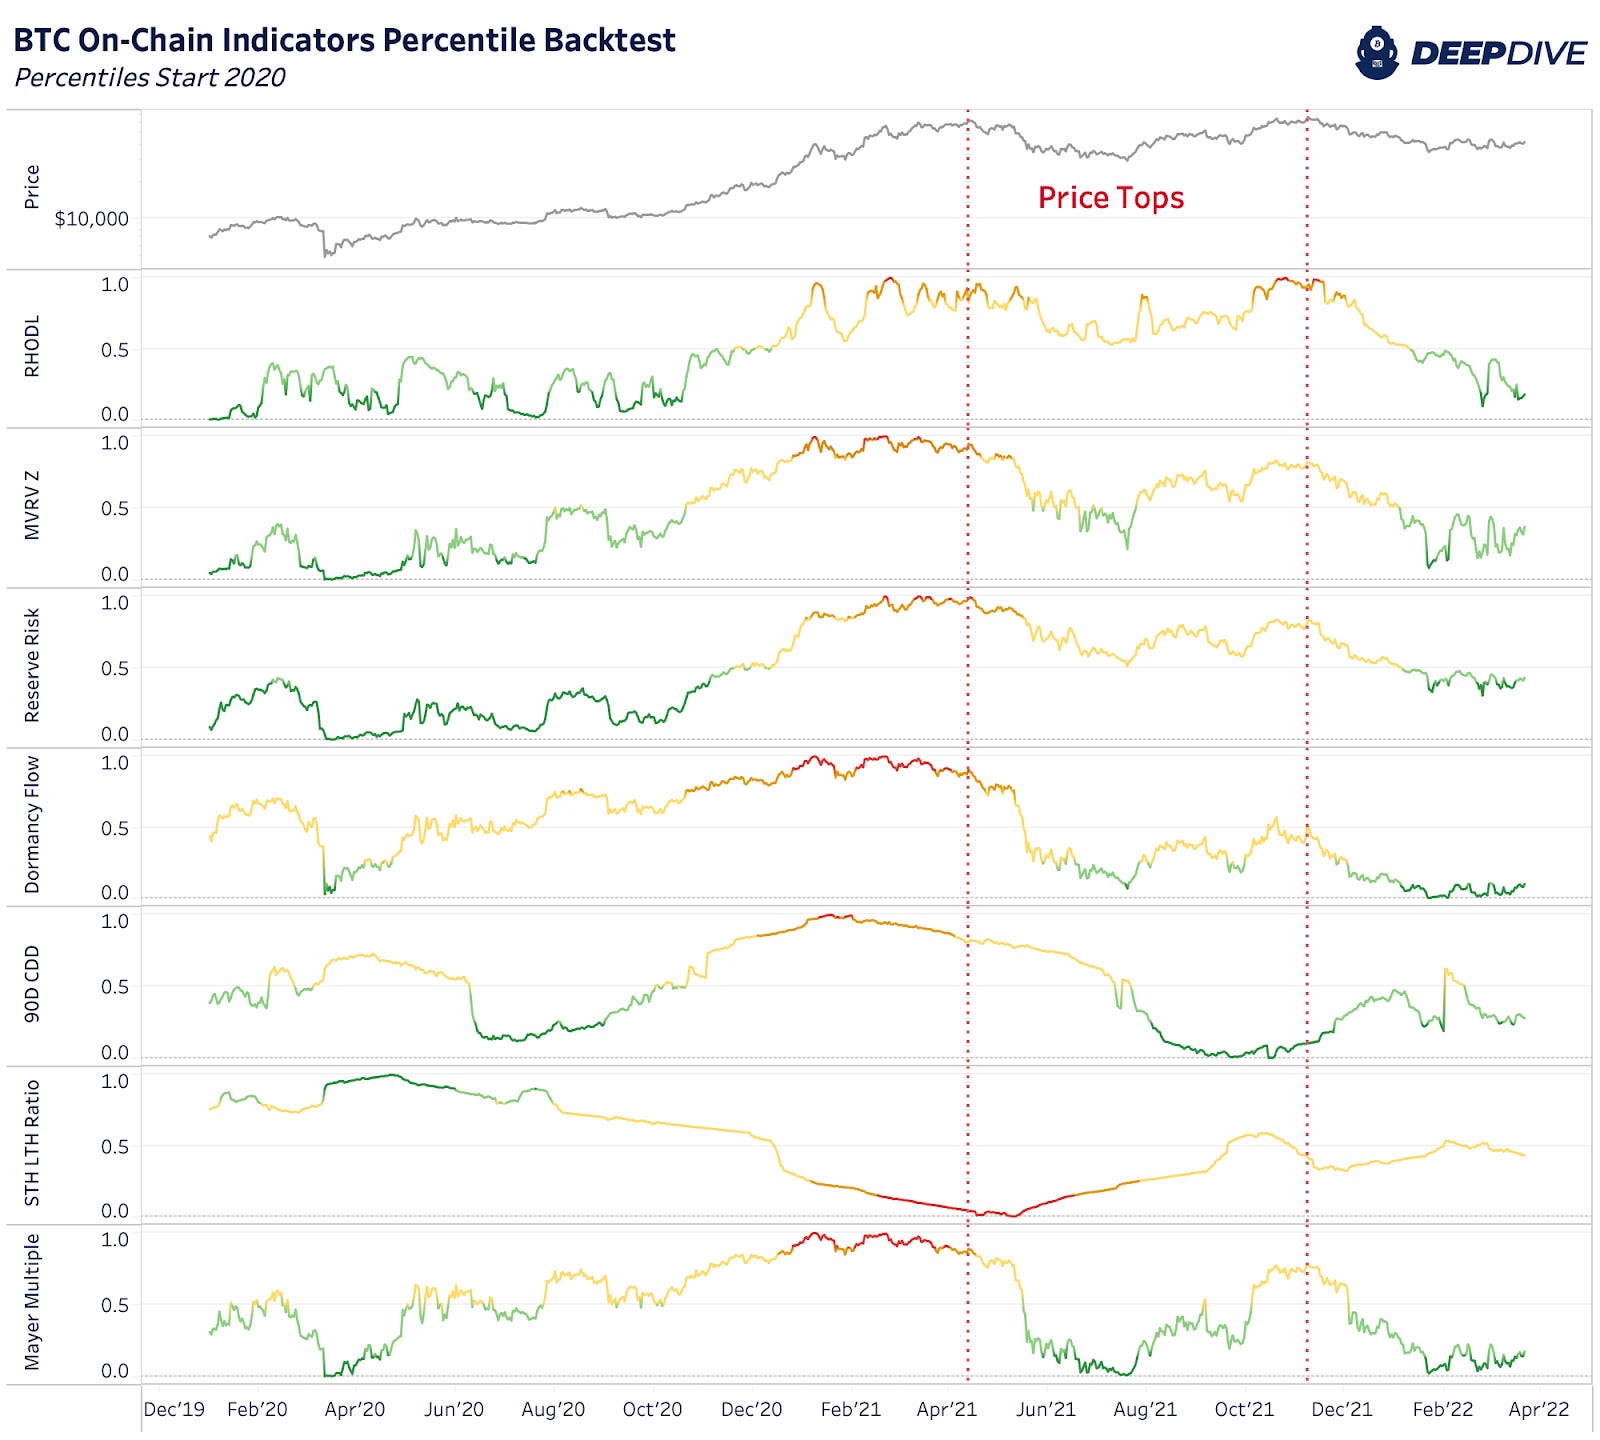
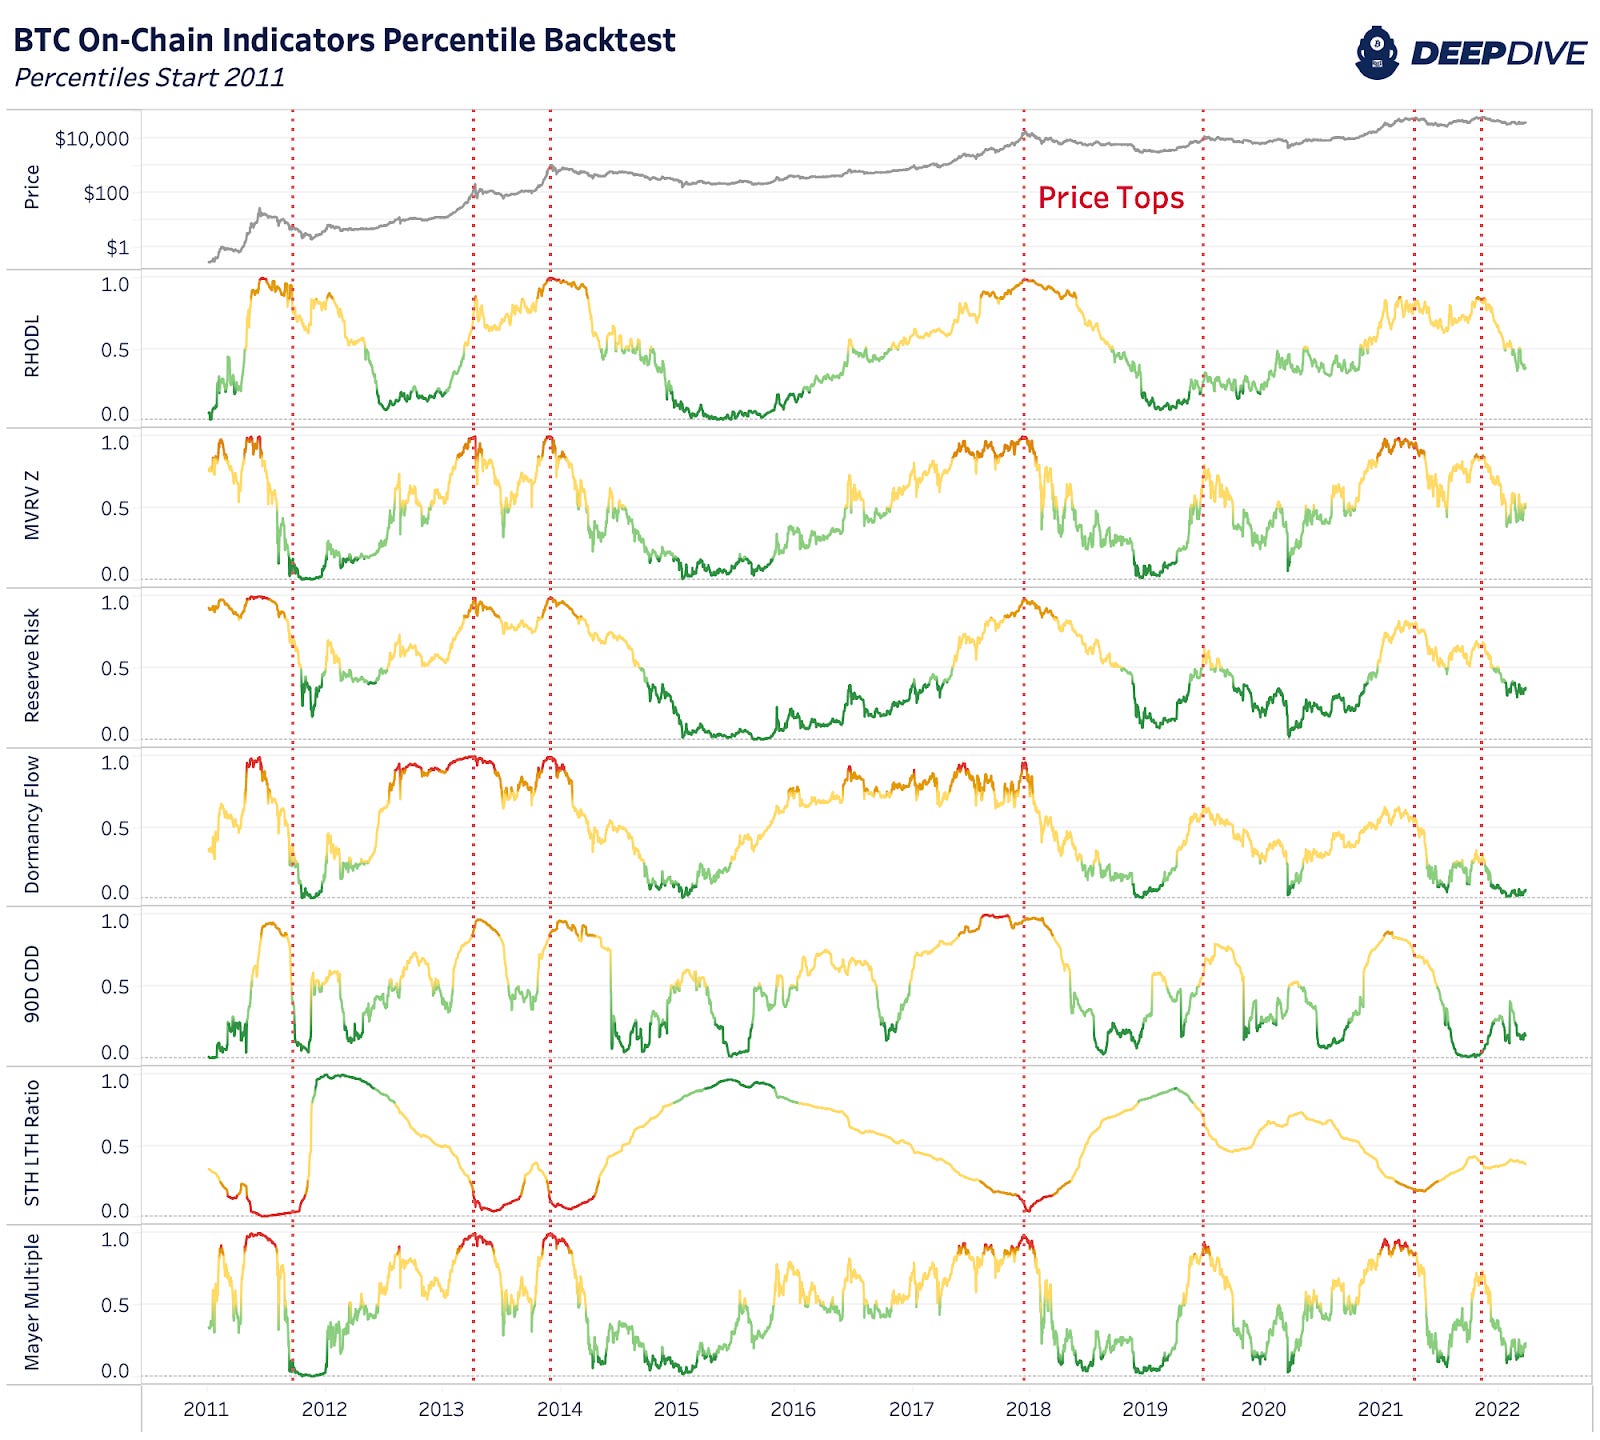
The caveat here is that as bitcoin matures and volatility falls, comparing on-chain indicators to the full history may not give the best results for their predictive power in the future. If we’re to continue to see less blow-off-top events in price then that will also be reflected in many indicators. The two charts above leverage data and percentiles that start in 2020 to show a more recent view. So what does a full historical view from 2011 look like?
The key takeaway from the 2011 view below is that more of the lower-threshold percentiles show up as there is a much wider range for the data to fall in this category (0%-20%). On the other hand, using historical data from 2011 didn’t do that well at signaling the April 2021 top as half these metrics never reached their 98th percentile while price never really had a “blow-off” event like previous cycles.

Final Note
There are key on-chain indicators that are valuable in determining long-term cycle tops and bottoms. Yet as Bitcoin matures and changes, so do the analytical predictive power of these metrics.
More than ever, it’s key to understand these metrics within the context of the current market conditions across a growing derivatives market, effects of rising institutional adoption and an unprecedented time of macroeconomic uncertainty.
It would be great Dylan to have a systematic update of these indicators in order to have a broader perspective on the onchain situation, what do you think?