The Deep Dive Monthly Report, July 2021
Summary:
On-Chain Analysis
Illiquid Supply, Reaccumulation Phase
Exchange Balances
UTXO Distribution
Bitcoin Native Leverage And Derivatives
Stablecoins vs. Bitcoin Collateral
Naked Shorting, Short Squeeze
Contango Yields
Hash Rate And Bitcoin Mining
Hash Rate Recovery, Difficulty Adjustments
Bitcoin Miners Daily Revenue
Macroeconomic Backdrop
Long-Term Debt Cycle
Real Yields, Rising CPI, “Transitory Inflation”
Treasuries, Bond Bulls
Implicit Short USD & Short VOL Positioning
Long VOL w/ 0 Theta
Supply Reaccumulation
The overarching trend in Bitcoin since the start of 2020, but more broadly, over the course of bitcoin’s history, has been an increasing amount of the network's verifiably scarce supply becoming illiquid.
The hoarding of supply, or as bitcoiners call it, “hodling,” creates a virtuous cycle of adoption, as an ever growing number of proponents/adopters are competing to acquire an ever shrinking free float of supply, which in turn attracts more curious individuals to learn about bitcoin and the attributes which make it objectively the best monetary asset humanity has ever seen.
This broad trend of growing illiquid supply causes what some bitcoiners refer to as “number go up” technology, which is a great simplification of what bitcoin has done historically better than any other asset — accruing additional value, in exponential waves of adoption and price appreciation.
With an absolutely scarce supply, and an ever-increasing pool of network participants, betting on bitcoin to stop its trend of exponentially increasing in value over time is extremely unwise, even if growth on a percentage basis is less explosive than it was during the network’s early days.
Illiquid Supply
Read here for more information on the classification between liquid and illiquid supply.
As July arrived, a sudden and sharp increase in previously illiquid supply becoming liquid helped to send the price spiraling downwards as sentiment quickly changed and over-leveraged speculators sold positions at a loss, or were liquidated entirely.
Our views have stayed unchanged since the middle of May, that a deviation from the broad trend of illiquid supply increasing (thus more dollars changing for the marginal unit of bitcoin) does not mark the conclusion of the trend, but instead a momentary pause while coins are reaccumulated from weak hands.
Liquid Supply Change
One of the hardest things for many market participants to understand about bitcoin is that price does not go up on good news; price goes up when the marginal seller has been exhausted, which may or may not be influenced by the news cycle. It is the first point however that is fundamentally important to understand.
In a global market that has some liquidity in every technologically-able market on the planet, price is entirely set by the marginal buyer and seller; and against an ever-growing passive daily buyer base, the marginal seller is very often the driver of price.
This is why looking at illiquid supply can provide value to investors looking to visualize changes in trend and holder behavior.
On May 18, the previous 30 days saw 248,529 bitcoin re-enter the liquid supply, as 2021 investors capitulated for historic levels of realized losses on-chain in May and June. On July 6, we said the following regarding the on-chain reaccumulation that was taking place:
“When a breakout comes, it seems extremely likely to come on the upside, as strong-handed hodlers have once again begun to aggressively accumulate.” - The Daily Dive #016 - Price Consolidation Continues
The price has since rallied approximately 20% and we expect further momentum to the upside over the course of the third and fourth quarters of 2021.
Highly correlated to changes in liquid/illiquid supply is the aggregate bitcoin balances across exchanges. While not every buy/sell goes through an exchange (i.e., settlement between two counterparties directly on-chain for goods/services), the BTC/USD exchange rate is set by spot bitcoin demand for bitcoin across various exchanges.
WIth the sharp increase in liquid supply during the month of May came a corresponding increase to bitcoin balances across exchanges.
Exchange Balance
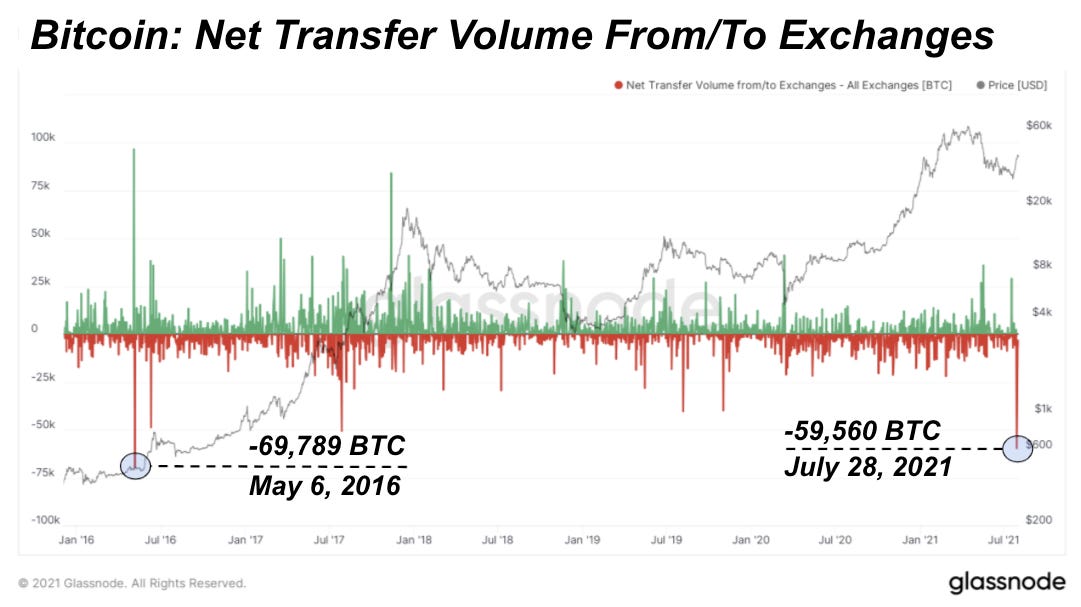
Analyzing total exchange balance data, gives further confirmation that coins are being removed from weak hands and placed into strong hands. At the end of July, we saw one of the sharpest declines in exchange balances in all of bitcoin’s history.
From the start of 2020 to April of 2021, bitcoin balances on major exchanges had decreased by more than 600,000 bitcoin in what was one of the most aggressive accumulation trends ever witnessed.
However, in lockstep with the reversal in liquid supply, exchange balances increased sharply from the 2021 low set on April 11 of 2,462,506 bitcoin to 2,525,228 bitcoin at the peak on May 19.
The most notable aspect is the ensuing decline that followed, with aggregate bitcoin on exchanges near 2021 lows, currently at 2,480,631 bitcoin.
This is following an eye-popping 59,560 bitcoin of net outflows across exchanges on July 28th, the single largest daily amount of net outflows witnessed on the network in 1,909 days.
UTXO Price Distribution
Looking further into accumulation dynamics, when looking at the UTXO distribution that has occurred over the last three months of price consolidation, over 20% of the circulating supply has been moved on-chain between the $29,000-$42,000 levels.
Contrast this to the near 23.1% of supply that is classified as liquid, and you potentially get an explosive move to the upside.
The longer a given consolidation occurs, due to the actions of the “bitcoin DCA (dollar cost averaging) army,” eventually willing sellers within a given price range disappear. One can expect a slight amount of resistance during the eventual climb back to all-time highs for bitcoin, with some amount of the 11.39% of circulating supply still at a loss looking for exit liquidity when once again above breakeven on their investment.
Spot Supply Shock And Derivative Markets Exacerbation
Now that we have covered the underlying supply dynamics in the spot bitcoin market, let’s dive into the latest for the bitcoin derivatives markets.
In The Daily Dive #024 - A Dichotomy Emerges, published on July 16, we highlighted the developing dichotomy between spot accumulation and bearish sentiment in the bitcoin derivatives markets:
“Following the COVID crash of 2020, bitcoin traders turned notably bearish for the months of March and April. This was at a time (highlighted in the beginning of the newsletter) where bitcoin was moving into illiquid supply (strong hands) at a feverish pace.
“This divergence during the extended consolidation period last summer led to an explosive breakout after the market had realized: nearly all of the bears and large sellers in the market had already sold…
“Now, we are witnessing the same trend beginning to unfold… Derivative and futures traders are bearish. Bitcoin stackers and hodlers are bullish. An explosive dichotomy in the market is beginning to emerge.” - The Daily Dive #024 - A Dichotomy Emerges
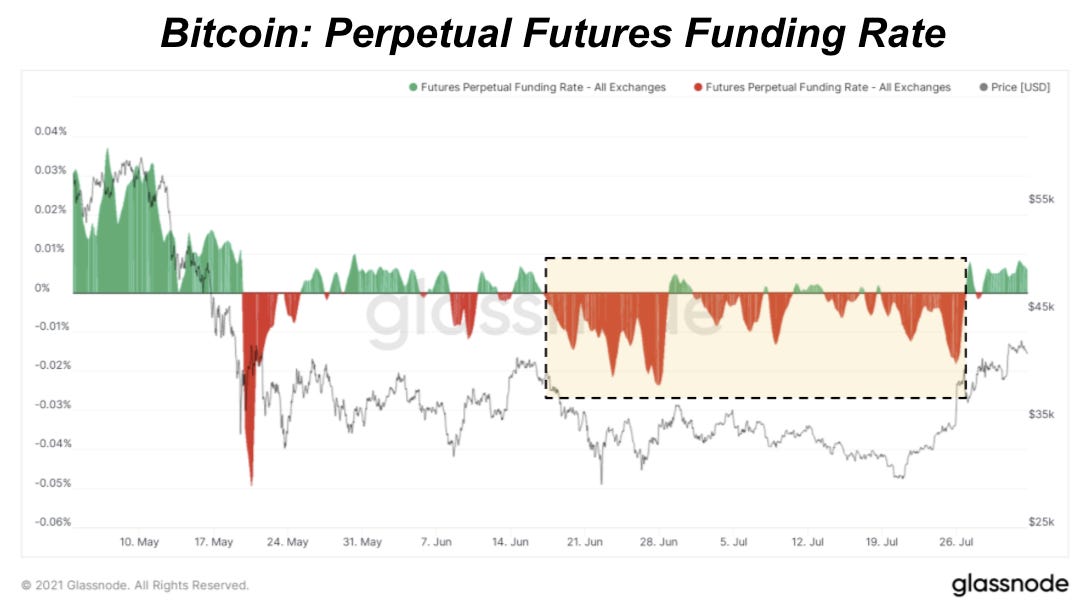
In particular, shorting the bitcoin perpetual swap futures contract became a crowded trade for the majority of the months of June and July. This can be seen by the sustained periods of negative funding (i.e., shorts pay longs to open and hold positions).
More specifically, a large amount of the downwards pressure coming from derivatives markets was from the Binance exchange, where traders were relentlessly shorting using stablecoins (USDT in particular) as margin collateral.
Looking at cash-margined futures contracts on Binance, open interest hit all time high levels late in the month despite the price of bitcoin being nearly 50% lower.
As covered in previous Daily Dives, with bitcoin derivatives, you can either use bitcoin or stablecoins as margin.
If you margin long bitcoin with bitcoin as collateral, during a downturn your collateral decreases in value in lockstep with your position. Likewise, if you are shorting bitcoin futures with stablecoins as collateral, the asset that you need to cover is appreciating against the collateral you used to enter a short position. In The Daily Dive #028 - Structural Changes To BTC Derivatives Market, published on July 23, we went further in depth on this subject matter.
Thus, if a large portion of the market is short bitcoin derivatives using stablecoins for collateral, explosive short squeezes are possible. These derivative traders are essentially naked short bitcoin that they don't actually have.
Below we have the same chart as above, showing bitcoin dollar-margined futures open interest on Binance, but this time denominated in BTC. As labeled, open interest declined by the equivalent of 19,000 bitcoin over a six day period as the price popped from $34,000 to near $40,000 in the evening hours of Sunday, July 25.
As certain market participants learned, it is quite dangerous to be naked short an absolutely scarce asset, especially while supply is being pulled off the market at an aggressive pace.
Contango Begins To Reemerge
Bitcoin’s contango has started to reemerge amidst the recent rise to the $40,000 level. Annualized basis across bitcoin futures contracts flirted with negative territory for much of May through July across exchanges, but the recent rally off of the lows could have changed sentiment for the better.
A positive futures curve is wildly bullish in our view, as the global financial system continues to search for yield opportunities, and a delta-neutral trade offering even 5%+ in an increasingly liquid global market will continue to attract new capital, who will have to enter a spot position to gain exposure to the increasingly well-known trade.
Hash Rate Recovery
Following one of the biggest network stress tests bitcoin has ever seen (i.e., the mass hash rate migration out of mainland China) the bitcoin network saw four consecutive negative difficulty adjustments.
The month of July saw three difficulty adjustments: -27.94% on July 3 (block 689,472), -4.81% on July 17 (block 691,488), and an upwards adjustment of 6.03% on July 31 (block 693,504).
Following the mass relocation of ASIC miners (of which a majority are still in transit or storage due to a large shortage of ready-to-deploy rackspace) the bitcoin hash rate seemed to have found a bottom during the month of July, with a peak-to-trough decline of 51.3%.
The seven-day moving average of network hash rate decreased from an all-time high of 184.1 million TH/s on May 15, to a local bottom of 89.6 million TH/s on July 2, before recovering to a seven-day average of 111.8 million TH/s to close out the month.
With the rebound in hash rate came an increase in daily miner revenue. MIners pulled in $67.5 million/day (seven-day moving average) on May 12, before experiencing a decline of 70.6%. Daily miner revenue also found a bottom on July 2 at $19.32 million/day, before rebounding over 100% to $39.13 million/day on average over the last week to close the month.
Macroeconomic Backdrop
The macroeconomic backdrop remains entirely unchanged month to month, despite any notable occurrences or events, but nevertheless, the same points deserve to be driven home.
The U.S. domestic financial system as well as the rest of the world has a massive DEBT, D-E-B-T problem, that no one seems to want to solve. Instead, the path forward by almost all parties involved seems to be the path of least resistance: monetary debasement.
The Long-Term Debt Cycle
Look no further than the 10-year treasury for a chart of truth on the current macroeconomic backdrop. The story of the last half century has been diminishing nominal yields, which in turn raised the present value of all assets.
Buy assets with leverage, assets rise in value, increasing credit worthiness, buy more assets with leverage; there is truly nothing like the secular upswing of a credit cycle… except the ensuing bust.
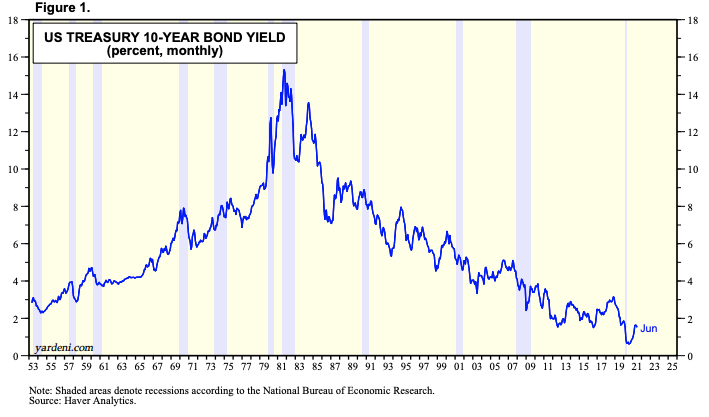
While yields on the 10-year treasury have gone from nearly 16% in 1981 to 1.28% today nominally, in real terms yields are currently deep in the negative, and that may be the only game in town for central banks looking to keep the music playing.

But who in their right minds would want to enter a contract that is guaranteed to have you lose money in the end? After all, year-over-year core consumer price index inflation in the U.S. is the highest it has been in decades.
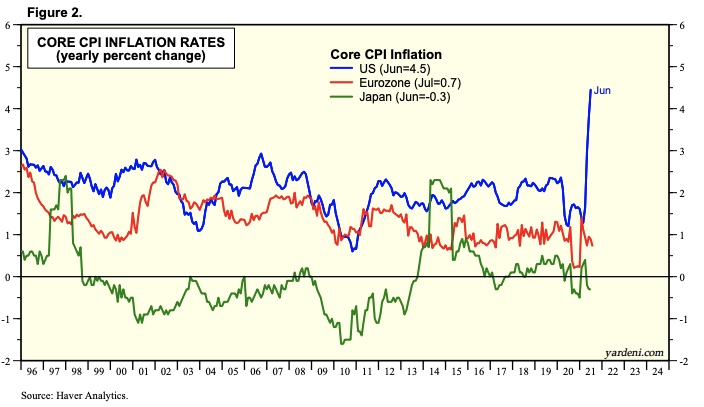
While there is certainly some merit to the transitory nature of prices in certain sectors hit with supply change constraints following the COVID-19 economic lockdowns, these price hikes are transitory only in terms of the second derivative (year-over-year inflation numbers will likely slow down but prices themselves will not retrace).
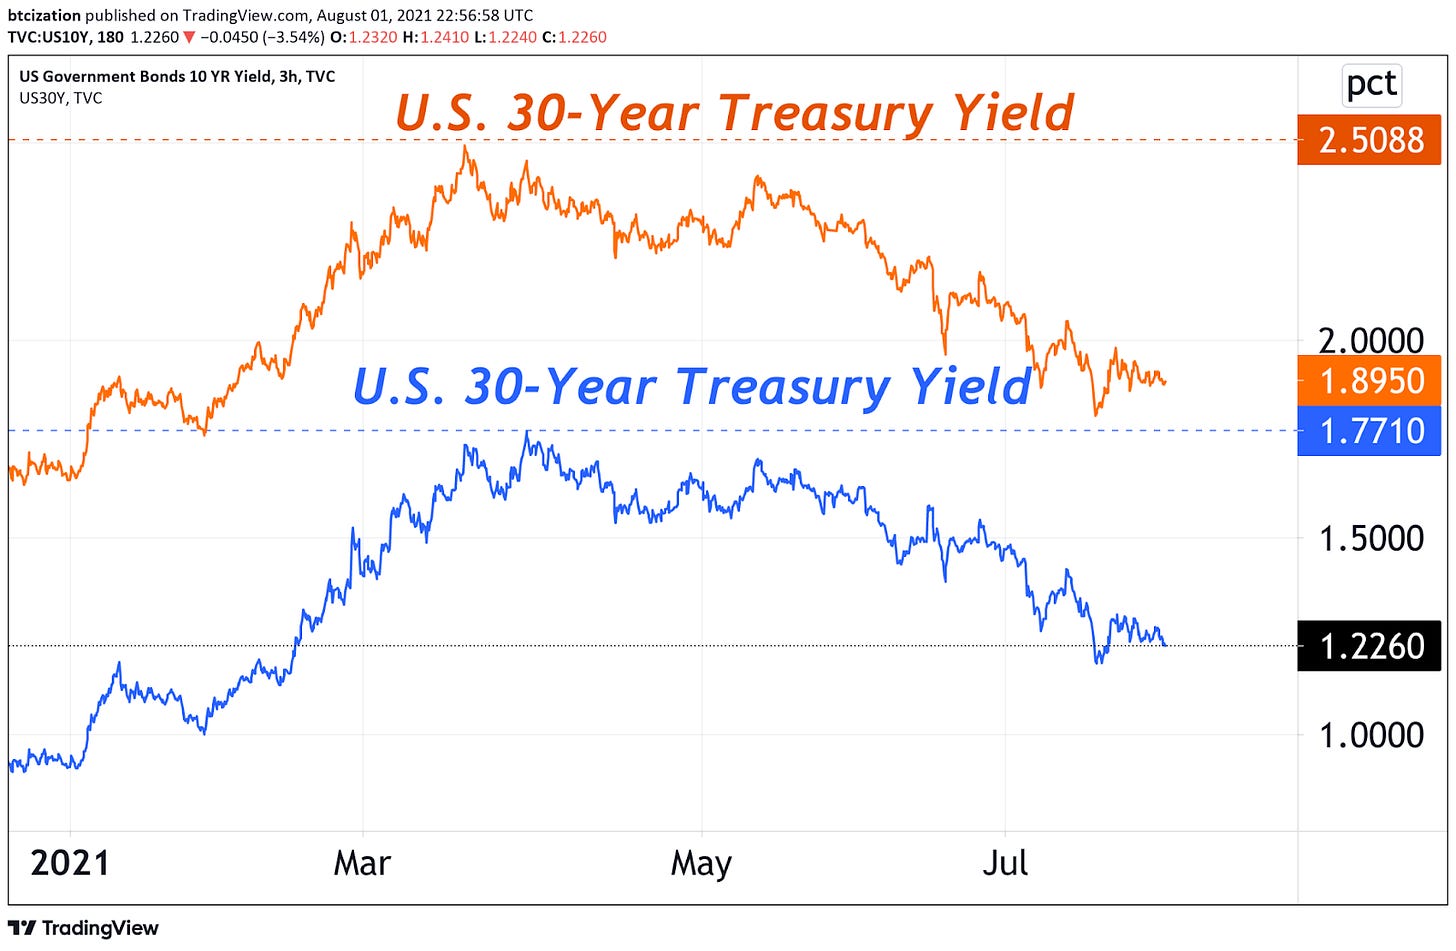
Thus, what is the reasoning behind buying 10-year or 30-year bonds with 1.22% and 1.89% nominal yields respectively? Well, it is quite simple, and it is a matter of time horizons for investors.
The Bull Case For Bonds
Treasury bond bulls are making a structural bet: that excess liquidity cannot fix a solvency problem, and when all else fails, who better to owe you money than the institution with an ability to tax their citizenry and increasingly print the underlying currency (through bond buying that is technically done through a third-party broker-dealer).
Bond bulls will be right on a certain time scale. The flaws that currently exist in the global financial and economic system are the same ones that brought about 2008’s Great Recession as well as the ones that enabled the March 2020 cross-asset sell-off.
In a fractionally-reserved fiat system, every dollar that is created through credit expansion must be repaid, plus interest. Thus, counterintuitive to some people’s thinking, credit expansion can feel inflationary over the short term due to the impact on asset prices, but long-term debt in itself is deflationary, as some of the borrower's future productivity is pulled forward to the present.
Dollar/bond bulls are placing a bet that the future demand for dollars that comes from the $84.6 trillion in dollar-denominated debt domestically, plus a relatively unknown but very substantial amount of dollar debt in the eurodollar market (U.S. dollar-denominated deposits at foreign banks outside the regulation of the Federal Reserve) will place a bid on the dollar, and they are right.

This is the dynamic that gives us the business cycle, or short-term debt cycle that so many are intuitively familiar with.
Credit growth creates an economic boom, asset values increase, incomes rise, etc… but eventually the piper has to be paid; and this is where the differences begin to emerge between those who are bullish bonds and those who are bullish say… bitcoin.
Paying The Piper
“In the end, policy makers always print. That is because austerity causes more pain than benefit, big restructurings wipe out too much wealth too fast, and transfers of wealth from haves to have-nots don’t happen in sufficient size without revolutions.” - Ray Dalio, Principles For Navigating Big Debt Crises
The thesis for bitcoin (or any hard asset for that matter) is that when any currency squeeze begins (due to the deflationary aspects of debt covered above), central banks and governments will step in to provide excess liquidity as this is exactly what they have conditioned markets to believe over the last four decades.
As Dalio (again) articulated in his recent post titled Why In The World You Own Dollar Debt:
“History and logic show that central banks, when faced with the supply/demand imbalance situation that would lead interest rates to rise to more than is desirable in light of economic circumstances, will print the money to buy bonds and create “yield curve controls” to put a cap on bond yields and will devalue cash.”
So the entire global economic system is over indebted to the point where it is almost entirely impossible to pay back, and further monetary easing via interest rate reduction is no longer possible at the zero lower bound? Right.

But treasury bond and USD bulls alike beware, a dollar spike can and certainly will happen again. But in a game of numerators and denominators, if the dollar is increasing against a basket of foreign currencies due to deflationary debt dynamics, but that is being counteracted by the Federal Government and Federal Reserve via new debt issuance and bond monetization, are you really winning, or are you very elaborately running in place, stuck on the treadmill of monetary debasement?
How The Game Is Played
It is important to remember that there isn't an isolated economic sector that is over indebted in particular, or just one asset class in “bubble territory.” It is completely systematic.
Has the S&P 500 really doubled in value in just the last four and a half years, or has an excessive debt binge and a negative cost of capital sent share prices to the stratosphere as investors bathe in the illusion of free money in perpetuity?
A look at the S&P 500 and stock market margin debt outstanding tells a fascinating story.
What to do if you cannot receive a satisfactory yield from bonds? Leverage up and purchase equities of course! While this is said in satirical manner, this has been a go-to strategy among market participants over the last two decades (with great success).


Not only are investors leveraging up to purchase the underlying equities (increasingly so through broad market indices), but public companies themselves have been leveraging up on a massive scale over the 2000s.
Yet, despite record-high debt/free cash flow levels across the corporate sector, yields on junk debt have never been lower.


But for what purpose are these companies taking on debt?
Among the most prevalent: share buybacks. Why spend time and energy attempting to produce real goods and services when you can instead simply lever up your balance sheet and turn your equity into a quasi store of value due to the deflationary effect of buybacks for shareholders?
When the cost of capital is negative, businesses that would fail from the effects of creative destruction are enabled to survive. These companies are parasites feeding off of the easy money central bank liquidity spigot.
That’s the ugly truth in regards to our equity markets today.

Just to hammer the point home one last time, here are the forward and trading P/E ratios for S&P 500, along with the S&P 500 earnings yield (inverse of P/E ratio) and the U.S. 10-year Treasury yield:
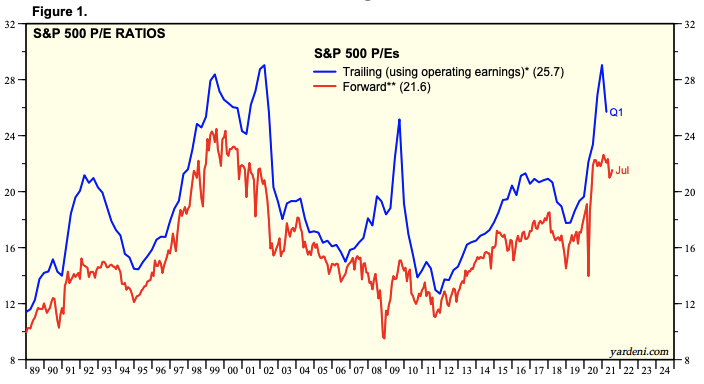

What is the fair value of an equity when the cost of capital is zero (or negative)? Equities very well continue to melt up over the course of the 2020s in nominal terms with quantitative easing and yield curve control continuing to be aggressively used by global central banks.

Long Everything Bubble = Implicitly Short Volatility
While it may or may not be becoming increasingly obvious that we are in some form of “everything bubble” across asset classes, the question that should be on the mind of every investor is:
Where can I hide?
Below is the S&P 500 VIX (CBOE Volatility Index) and high yield corporate bond spreads (difference in yields between junk bonds and Treasury bonds), and as is obvious, the two are nearly perfectly correlated to one another.

The reasons for this dynamic are multifaceted, and could be covered in much greater depth than will be in this report, but to keep it short: Going long both credit and equities is implicitly going short volatility.
The short volatility positioning across the financial system is indirectly a result of decades of the Fed Put incentivizing yield-generating strategies and financial engineering that are dependent on easy monetary policy into the future to redeem (cross-currency carry trades, debt-financed stock buybacks, short VIX futures, leveraged loans, Risk Parity trade, etc.).
Thus, if you are long equities, credit, real estate, or any other traditional asset class, you are short volatility, and rightfully so, as that has been the incentive structure over the last four decades. If you weren’t long assets for a majority of the greatest secular asset boom of all time, you’re currently looking up at those who were.
But in this new paradigm of seemingly return-free risk across the bond market with an equity market trading at 260% to nominal GDP, where can one hide? How do you long volatility to protect yourself from the increasingly violent unwinds that come with the late stages of an over-indebted monetary regime?
With volatility as an asset class, you have to factor in the theta (time decay) of long volatility positions, and as it turns out, it can be quite expensive to always hold insurance.
Think of long volatility as house insurance: you don’t need the insurance… until your house burns down. That's why you pay insurance premiums every month. Take a put option for example: with a put option, you contractually lock in the right to sell a security at a certain price, which offers you the buyer downside protection in the event of a sell-off.
But what happens to the value of your put option for X date into the future as time creeps on, and no market downturn comes? Your option slowly bleeds in value, until it either cashes good money, or expires worthless.
Below is a chart of VXX, a fund that offers short term VIX futures exposure to investors on a rolling basis.
VXX is down 99.72% since 2012, because of the perpetual — or rather, eventual — decay associated with long volatility strategies.
Long Volatility, With Zero Theta
“It is important to remember that bitcoin at this stage in its adoption phase is not a hedge against PCE/CPI (consumer price) inflation, but rather the dual threat faced by every capital allocator on the planet; perpetual credit expansion (dilution risk) that inevitably ends with a credit contraction leading to a deflationary bust (counter-party and political risk).” - The Deep Dive, May 2021 Monthly Report
This is an extremely important point for investors to understand about bitcoin. Many will look at correlations over extremely short-term time frames and point to bitcoin’s direct correlation with other “risk assets” as anecdotal evidence that bitcoin is or isn’t an inflation or deflation hedge, depending on the day and the price action.
The reality is that bitcoin is not a risk asset, nor is it a speculative vehicle. Bitcoin is objectively the most certain asset on the planet.
Find me a law, or “contractual obligation” more certain than 21,000,000 bitcoin, and I’ll show you a mirage.
Find me an asset that has a guaranteed and auditable fully-diluted supply hard cap, and you’ll show me bitcoin.
That’s it.
Similar to its monetary predecessors, bitcoin will preserve value regardless of monetary inflation (credit expansion) or deflation (credit contraction), due to direct production cost associated with the SHA-256 hashing algorithm coupled with the difficulty adjustment.
An investor with a long enough time horizon can think of bitcoin dually as a call option on human ingenuity and technological innovation, as well as a put option on the probability of central planning and banking outcompeting a free market phenomena.
Both the proverbial call and put in this scenario have no time decay, all you have to do is acquire bitcoin, and hold. In an unknown and uncertain future, bitcoin is objectively the most certain asset you can own.
Deflationary Bust Scenario
A classic bank run, you’ve probably heard the story.
A century or so back in the U.S, thousands of bank runs shuttered the U.S. economy as gold deposits in bank vaults became irredeemable due to the fractional manner in which they had been lent out. A deflationary bust followed, in which assets fell in value, reducing credit worthiness and tightening liquidity, in a violent self-reinforcing spiral.
But, this scenario isn’t a worry with bitcoin. With gold (humanity’s monetary asset of choice for millenia), the physical nature of the metal relegated its use in trades, especially in economies of scale, and thus the need for bank notes arose.
Bank notes, interestingly enough, were a technological solution to the shortcomings of gold. But with bitcoin, no such notes are needed. Instead, there exists a fully decentralized and autonomous network which stores the wealth of all participants, halting would-be thieves with encryption and cheaters under a blanket of thermodynamic security.
With bitcoin, you not only have the assurance of 21,000,000 forever, but you also have the ability to securely store your wealth without the counterparty risk that has haunted those who grew to trust banking institutions throughout modern history.
With bitcoin, you hold an insurance contract on the entire game, that you only have to pay for once, and which never expires.
We happen to think that alone is worth immense, near immeasurable amounts of value.
Regulatory Risk
This past week, as Congress was in the final stages of a bi-partisian “infrastructure bill,” it was uncovered that unfavorable regulations for the bitcoin and cryptocurrency industry broadly were added at the last minute, to the knowledge of almost no one in the industry.
Caught off guard by the sudden news, the proposal in particular targeted “any person who (for consideration) regularly provides any service or application (even if noncustodial) to facilitate transfers of digital assets…”
The wording in the bill was purposefully vague, and while the wording in the final bill did get tweaked slightly, the bill is still very unfavorable for the industry and leaves large potential gray areas for regulators to attack.
Here is the most important thing to know,
"Nothing is more powerful than an idea whose time has come." - Victor Hugo
Final Word
Similar to how all attempted government bans or regulation of anything demanded by the citizenry went down, neither the U.S. government nor any other world power has the means or ability to stop the Bitcoin network from producing blocks.
You can attempt to halt innovation. You can attempt to halt the transfer of borderless information. You can attempt to will away the game-theoretic incentives provided by a sound monetary asset and network with the political decree of a pen stroke.
But understand, any person, entity, or institution who tries, will eventually fail. Freedom rings, and more people around the planet are coming to realize that bitcoin is the best medium to store value that humanity has ever encountered. It’s that simple.
Bitcoin is objectively the best money humanity has ever had at our disposal, and as a result, will appreciate by orders of magnitude over the coming decade.
Just keep stacking.


