2022 Year In Review
A year-end retrospective from Bitcoin Magazine PRO with a view of on-chain data, hash rate and mining metrics, public mining equities and the larger macroeconomic landscape.
Related Past Articles:
Year In Review
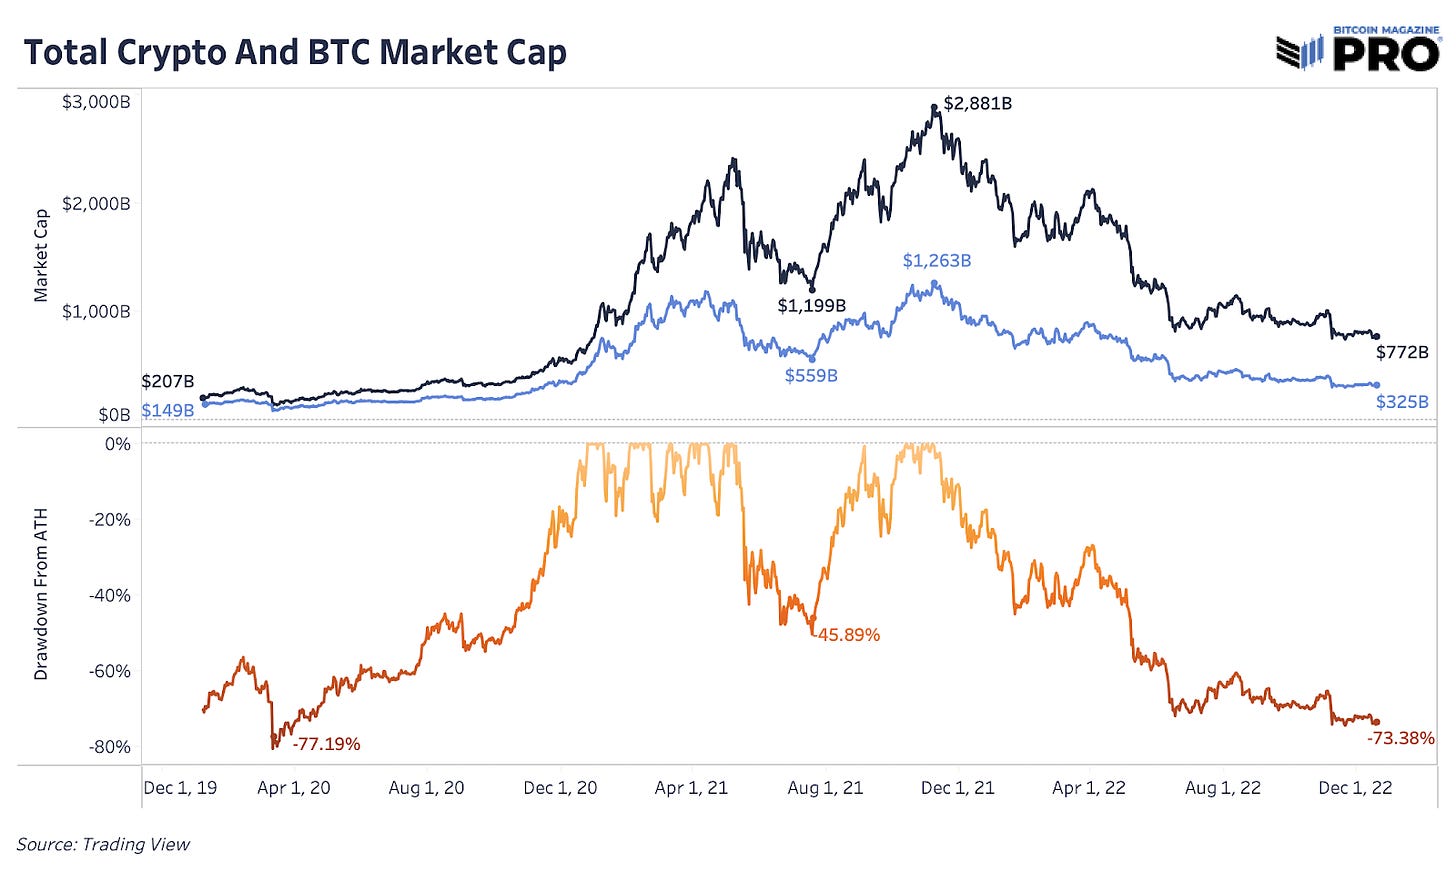
Compared to past cycles, 2022 looks just like any of the previous downtrend years with the bitcoin price down over 70% from the recent all-time high. Yet, 2022 is not like any other bitcoin cycle. Bitcoin now faces the headwinds of a global macroeconomic recession, a once-in-a-century performance for sovereign debt, rising persistent inflation around the globe and the popping of the global everything bubble that has affected nearly every asset, especially those further out on the risk curve. Somehow though, Bitcoin is once again “not dead.” Let’s zoom out and take a deeper look at the 2022 data relative to past years and see why the Bitcoin network is stronger than ever.
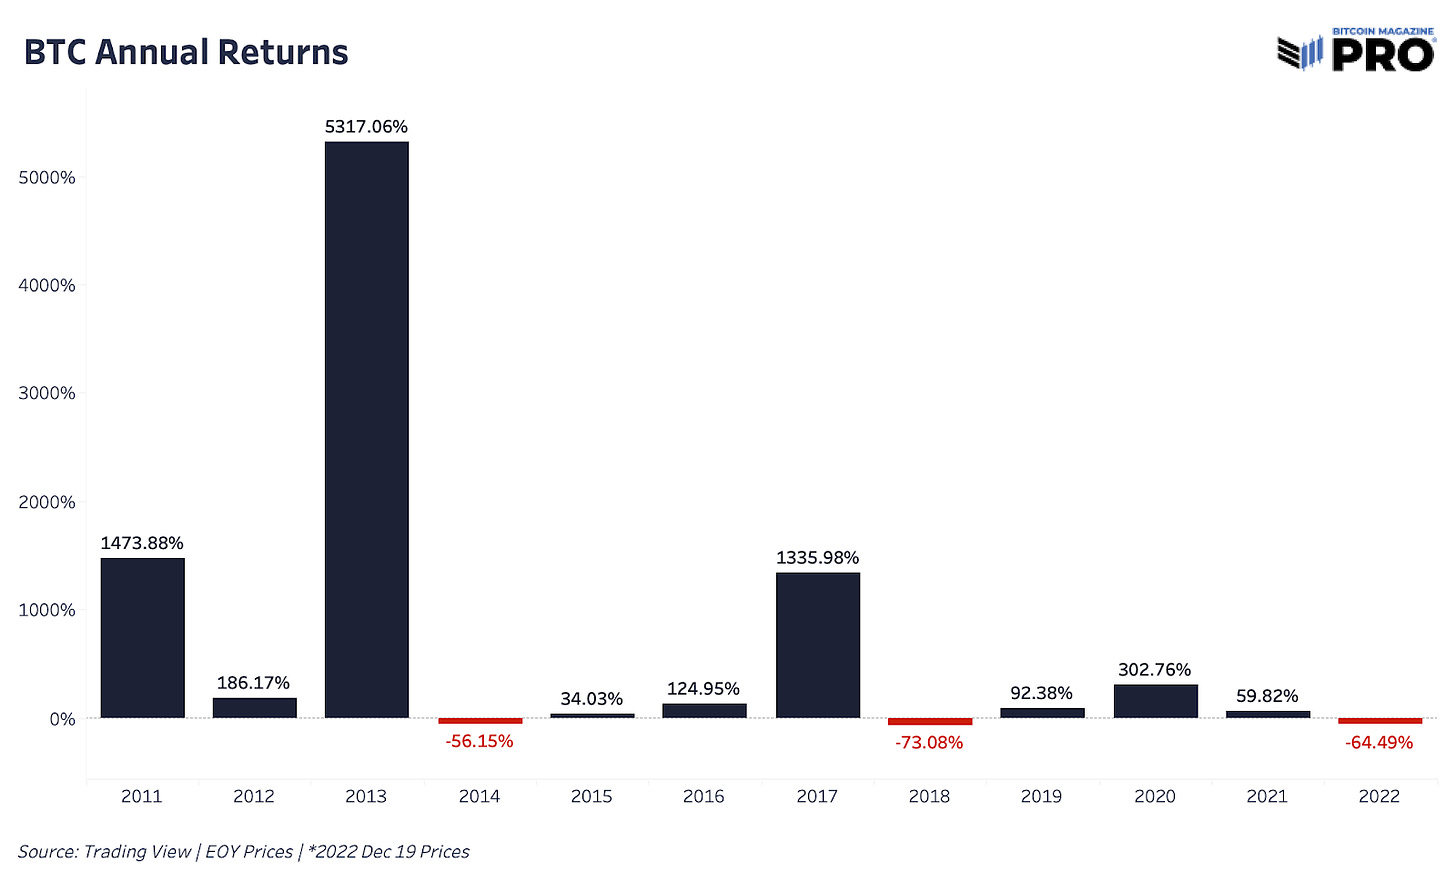
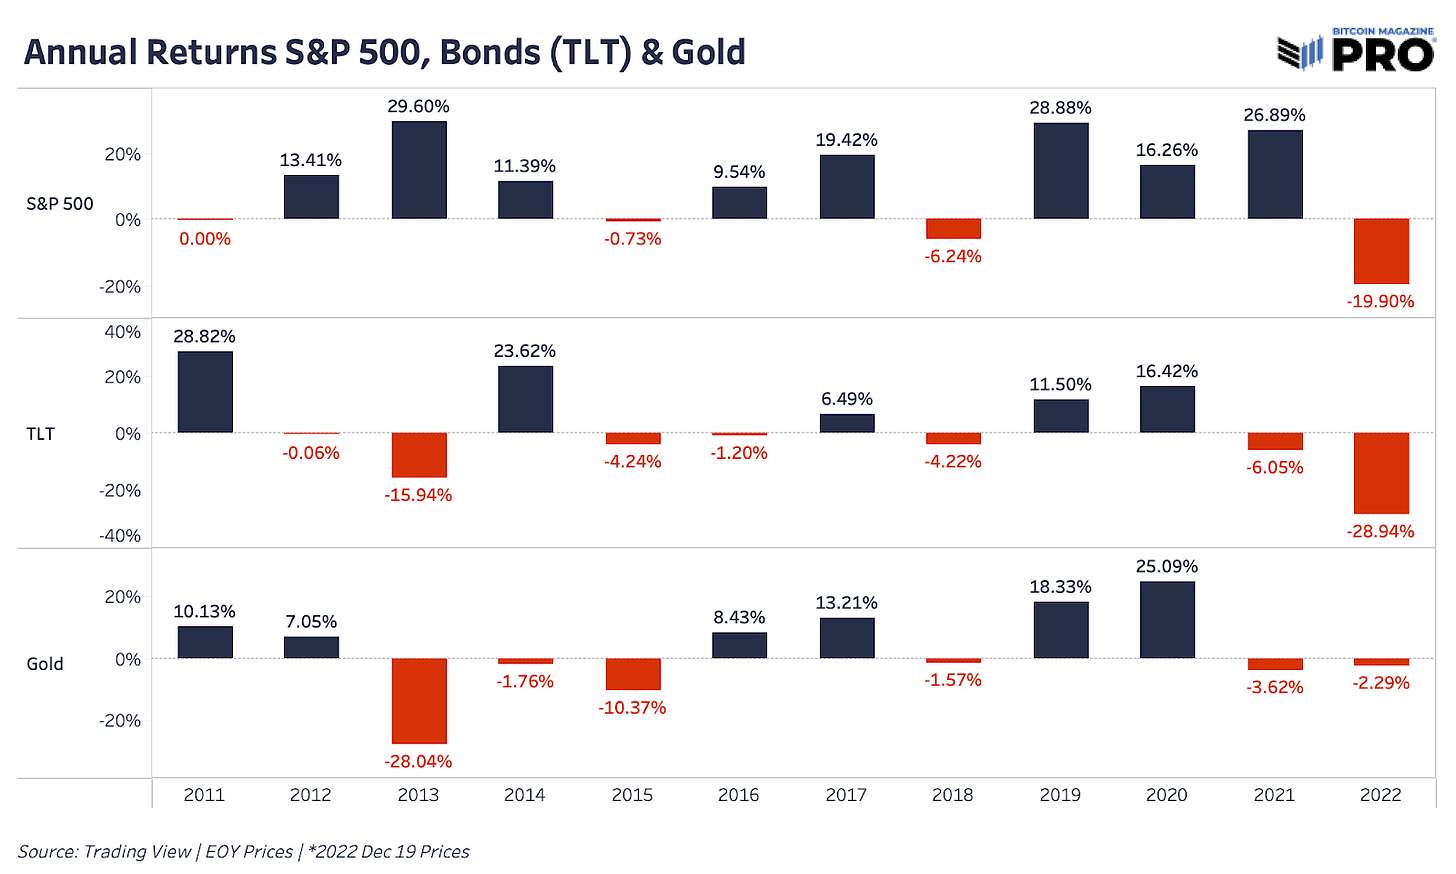
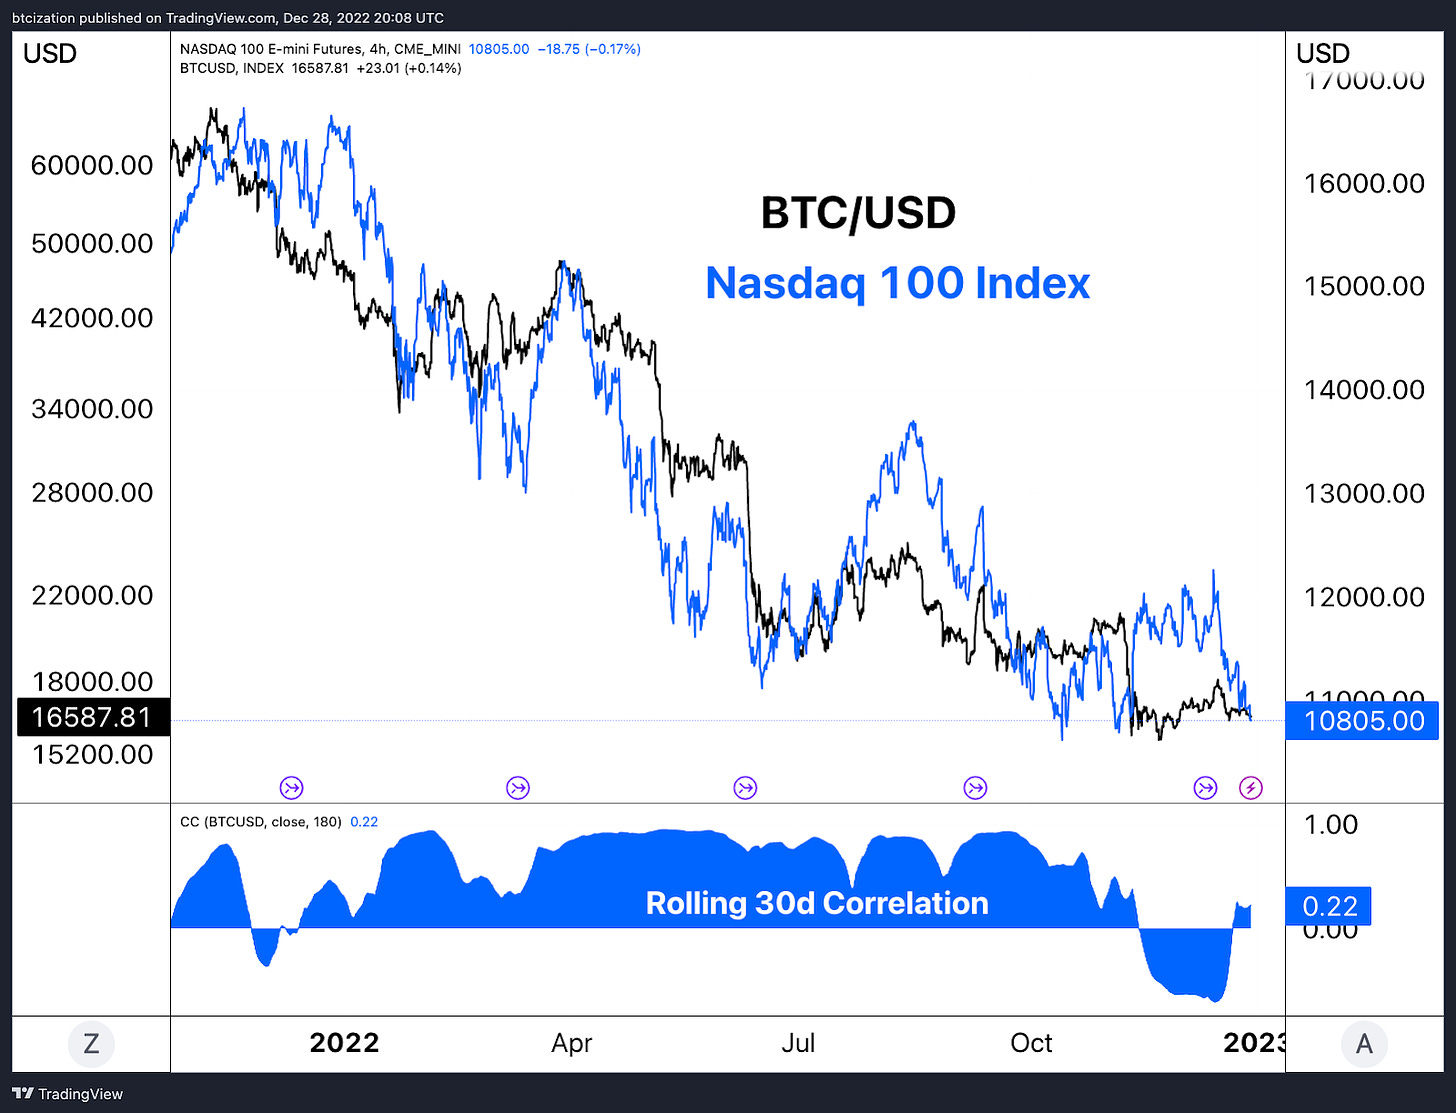
In terms of annual returns, bitcoin is down 64.49% this year while the S&P 500, bonds and gold are down 19.90%, 28.94% and 2.29%, respectively. Bitcoin has historically followed economic cycles and the relationships across financial markets with 2018 being an example. As each year passes and bitcoin’s profile as an asset class grows, bitcoin becomes more closely intertwined with the global liquidity dynamics that affect all markets.
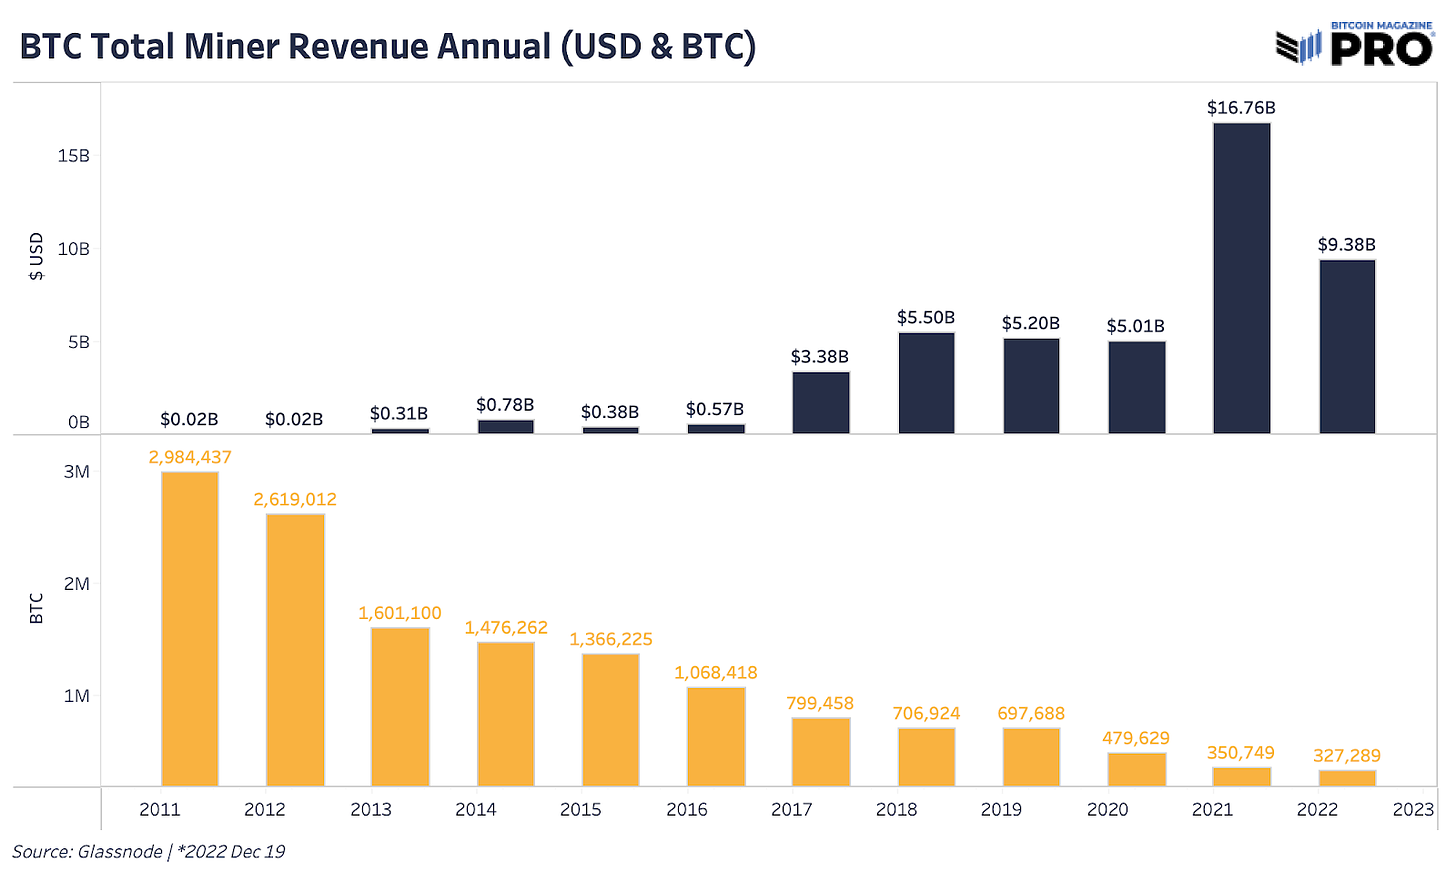
Miner revenue took a beating this year after a euphoric rise in 2021. Public miner stock valuations followed the same path with valuations falling even more than the bitcoin price, all while the Bitcoin network’s hash rate continued to rise. This dynamic of price collapsing with hash rate increasing has pummeled Bitcoin miners’ hash price, total miner revenue per terahash and squeezed miner profit margins after a golden era of mining in 2021. Public miner valuations collapsed across the board with most losing 90% or more in equity valuations this year. Miner revenue in USD terms was down 44% in 2022 after rising 234% in 2021. In BTC terms, revenue was down 6.7% as of December 19.
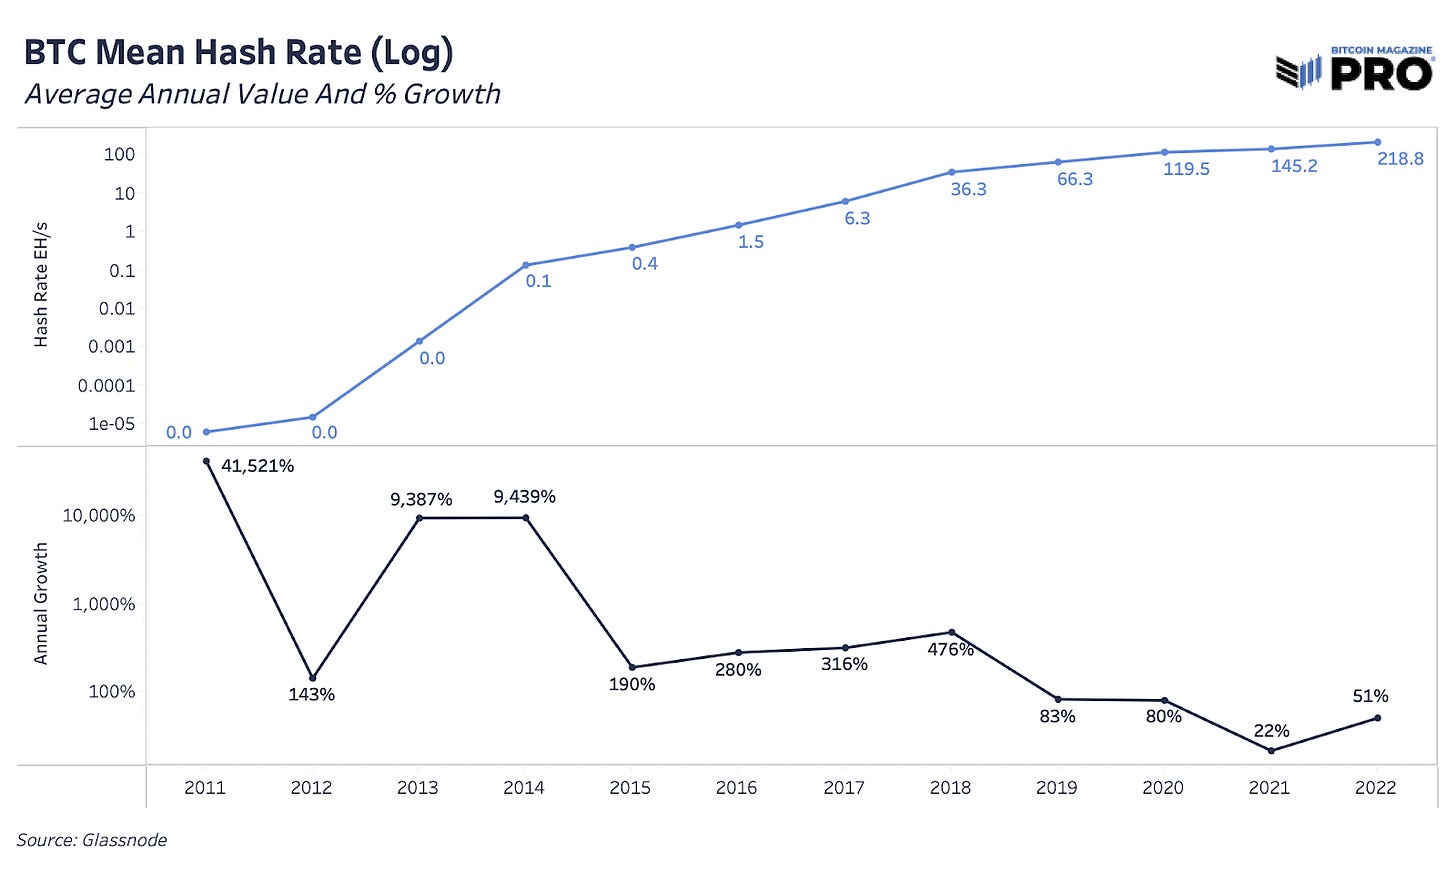
The pressure on the mining industry likely isn’t letting up anytime soon as the competition only heats up for the continued decline in annual bitcoin issuance. We’re likely to see more mining fallout in 2023 for many reasons, but the bigger story is the continued rise in network hash rate over time. Network hash rate has still yet to see a negative year of growth. Even just using the average annual hash rate value for each year — as hash rate can fluctuate on any given day — network hash rate is still up 51% this year despite a recent decline from all-time highs.
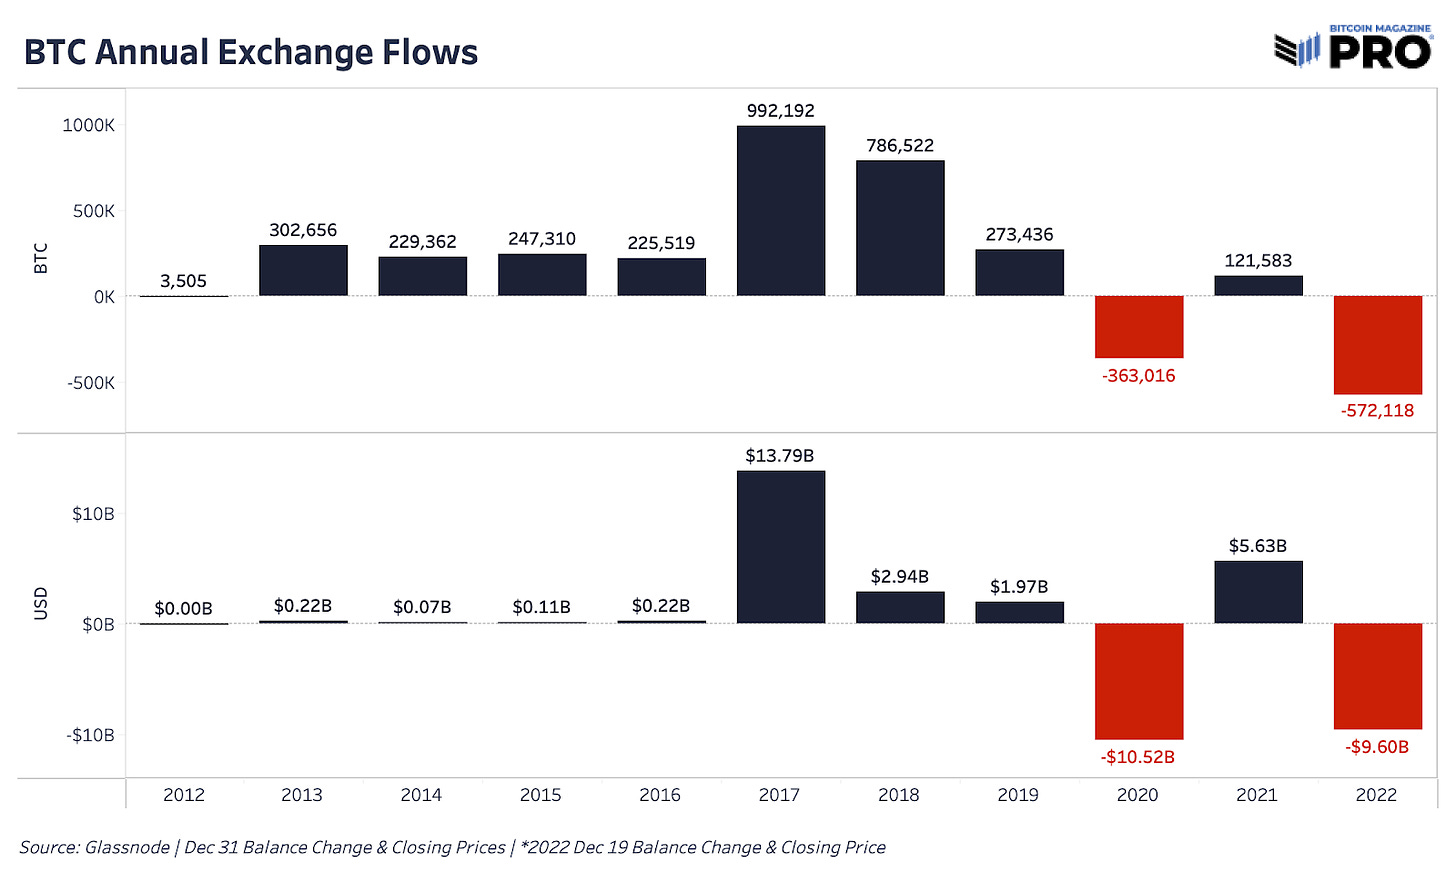
2022 was the year of getting bitcoin off exchanges. Every recent major panic became a catalyst for more individuals and institutions to move coins into their own custody, find custody solutions outside of exchanges or sell off their bitcoin entirely. When centralized institutions and counterparty risks are flashing red, people rush for the exit. We can see some of this behavior through bitcoin outflows from exchanges.
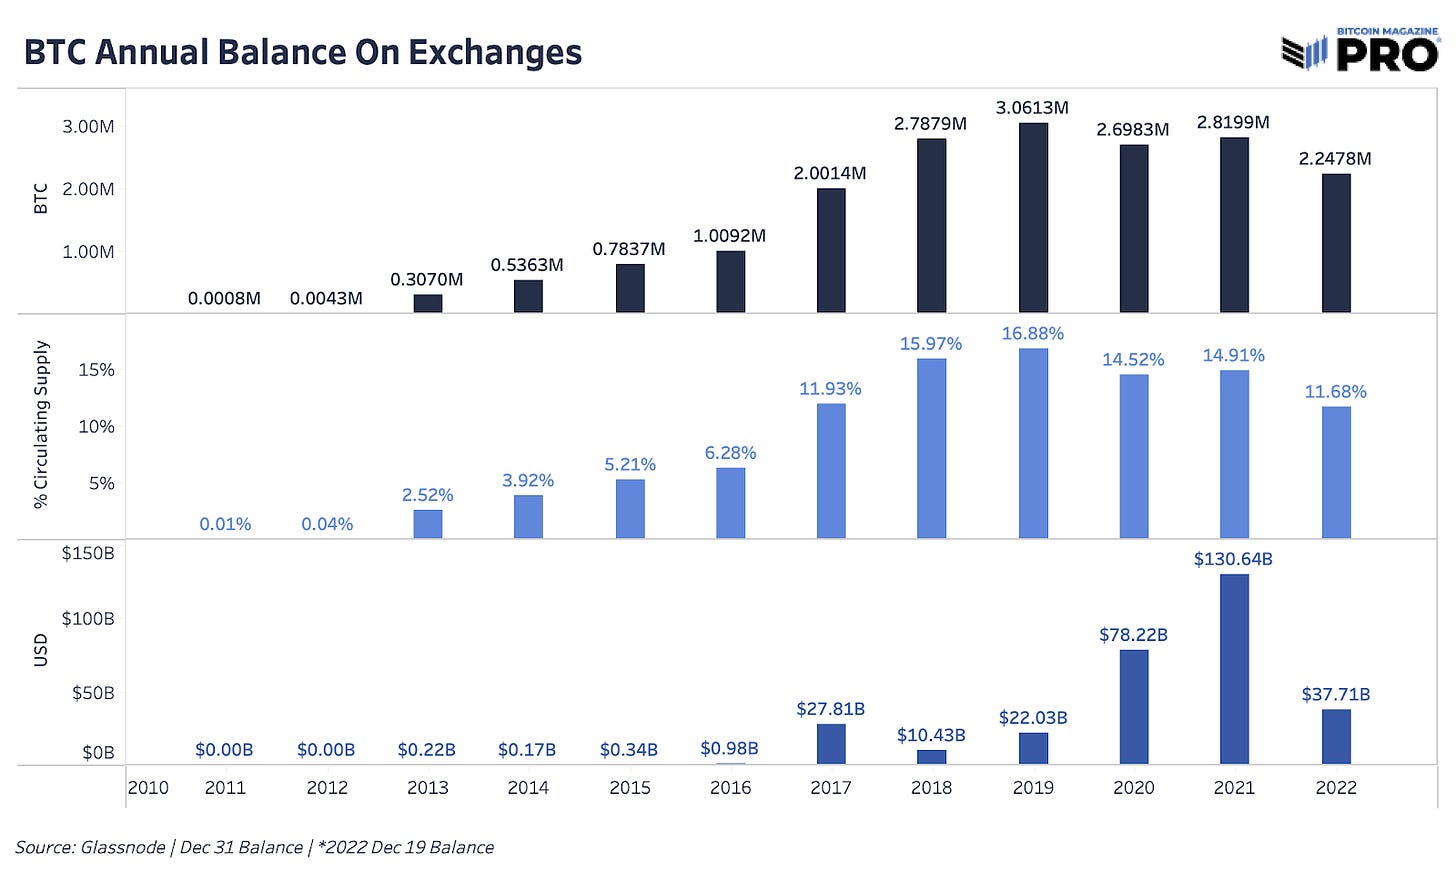
In 2022, 572,118 bitcoin worth $9.6 billion left exchanges, marking it the largest annual outflow of bitcoin in BTC terms in history. In USD terms, it was only second to 2020, which was driven by the March 2020 COVID crash. The Terra/LUNA and FTX (FTT token) crashes were the sparks to drive the outflow trend this year as bank runs and rushes for liquidity ensued. After years of a rising share of circulating supply finding its way onto exchanges, we’re now seeing that trend reversing. 11.68% of bitcoin supply is now estimated to be on exchanges, down from 16.88% back in 2019.
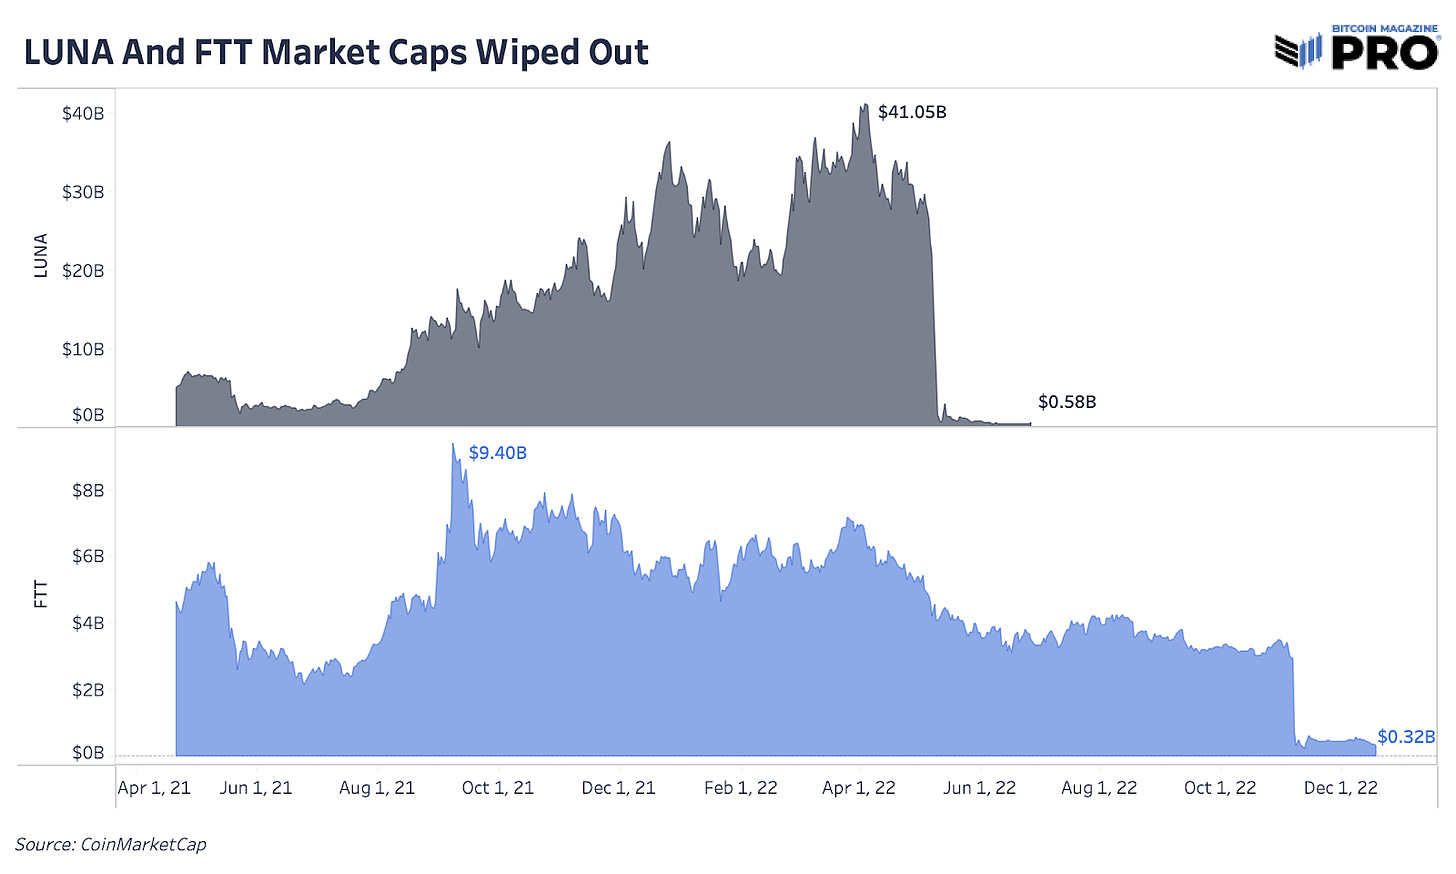
As mentioned above, the two implosions of the year were Terra/LUNA and FTX (FTT token). Between the values of just these two inflated tokens alone, over $50 billion of “value” was wiped out in 2022. This had significant impacts on bitcoin’s price as waves of collateral damage played out in the broader industry. Even though none of these projects have any material impact on the Bitcoin protocol or its growing fundamentals, the unknown leverage in the market and paper bitcoin built on top of these tokens were certainly affected.
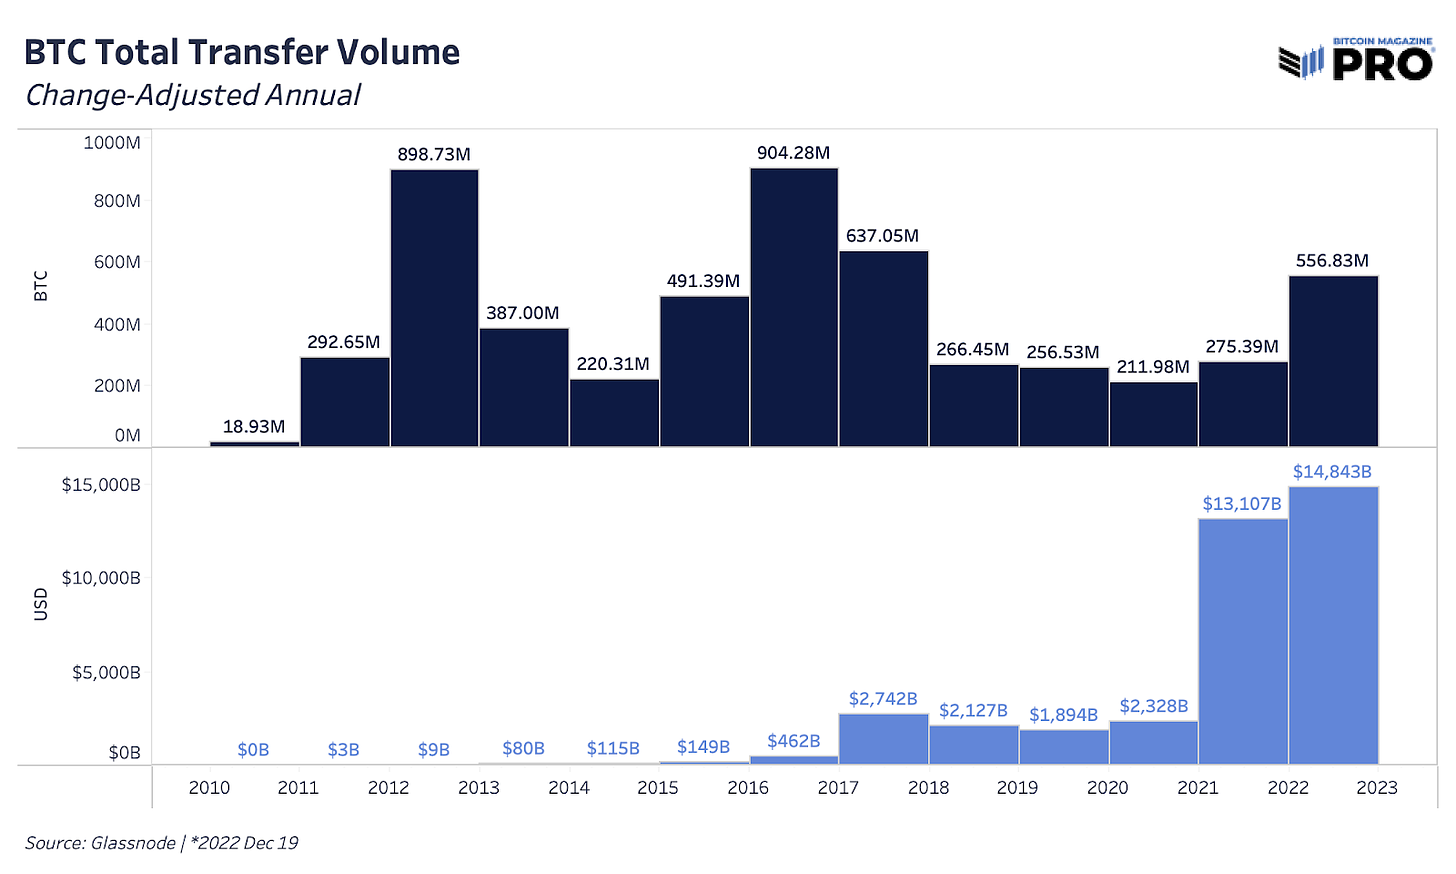
In the waves of forced capitulation and liquidations that came through this year, there was heightened demand for transferring bitcoin. With only a few days left of the year, there was over 556 million bitcoin in change-adjusted transfer volume (BTC denominated) that happened on-chain this year, up 102% from 2021. In USD terms, the Bitcoin network settled just shy of $15 trillion in value in 2022.
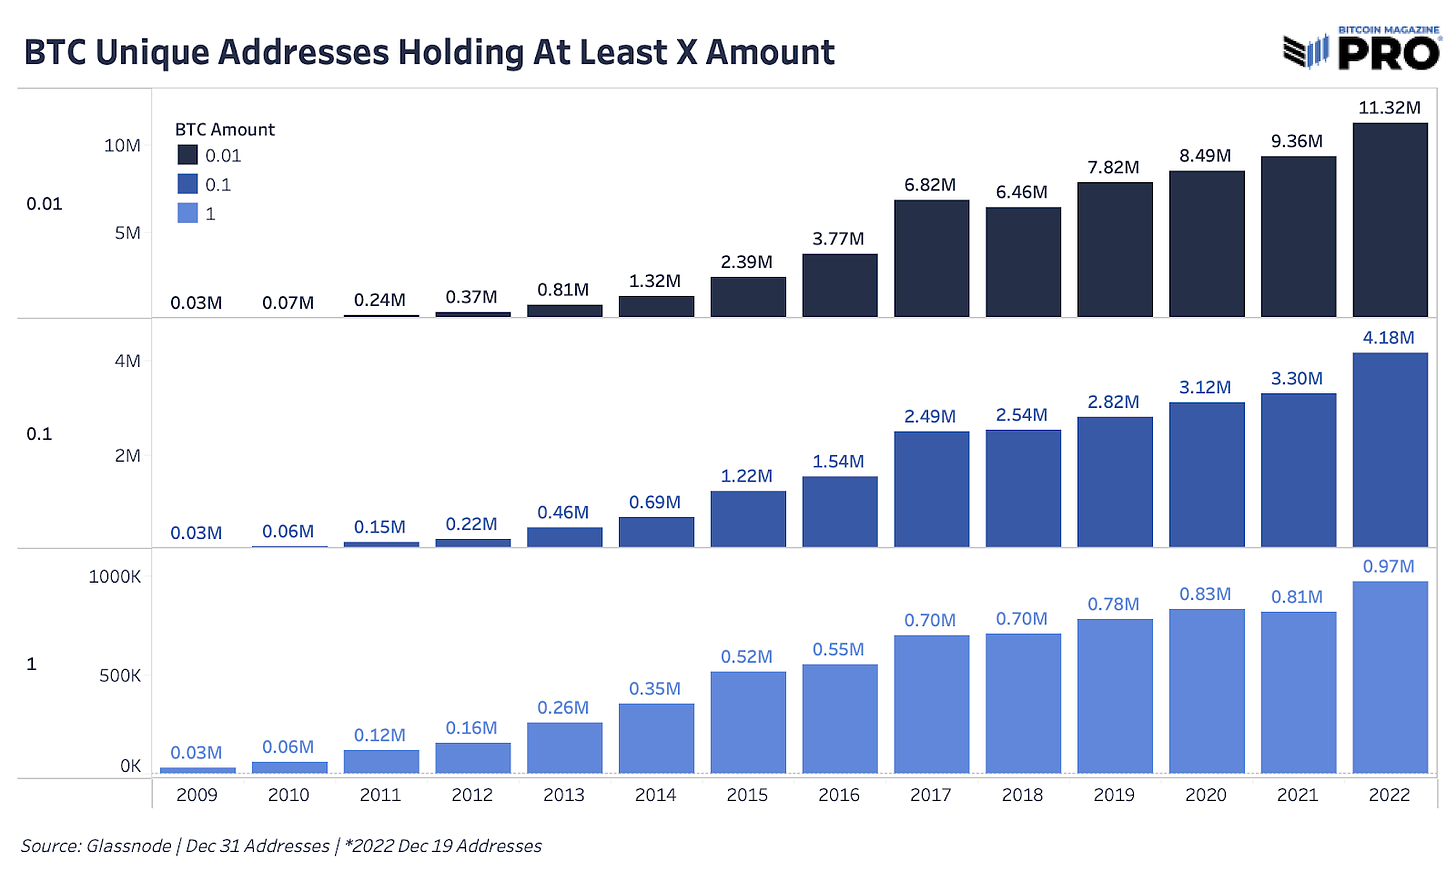
Despite bitcoin’s price drawdown this year, the number of unique addresses holding smaller amounts of bitcoin continue to grow in rapid fashion. Addresses don’t translate to the number of users, but can act as a rough proxy for overall growth. Unique addresses with bitcoin amounts can be growing as new users acquire bitcoin or as current bitcoin holders use many unique addresses to spread out their holdings — a common privacy practice. Estimating Bitcoin’s total number of users has always been a difficult task and requires leveraging on-chain data and adoption survey data to come up with an estimate.
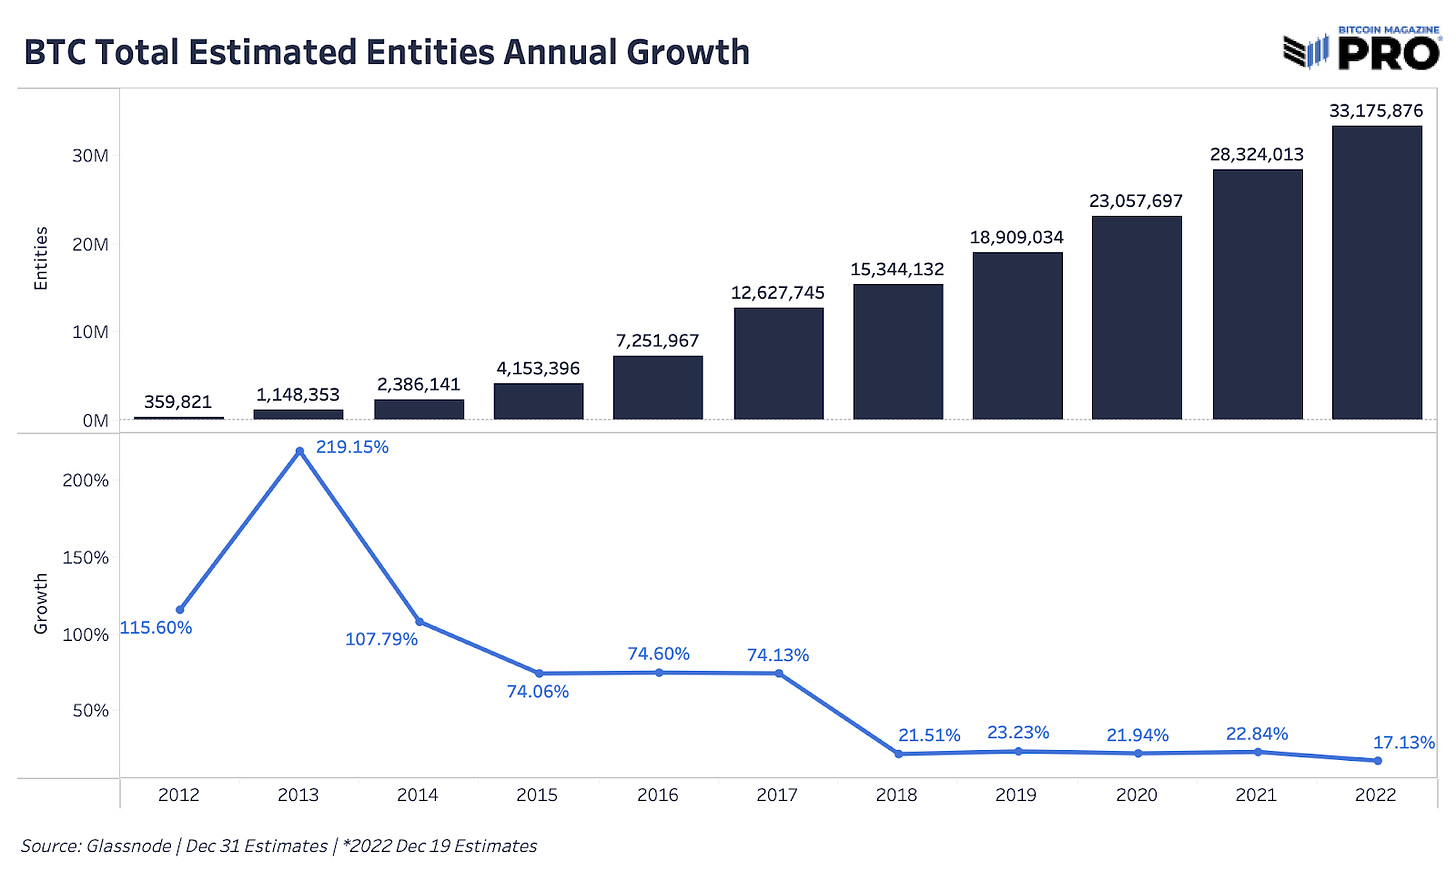
A more sophisticated view to estimate user growth is to use Glassnode’s estimated entities data which are modeled from proprietary data science techniques that cluster many addresses to a single entity, either an individual or institution.
It’s another imperfect measure, but one that shows us that bitcoin entities grew over 17% in 2022 after consistently growing more than 20% over the last four years. We roughly know that there are over 33 million separate entities with a non-zero bitcoin balance. The number of bitcoin users is likely much higher for many reasons. One of those is that an exchange would be classified as one entity that holds bitcoin on behalf of many users.
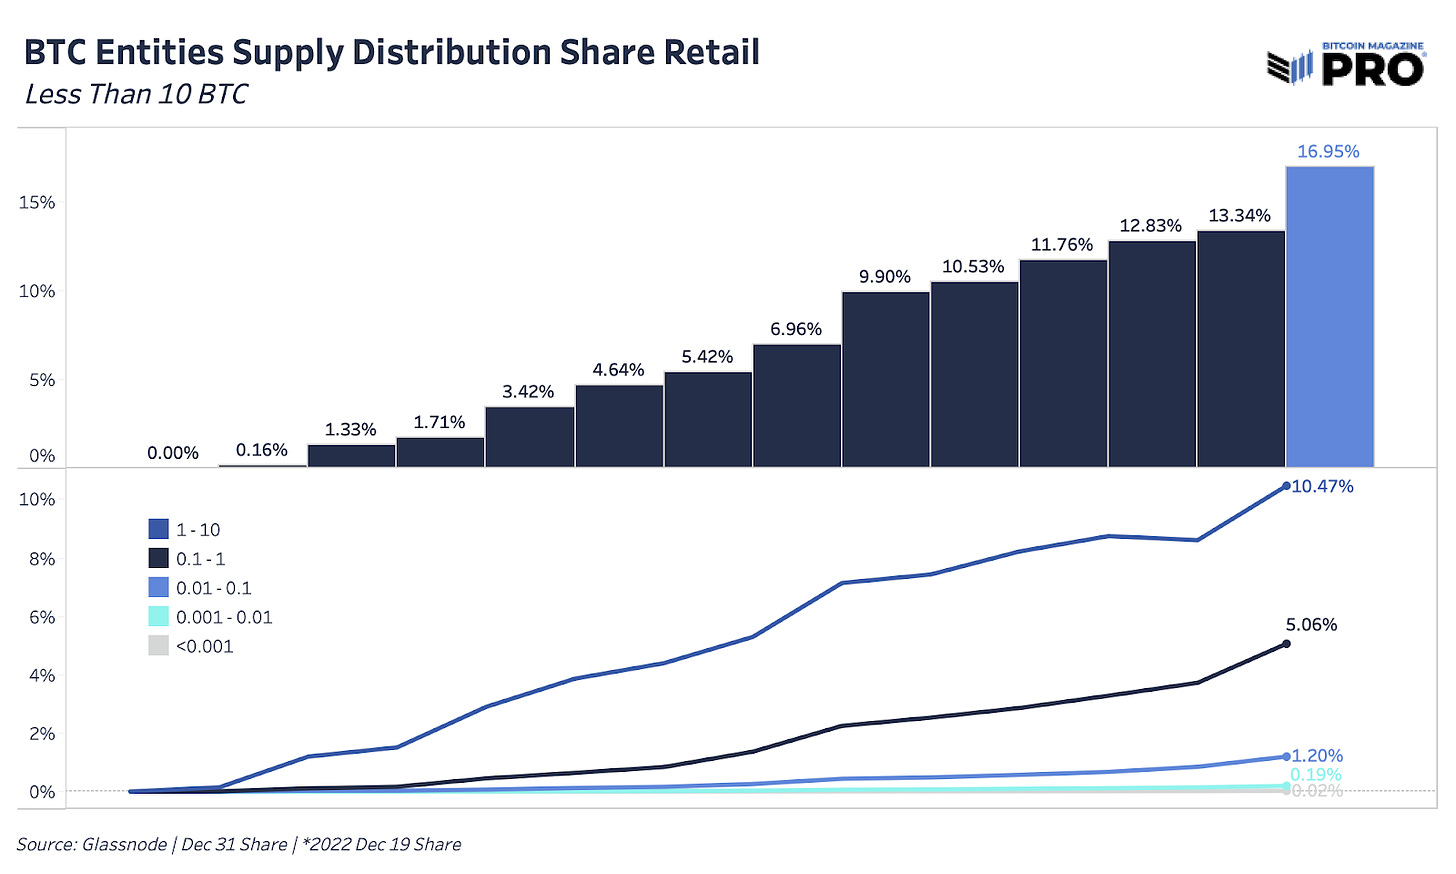
When we look at all of this combined data, there’s a clear trend of increasing Bitcoin users happening in 2022. The growing share of bitcoin supply that is finding its way to retail users is also clear. With the definition of retail users being those who are holding less than 10 bitcoin, the share of bitcoin supply held by this group is now just shy of 17%, despite being just shy of 10% five years ago.
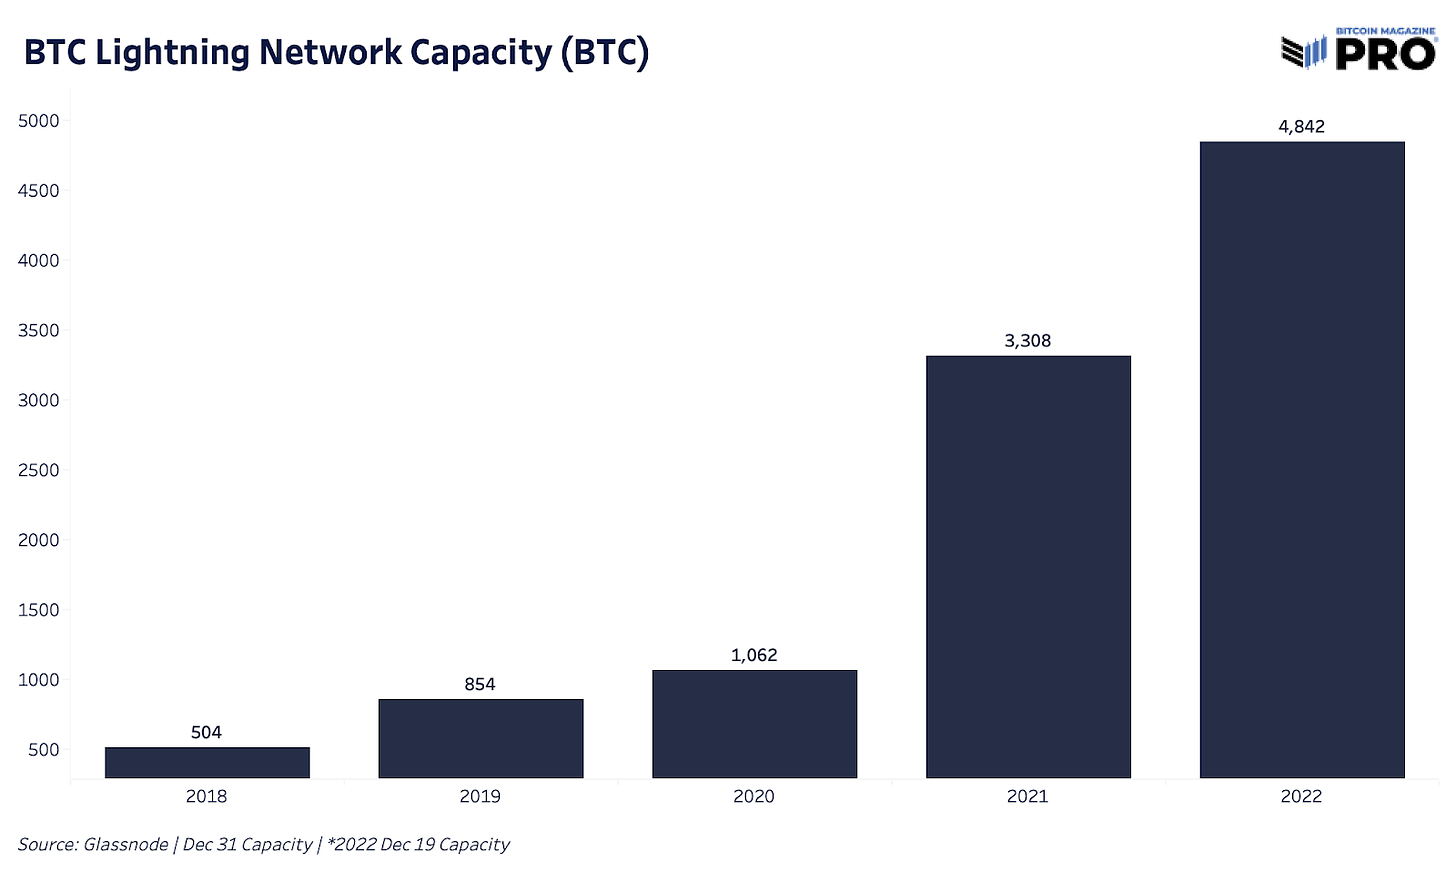
Although still relatively small in public bitcoin capacity size, Bitcoin’s dominant Layer 2 payments and scaling solution, the Lightning Network, continues to grow at a rapid clip. Public network capacity grew over 46% this year.
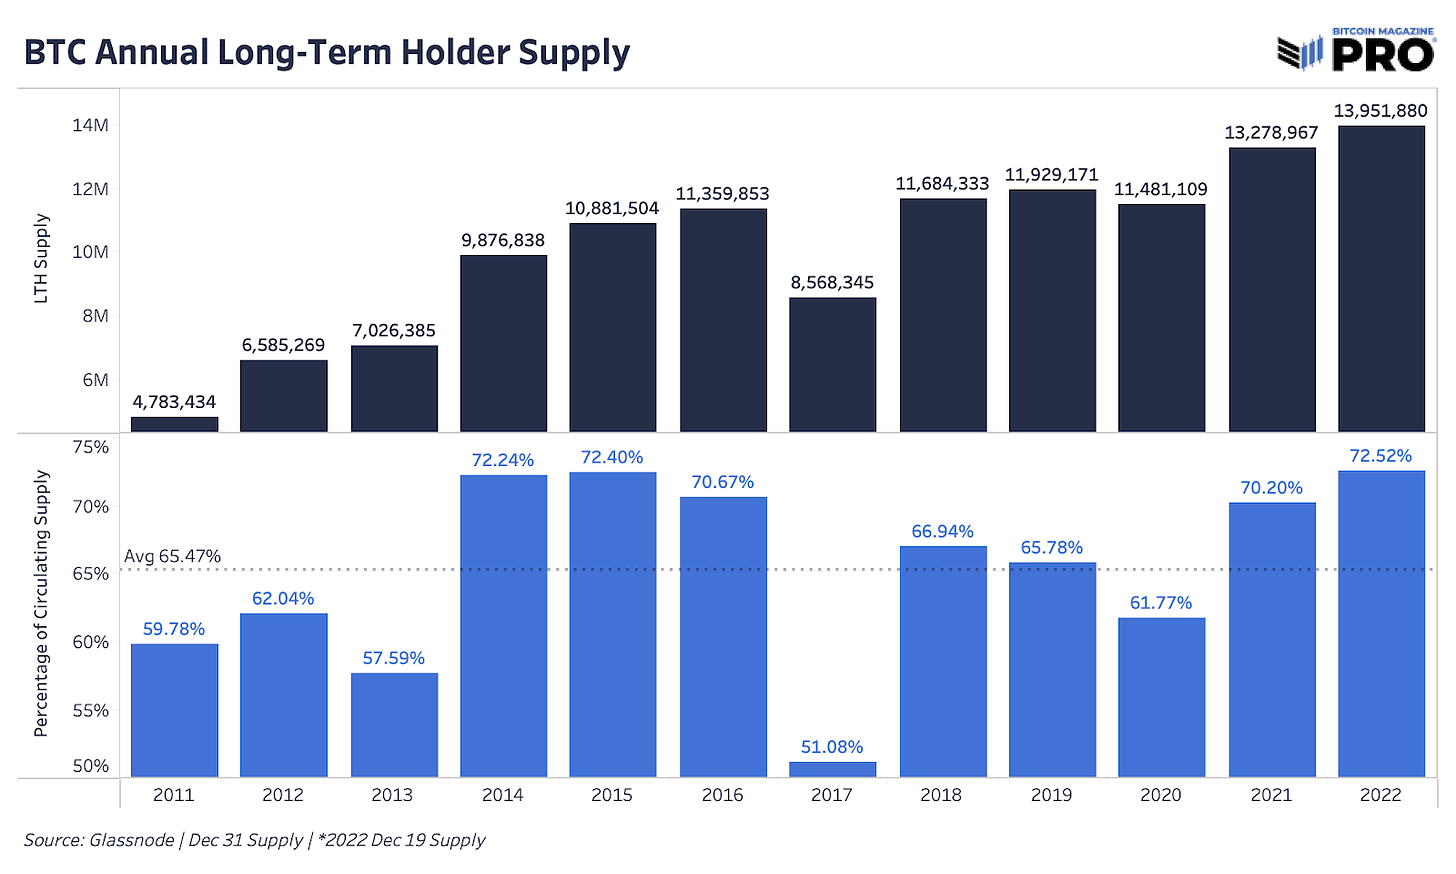
Many underestimate one of Bitcoin’s strongest attributes: the growing convicted cohorts of holders who rarely sell bitcoin and accumulate regardless of price drawdowns. Of course, there are still periods of capitulation and events that wash out the less convicted participants as market forces do, but the trend of circulating supply in the hands of longer term holders rose to new highs in 2022 to 72.52%. Glassnode’s definition of long-term holders used for this metric is greater than 155 days.
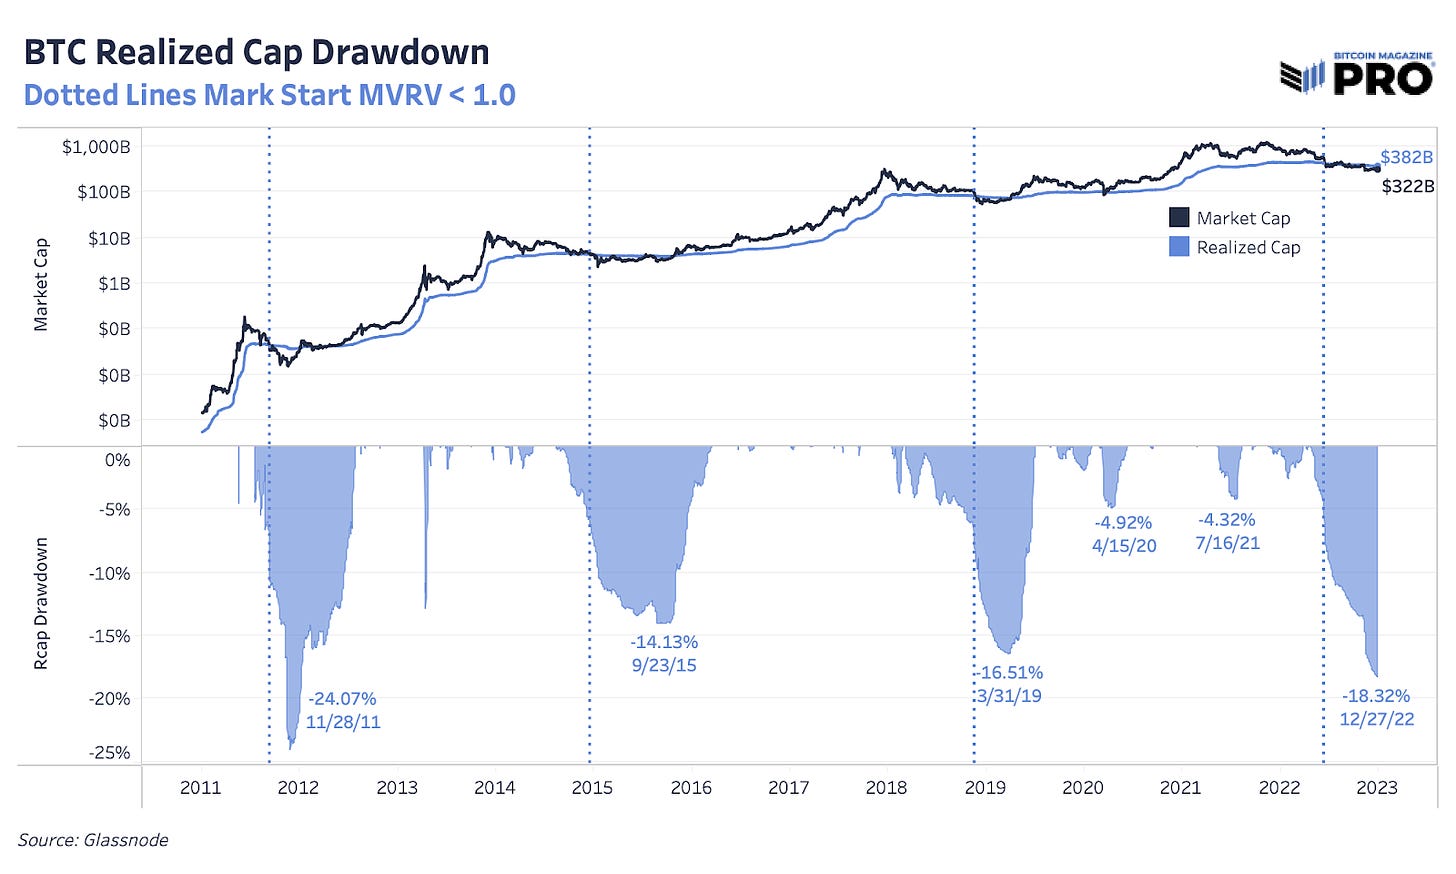
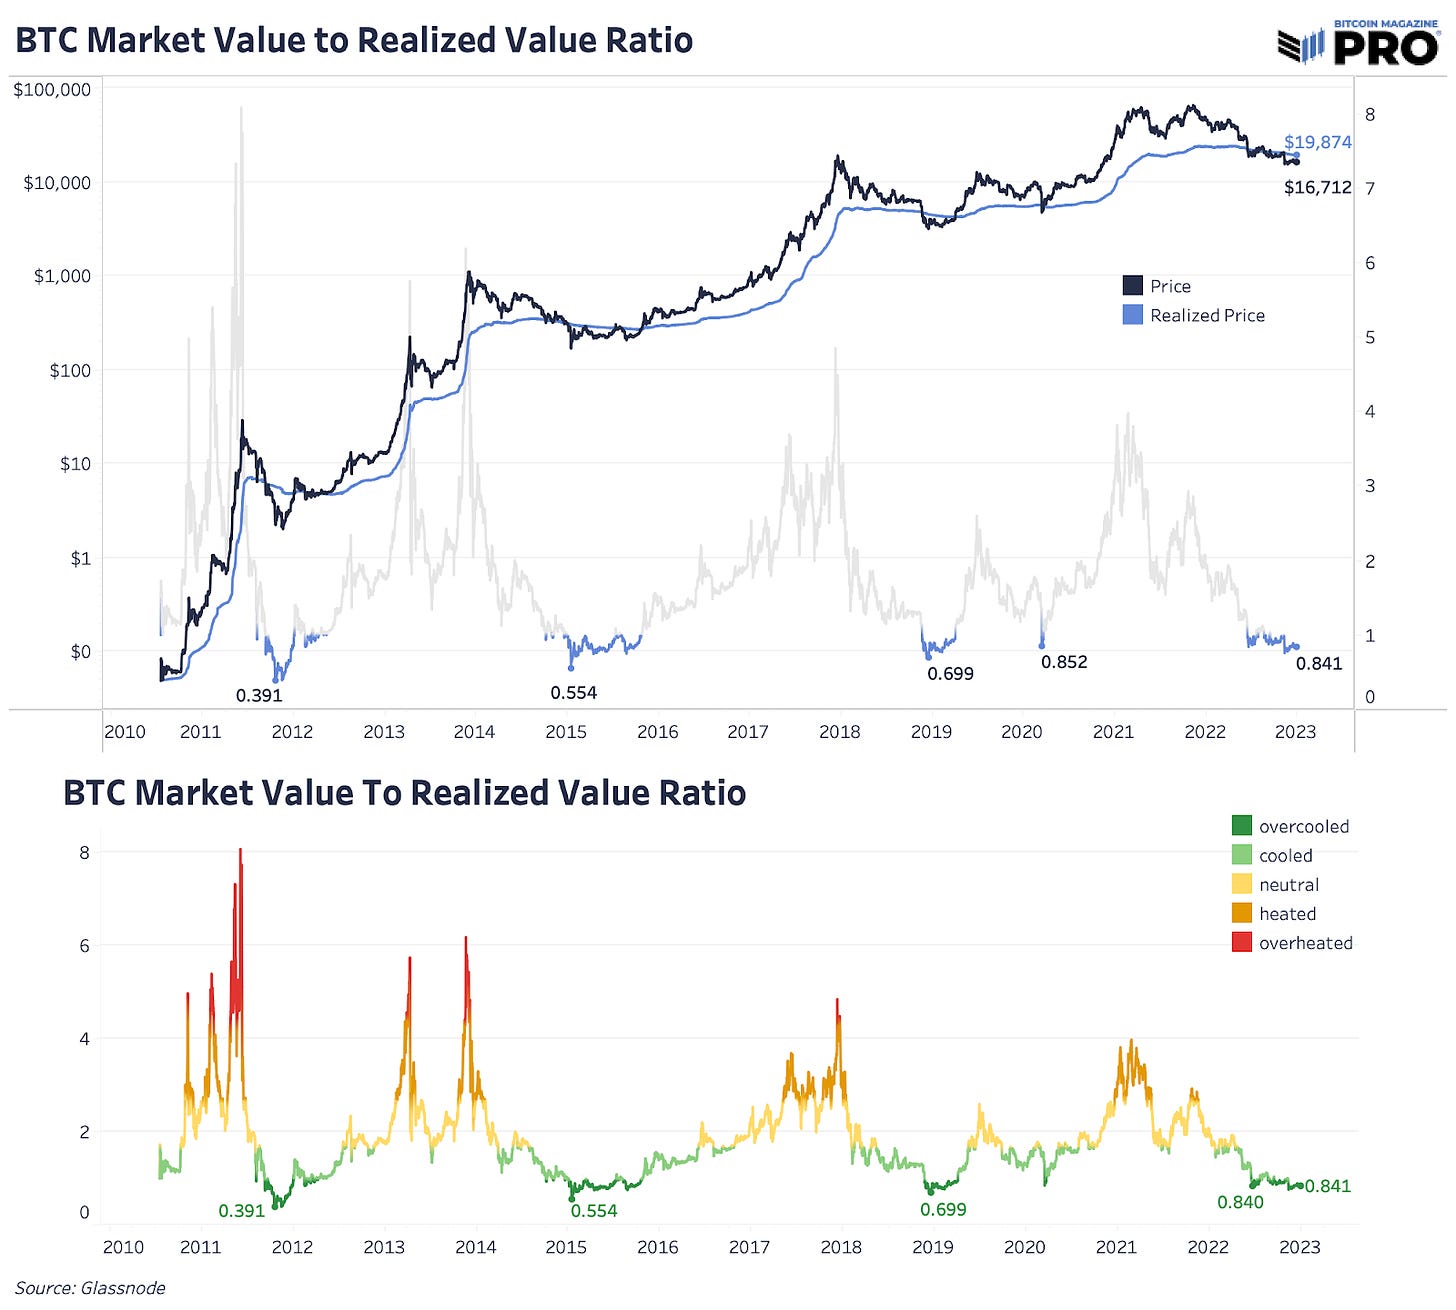
Another way we can evaluate the growth of bitcoin is through its realized price. The realized price accounts for all bitcoin at the price where they last moved on-chain, which can often serve as a superior measure of its growth rather than the instantaneous exchange rate.
The bitcoin realized market cap is down 18.8% from all-time highs. This is the greatest decline in realized market cap in the history of Bitcoin’s existence.
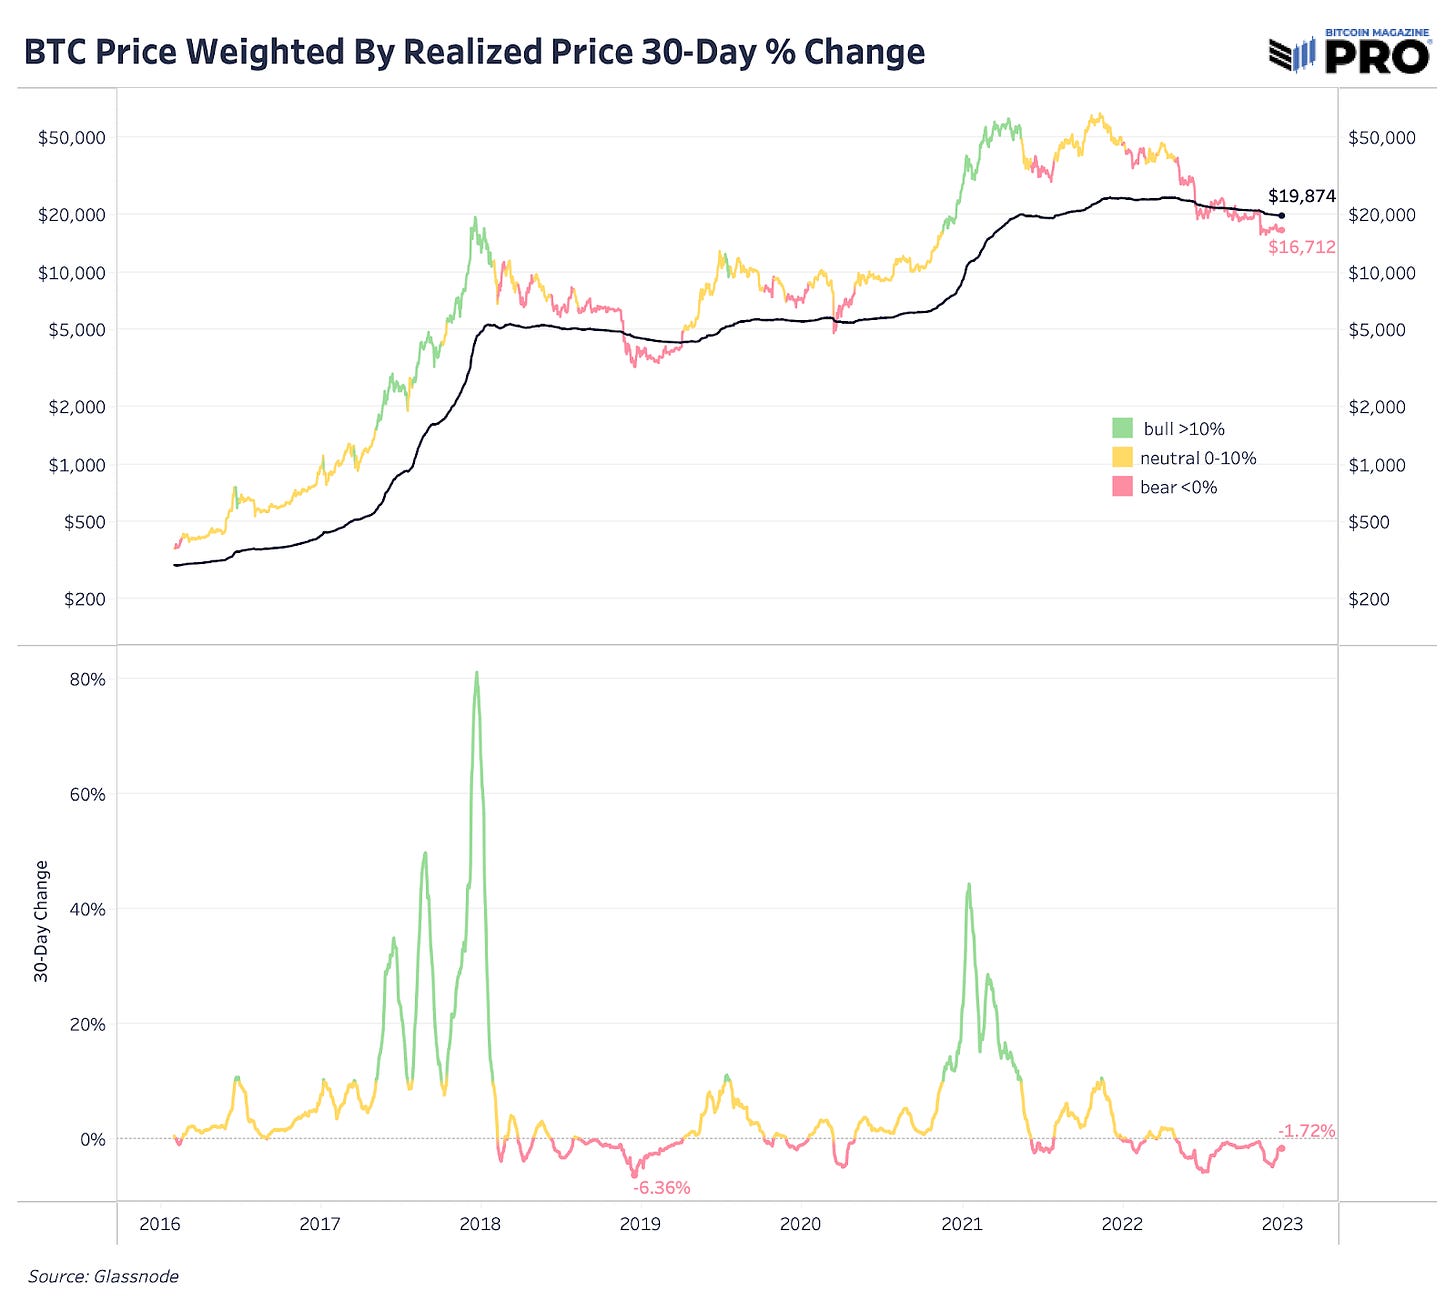
It can be useful to evaluate the growth in bitcoin’s realized price as a useful gauge to its true capital inflows/outflows. As shown below, given the macroeconomic environment and deteriorating liquidity conditions across the globe, bitocin’s realized price/market cap saw relative outflows over the course of the year, with the bitcoin realized price now below $20,000.
Relative to its history, bitcoin is at the phase of the cycle where it's about as cheap as it gets. Its current market exchange rate is approximately 20% lower than its average cost basis on-chain, which has only happened at or near the local bottom of bitcoin market cycles. With this said, readers should consider the reality that 2023 likely brings about bitcoin’s first experience through a prolonged economic recession (COVID crash not included).
The Unwind Of The Carry
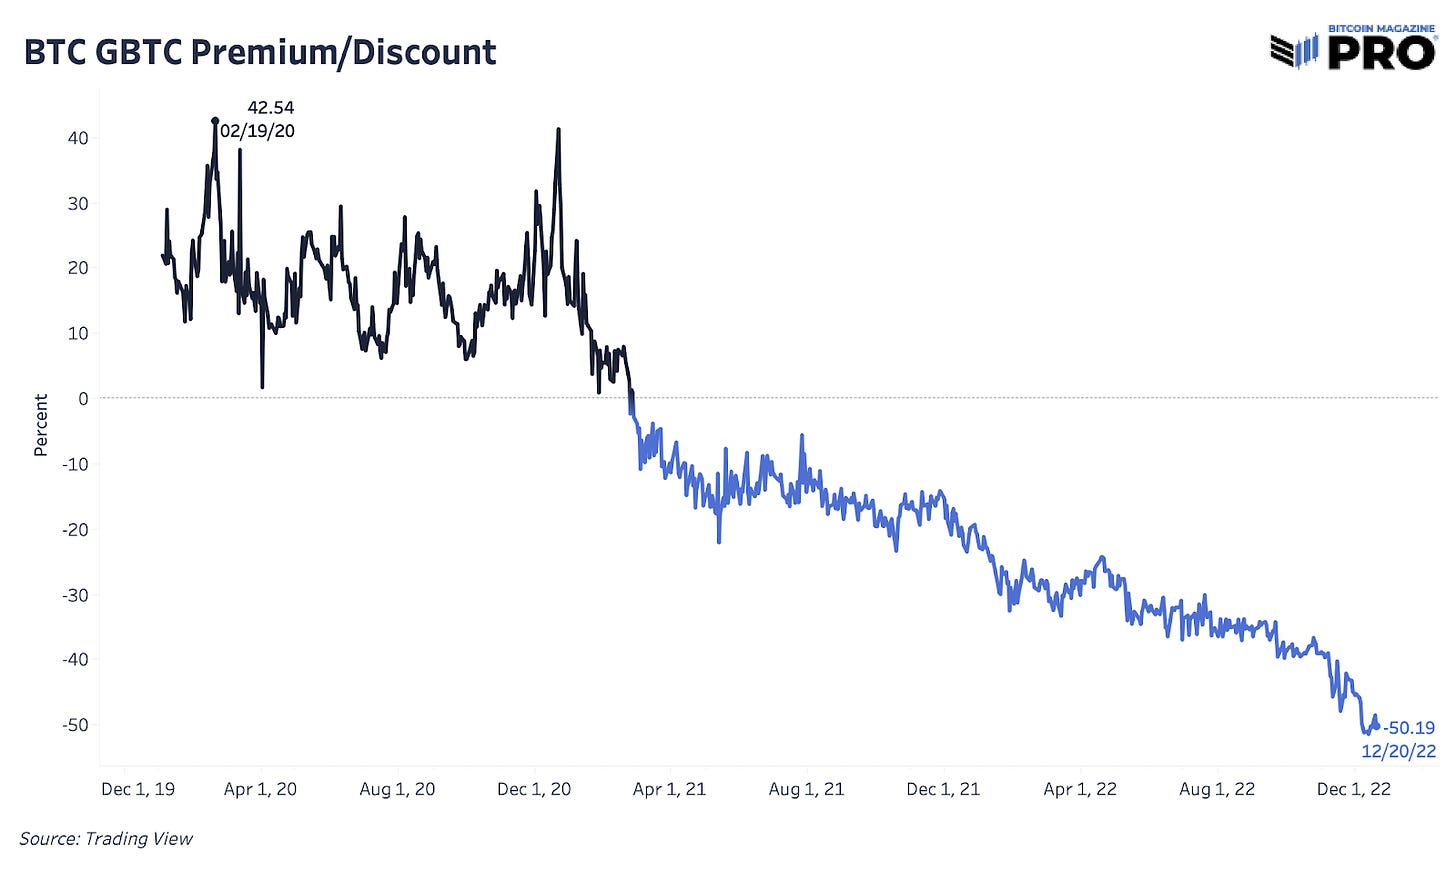
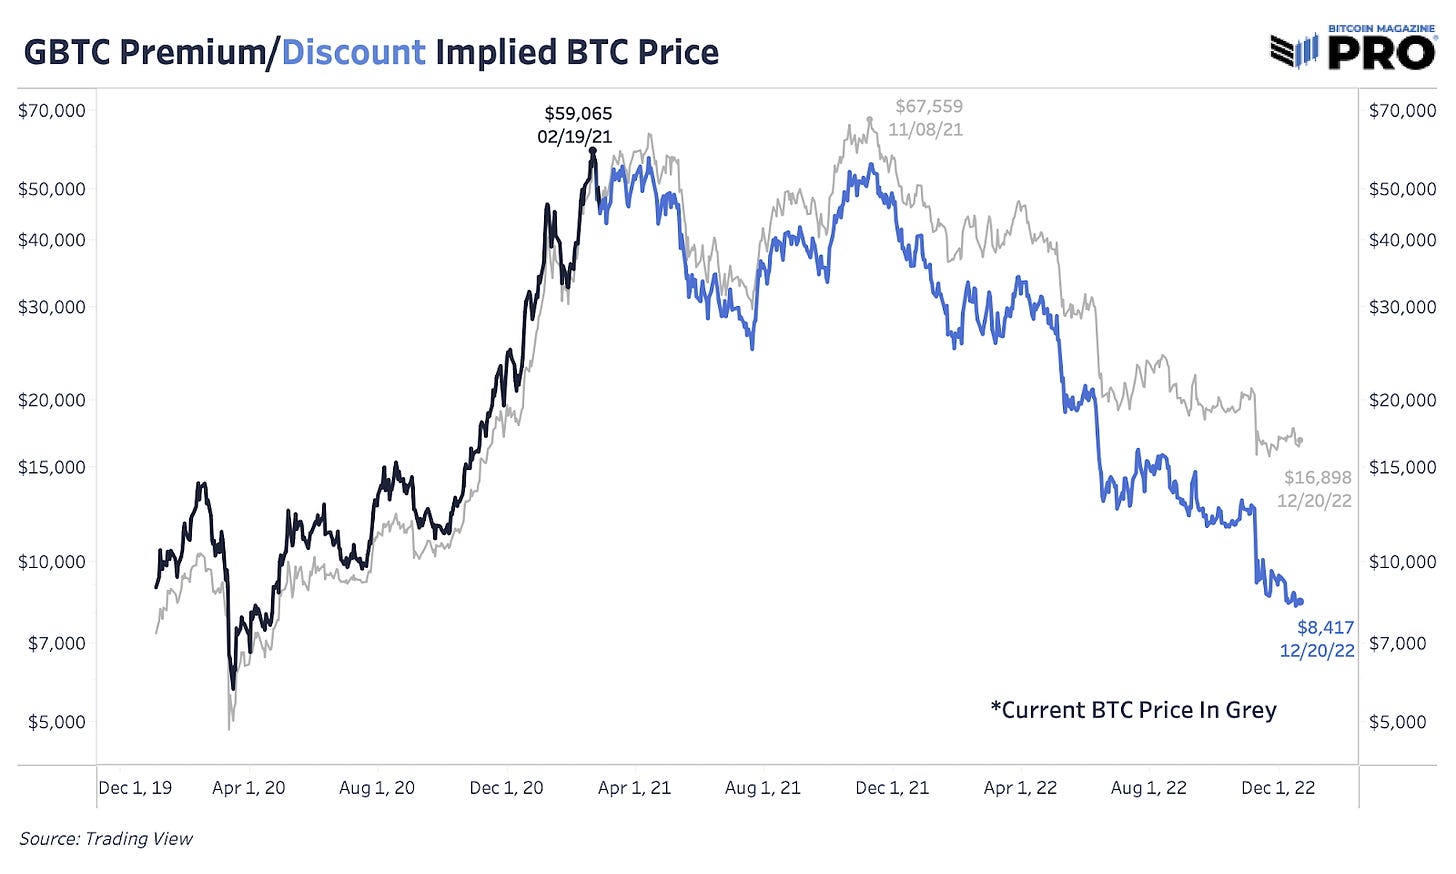
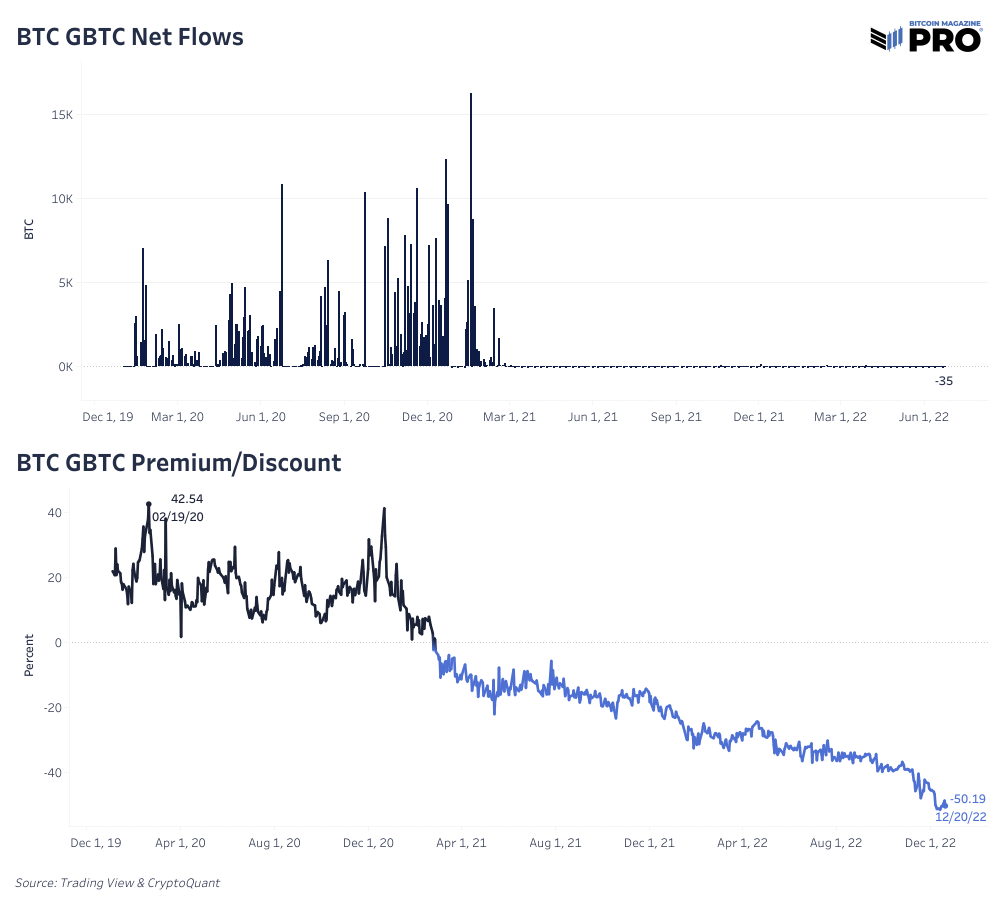
Much of the fuel that led to the explosive bull market in 2020 and 2021 was a variety of carry trades that created a reflexive loop of bullish market conditions. In particular, one of the largest carry trades was the GBTC arbitrage, which involved pledging bitcoin or dollars with Digital Currency Group and receiving shares of the Grayscale Bitcoin Trust with a six-month lockup period in return. When shares were trading at a premium to net asset value (NAV), there was an incentive to “arbitrage” this premium by creating more shares of GBTC, which required bitcoin to be purchased on the open market. As the GBTC premium to NAV eroded to a discount in early spring 2021, this left many “arbitrage trades” underwater, and as the price of bitcoin continued to fall and the GBTC discount continued to widen, a daisy chain of leveraged blowups and counterparty risk ensued. The GBTC carry trade was a staple for the crypto lending/yield complex, and the premium’s disappearance and the emergence of a significant discount led to a blow up of the industry’s most leveraged participants.
Nearly every shop that has filed for bankruptcy or shut down this year has had their hands in some form of GBTC trade. Now at over a 50% discount to NAV, GBTC shares remain a dark cloud hanging over the short-term trajectory for bitcoin price.
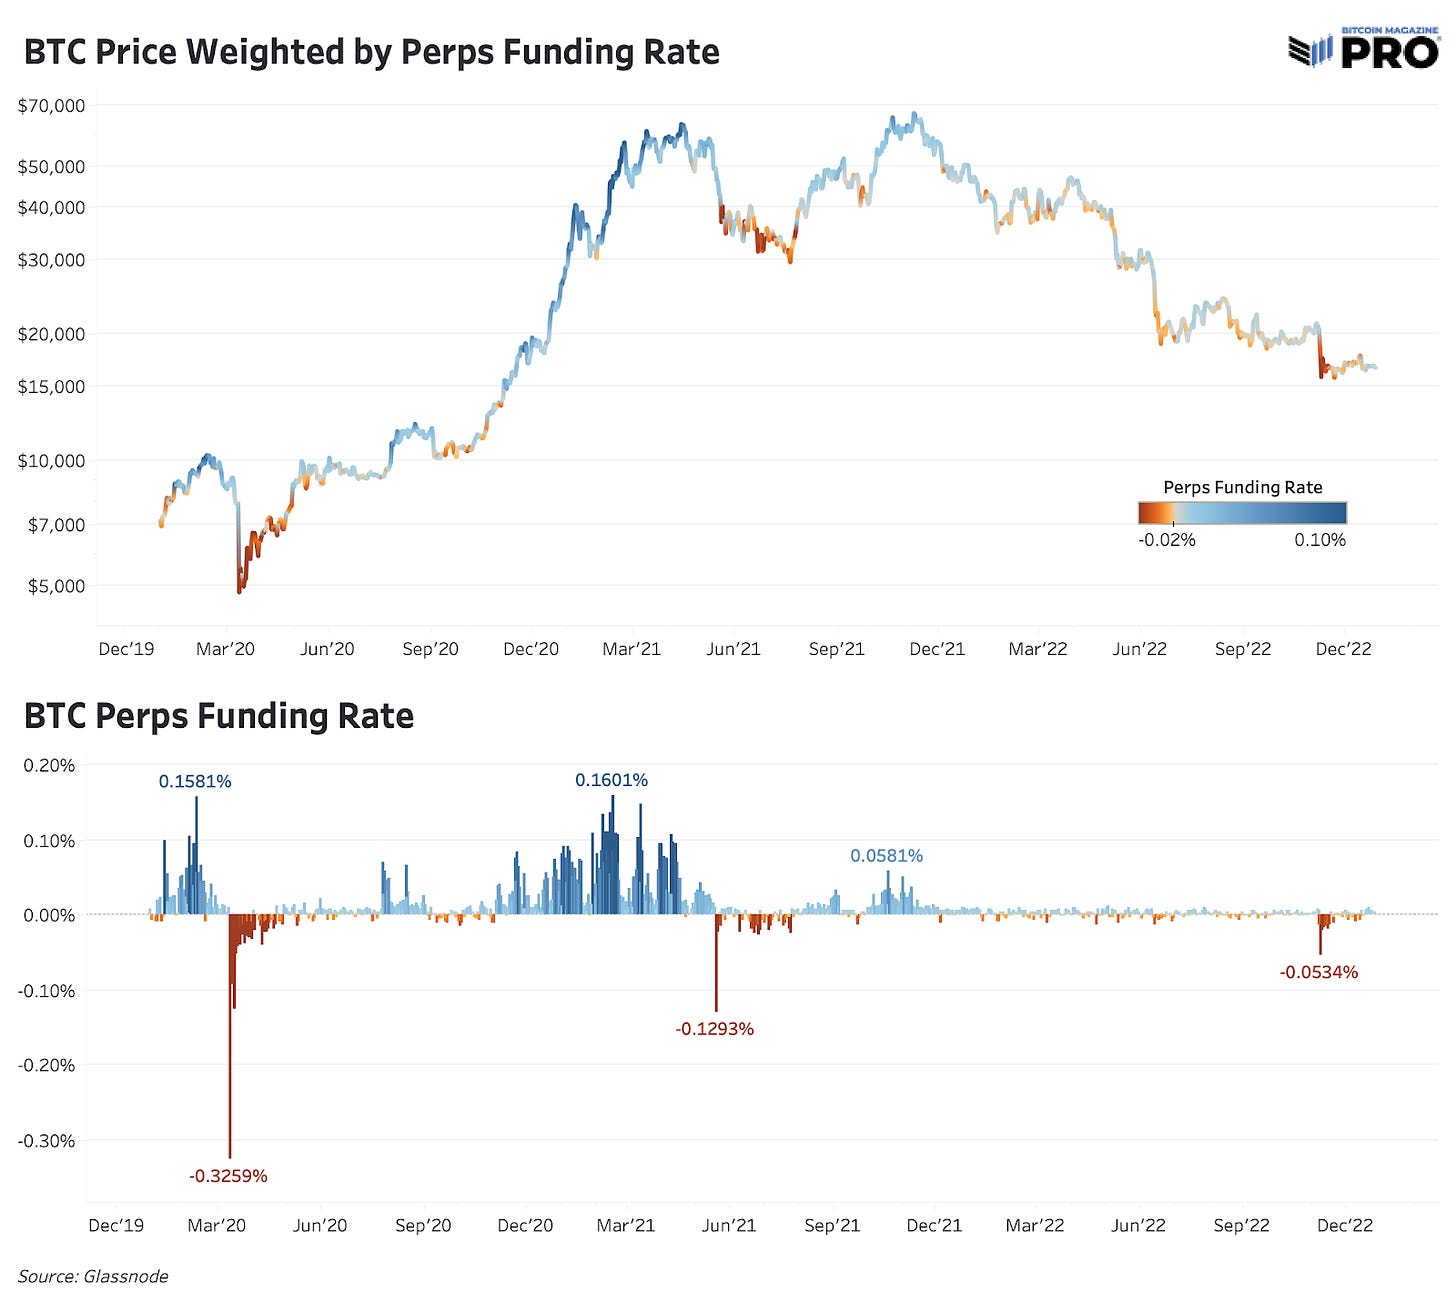
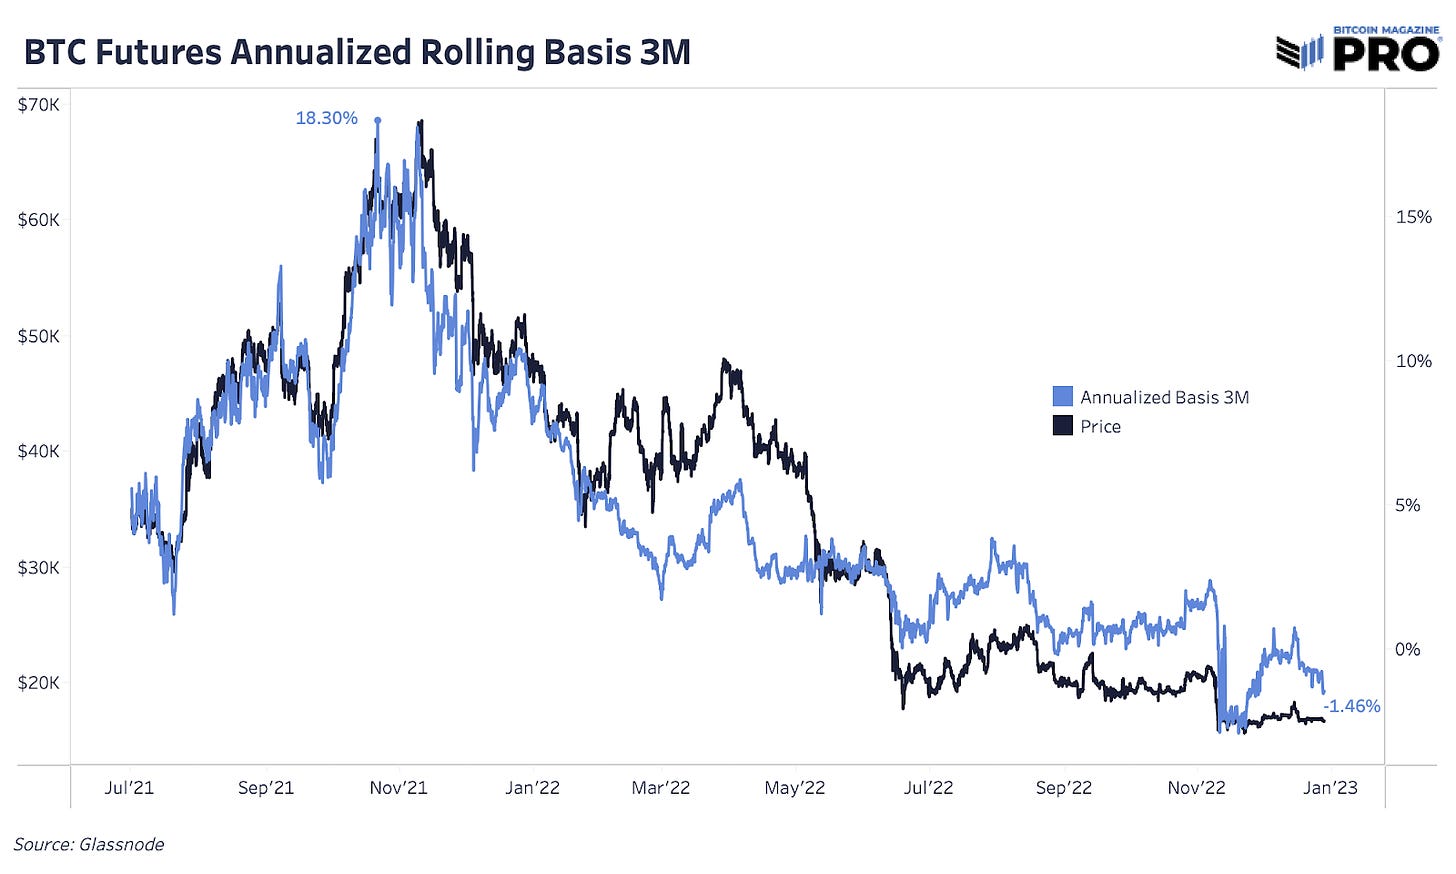
Another interconnected carry trade involved the premium that existed in both the calendar and perpetual futures market. With calendar futures, a large premium existed relative to the spot market. With perpetual futures, a very positive funding rate allowed for funds to take advantage of these conditions with market-neutral arbitrage. As it turns out, many of these funds weren’t taking advantage of the ludicrous rates offered in regards to the difference between spot prices and futures prices, but in fact, the futures premium existed as a result of the crypto demand for leverage that could be achieved using futures instruments.
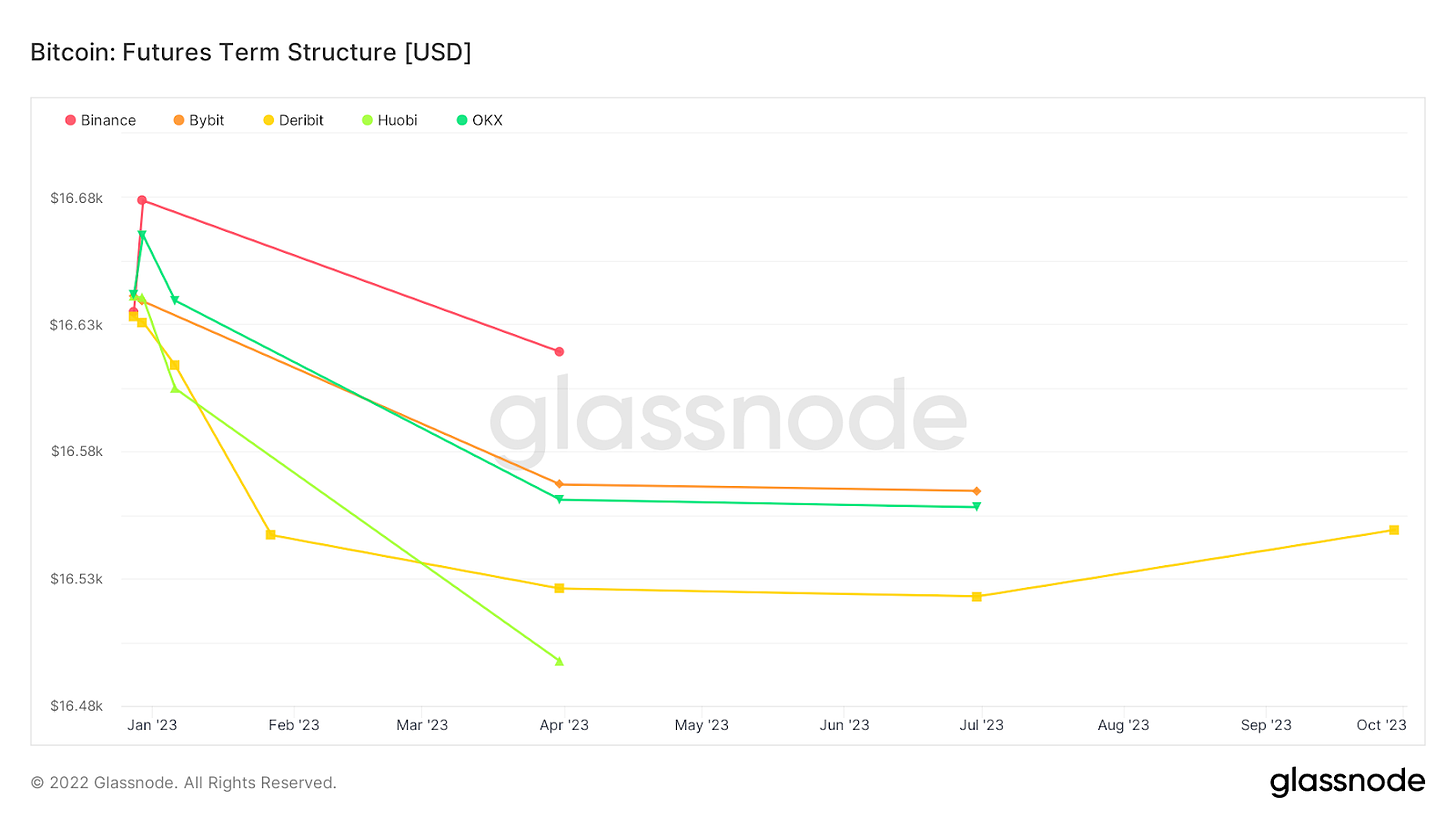
Since that leverage unwound, so has the large basis/premium between futures instruments and the spot price of bitcoin itself. Currently, the three-month futures basis is slightly negative, meaning that the futures market is trading in backwardation and perpetual futures funding is slightly positive, but below the 10% annualized neutral rate, signifying slightly bearish positioning for the remaining market participants.
The Macro Picture
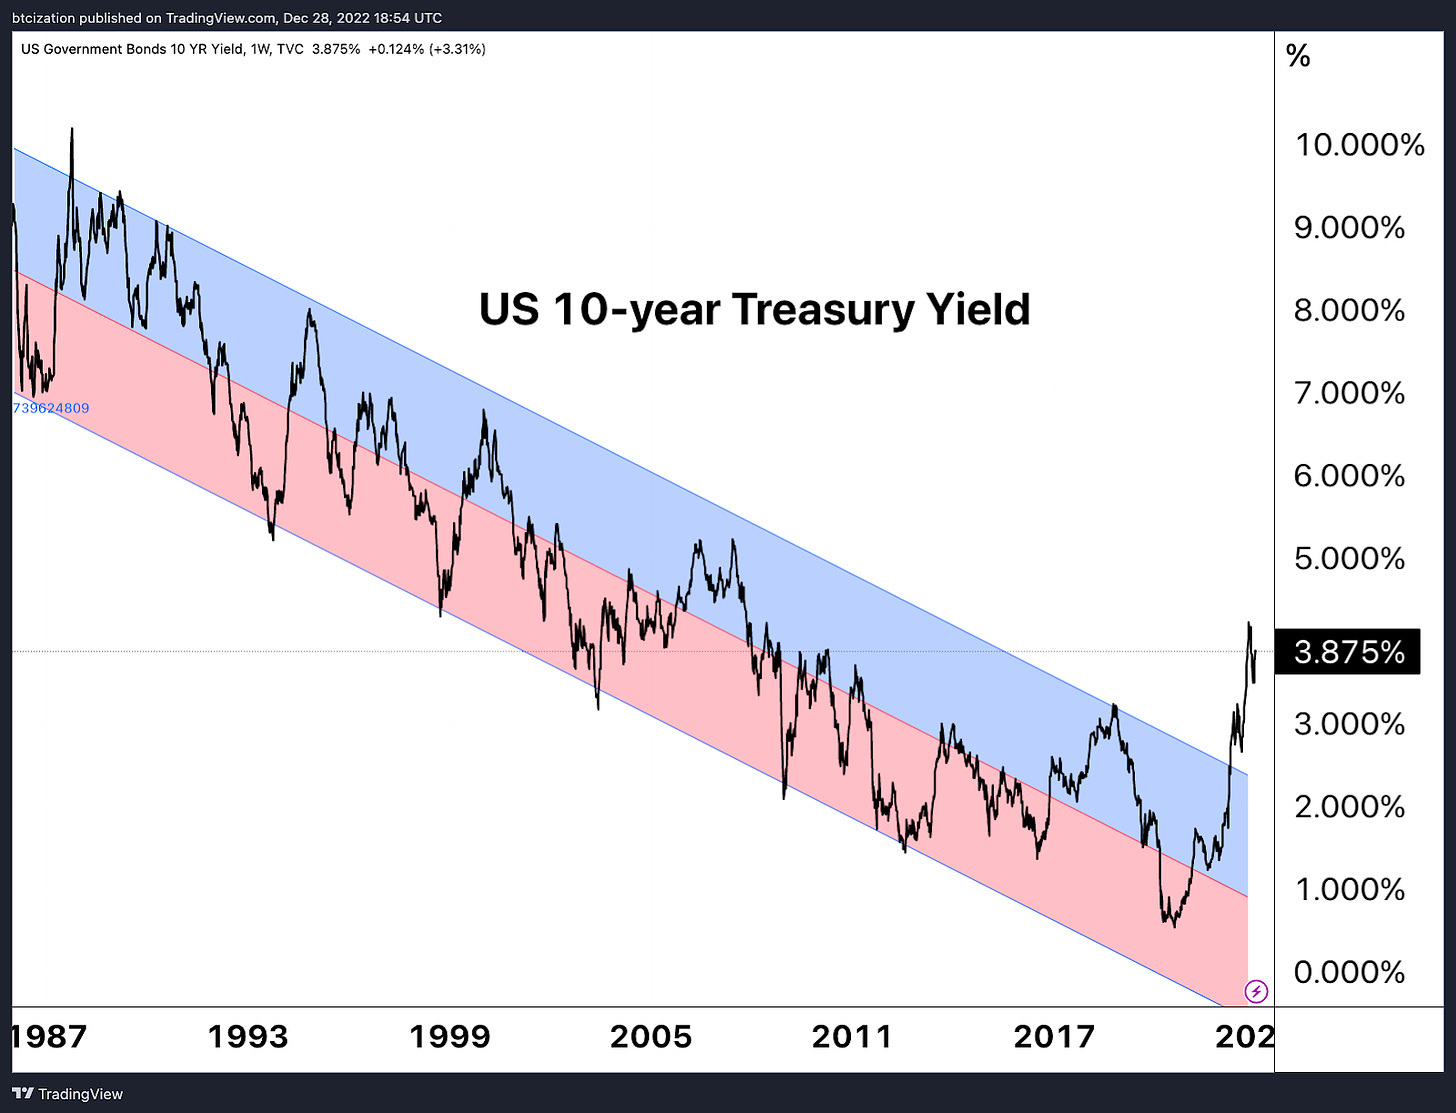
Nothing in financial markets occurs in a vacuum. Bitcoin’s ascent through 2020 and 2021 — while similar to previous crypto-native market cycles — was very much tied to the explosion of liquidity sloshing around the financial system post COVID. While 2020 and 2021 was characterized by the insertion of additional liquidity, 2022 has been characterized by the removal of liquidity. Inflation at levels not seen in four decades has caused the cost of capital to rapidly reprice higher.
We have covered this dynamic extensively throughout the year, and interested readers can check out the following previous issues if they wish to explore our live commentary further:
Related issues:
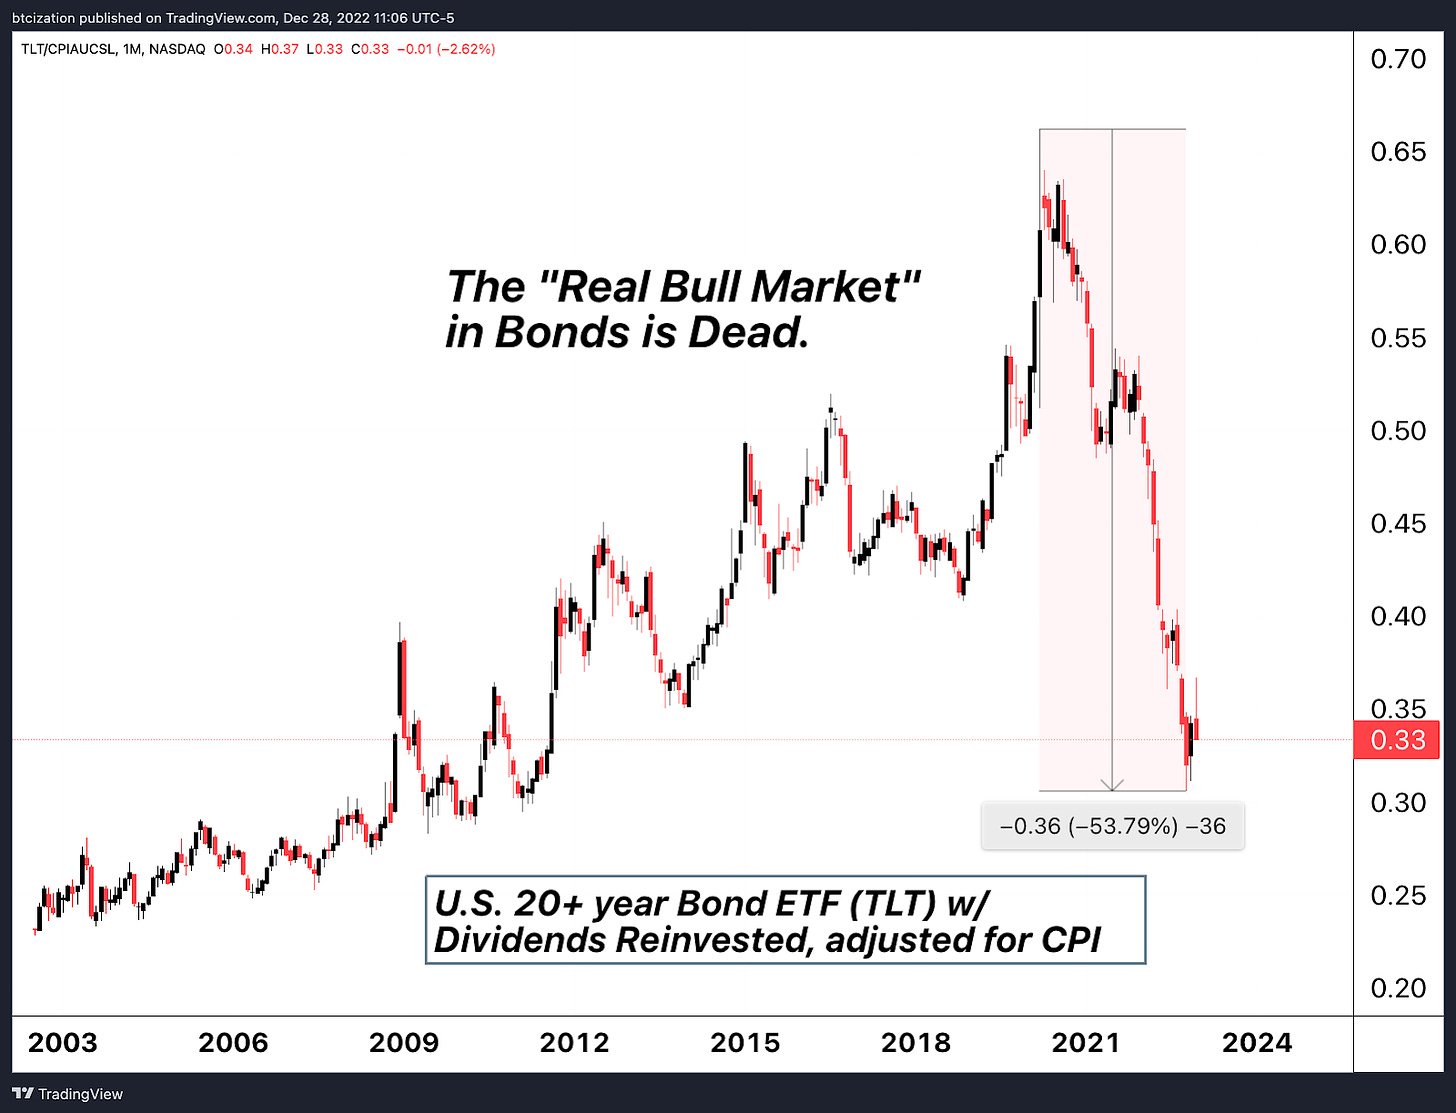
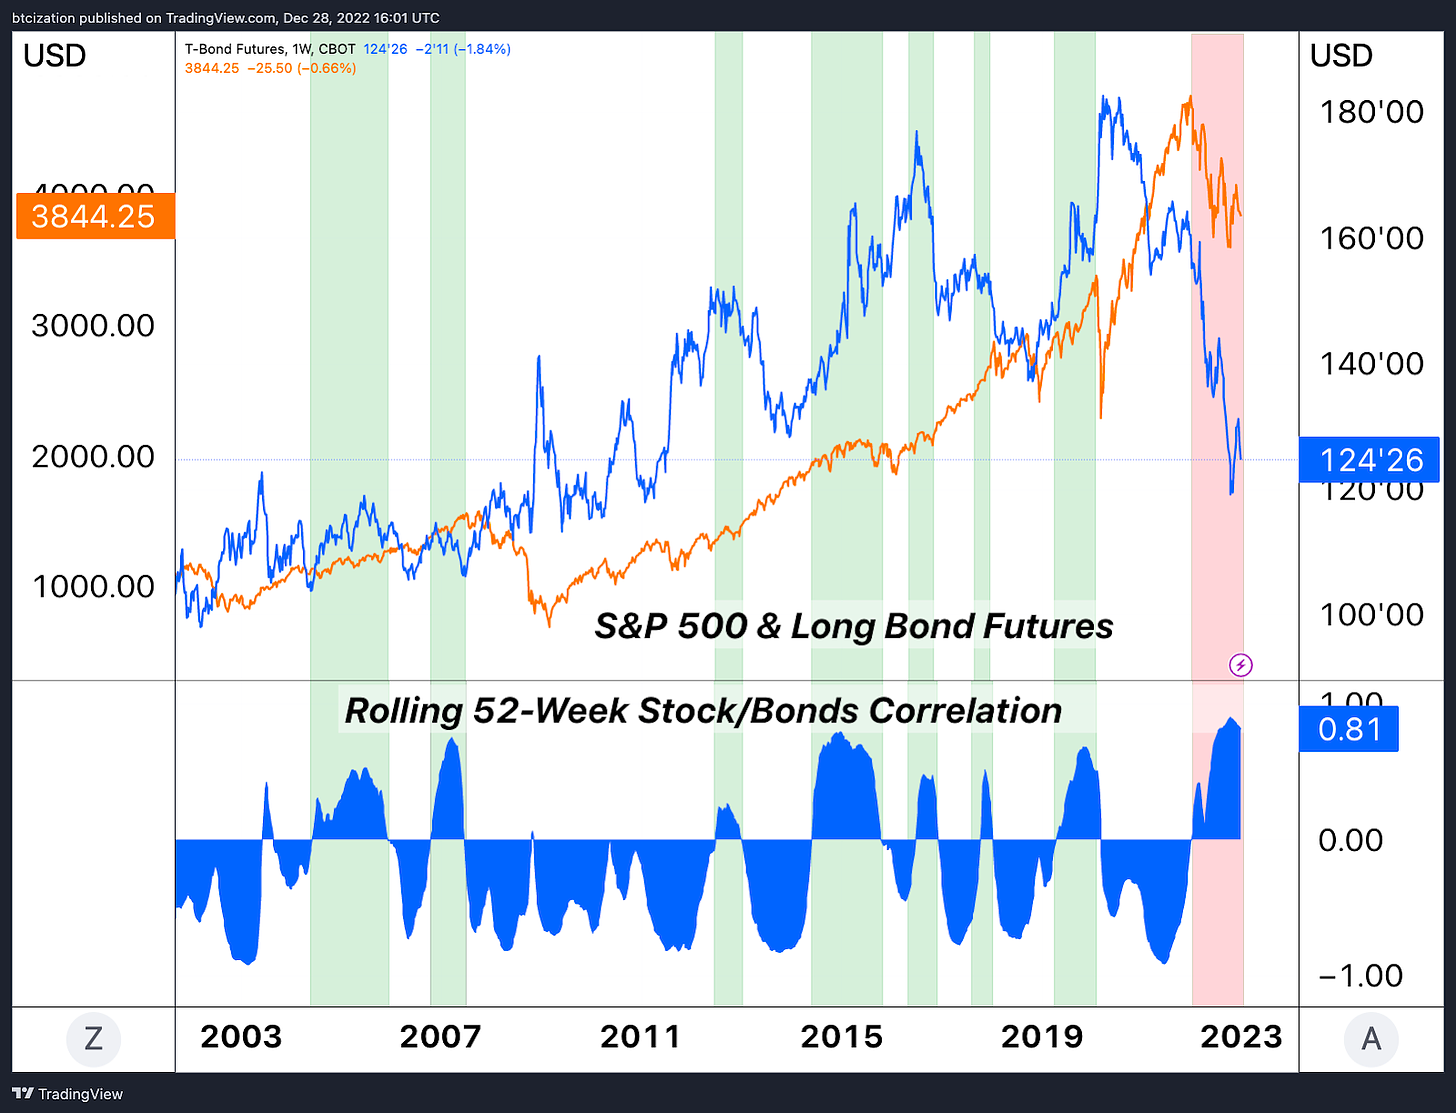
As a result of the rapid upwards repricing in interest rates, the global financial system saw its first stock-bond correlation crises since the ‘60s/‘70s, ending a forty year period of inverse correlation for bonds during stock market drawdowns.
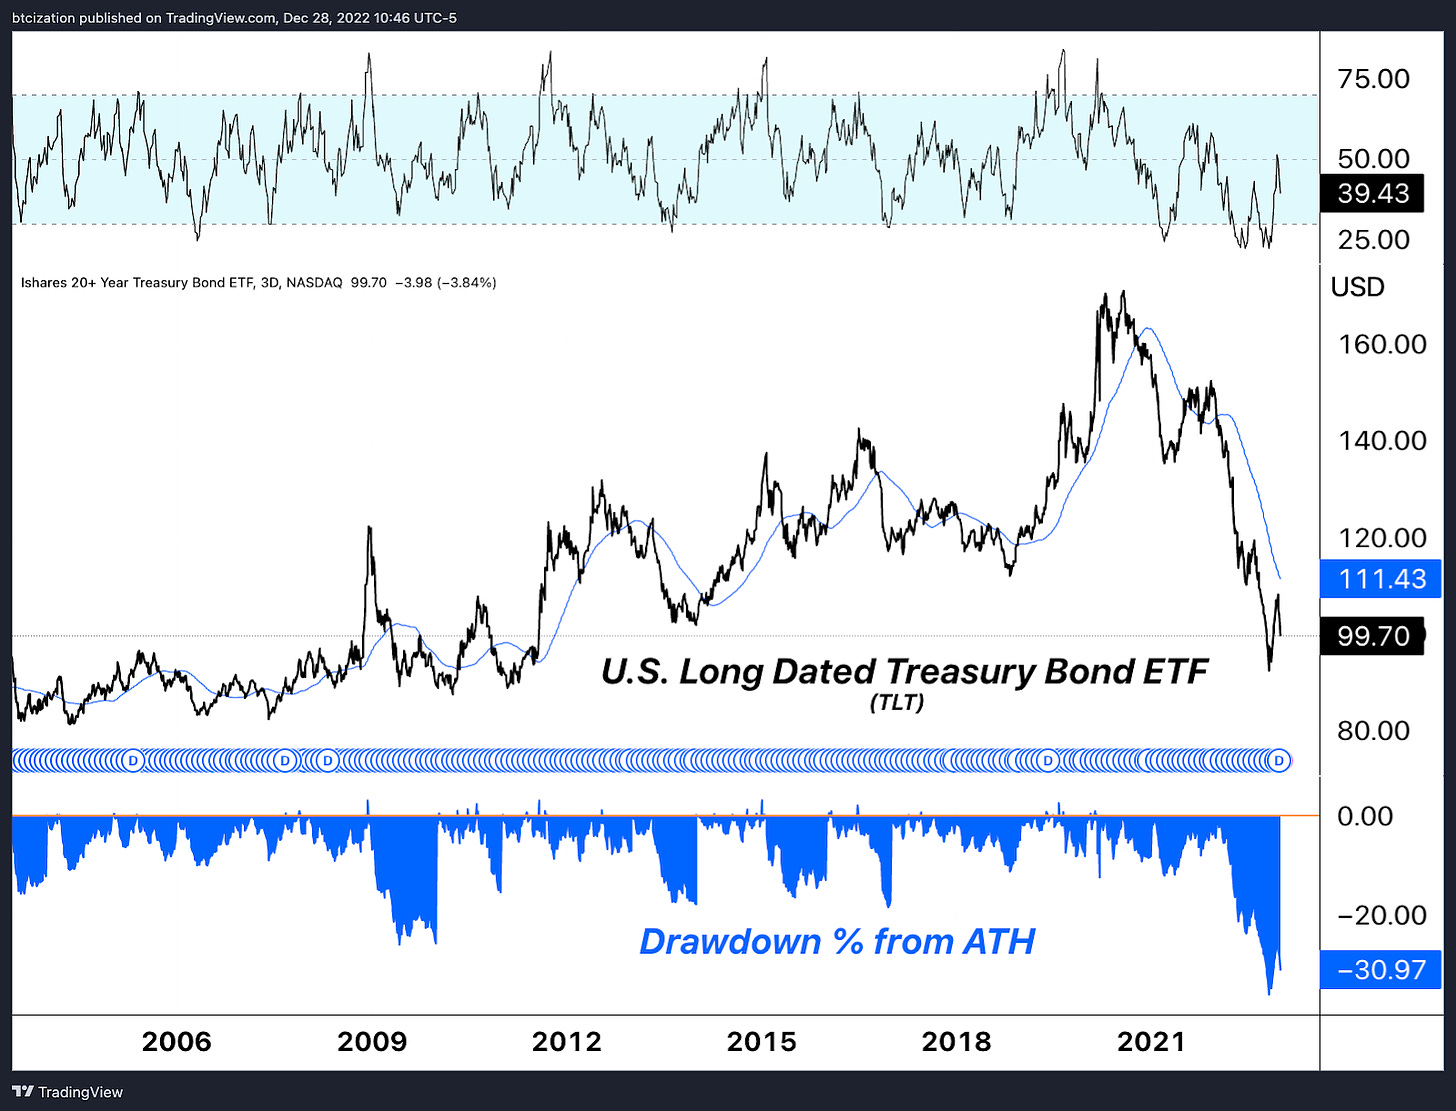
As the global reserve asset (U.S. Treasury bonds) saw its largest drawdown in modern history, valuations and liquidity across global markets suffered, dragging every asset along with it — of which bitcoin was obviously included.
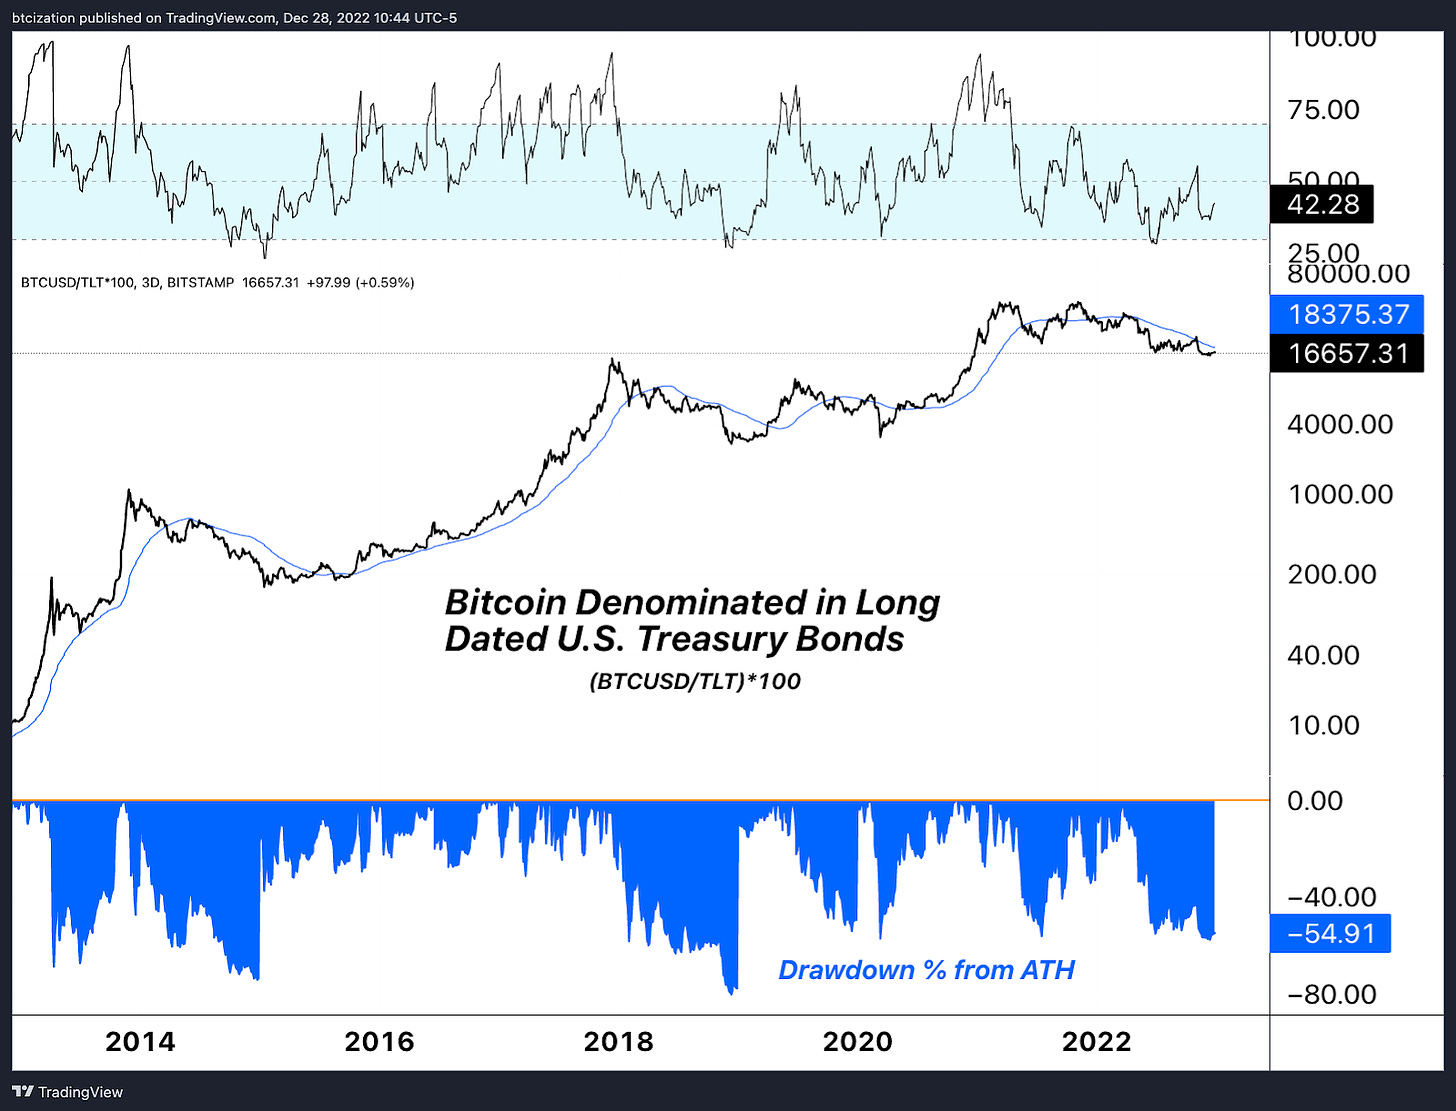
Interestingly enough, when denominating bitcoin against U.S. Treasury bonds (of which we believe to be bitcoin’s largest theoretical competitor for monetary value over the long term), comparing the drawdown during 2022 was rather benign compared to one’s in bitcoins history.
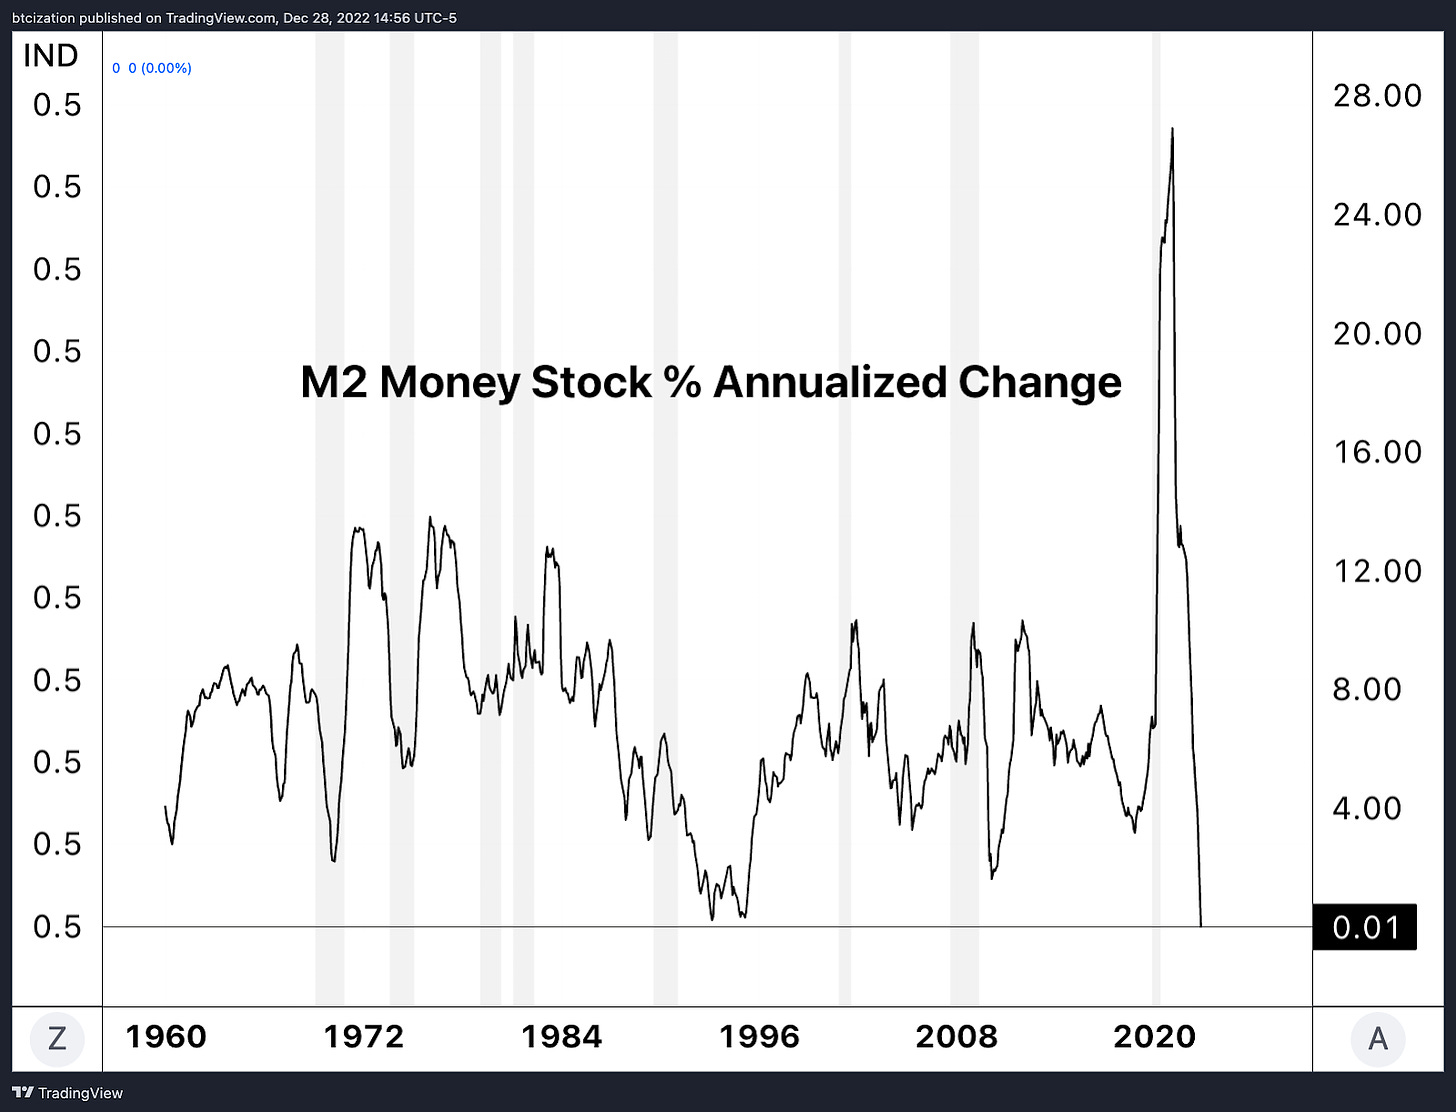
Given the slowdown in economic activity and the relative rate of change of base money in the system, we expect headwinds to remain into 2023, specifically regarding the USD denominator of BTC/USD.
As we head into 2023, marginal sellers can remain in control so long as USD-specific headwinds intensify. In particular, a strong dollar against other FX pairs, and bonds and stocks as a liquidity gauge will tell the story. Bitcoin-native accumulation metrics can continue to strengthen in the meantime, which will further intensify its supply inelasticity, increasing the potential for upside volatility when the tides reverse.
Thank you for reading Bitcoin Magazine Pro, we sincerely appreciate your support! Please consider leaving a like and letting us know your thoughts in the comments section. As well, sharing goes a long way toward helping us reach a wider audience!



With regard to the increasing volume in the Bitcoin network, it would be very beneficial to know what users of Bitcoin are actually doing to comprise this volume. For example, is the volume: purchases and sales of bitcoin, purchases and sales of goods and services, remittances, collateralizing transactions, hodling, etc.