Inflation Abates, Lag Effects Starting To Take Hold
Though CPI came in cooler than expected, it still means that the dollar is losing about 5% of its purchasing power on a year-over-year basis. Effects of increased interest rates impacting the economy.
Relevant Past Articles:
Friday Roundup: Inflation Remains Key Focus, Rate Hike Inbound
Core Inflation Remains Hot As Fed Officials Expect Recession
Quantitative Easing Or Not? A Primer On The Fed’s Shiny New Tool
PRO Market Keys Of The Week: Market Anxiously Awaits Fed Meeting
U.S. inflation showed continued signs of moderating in April, according to the Consumer Price Index figures that came in this morning. On a year-over-year basis, CPI came in at 4.9%. This is the first sub-5% reading in two years, and also notable for being the 10th consecutive monthly decline for the year-over-year reading — the longest streak in the history of the data. With inflation coming in slightly lower than consensus estimates for the month of April, markets increased the probability of a pause in the Fed’s tightening cycle rather than another upcoming hike, a net positive for risk assets in the interim.
“We view today’s CPI report as supportive of our call for a pause at the June FOMC meeting, because the shelter stepdown looks increasingly durable, inflation breadth softened somewhat further, and the strength in used car prices is likely temporary.” — Goldman Sachs
While prices are still rising for the American consumer, the rate of increase has been decelerating for the longest period in history, which is a positive sign for markets that were caught blindsided by the fastest tightening cycle in history, following the not-so-transitory inflation spike.

Let’s dig into the components of inflation to gain more insight into what is driving price increases at this phase of the business cycle.
Both CPI and Core CPI (excluding food and energy) came in at 0.4% month-over-month (approximately 5% year-over-year), still higher than the Fed’s 2% stated target. Shelter costs — the largest component of the services sector — increased by 0.4% last month, its smallest increase in over a year at the same time as prices for airfares, hotels and new cars fell.

The deceleration in shelter prices is a positive development for markets, a sign that the lag effects of tightening are beginning to be reflected. Shelter prices, which historically comes with a lag, wildly understated the effects of loose monetary policy for much of 2021 and 2022, and now appears to be following rent prices to the downside on a rate-of-change basis.

A look at the cumulative percentage change in both rents and shelter prices demonstrates the lagging effects of shelter prices, which account for more than a third of the index. Based on the trend, further deceleration in the shelter inflation rate should be expected for the rest of the year.

Meet The PRO Team At Bitcoin 2023!
Bitcoin 2023 is just one week away and we couldn’t be more excited for the upcoming event. Bitcoin Magazine PRO will be at the conference and attendees will have the chance to hear the team speak at multiple panels. There will also be two opportunities to meet the team and pick up some swag!
The rest of this article is open to paying members only. Here’s what’s behind the paywall 🔏:
A look at how wage growth has compared to inflation-adjusted real wages. 🎈
Are positive real yields on the horizon? 🌅
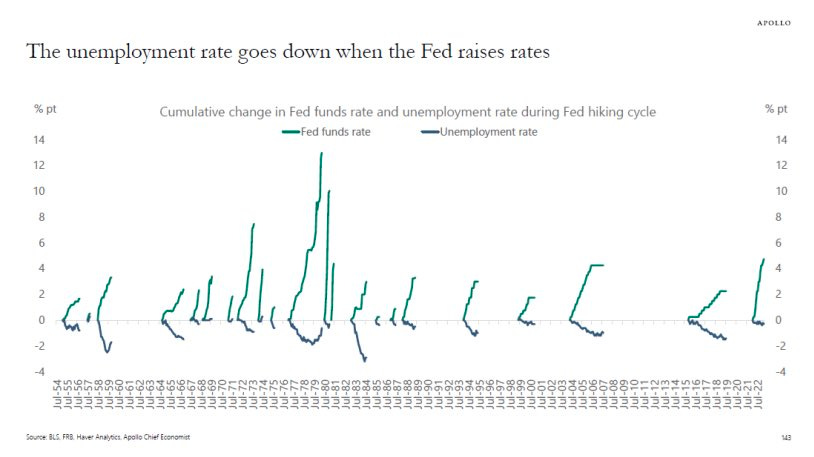
Historical data around tightening cycles and unemployment. 💼
Real Wages Stay Negative
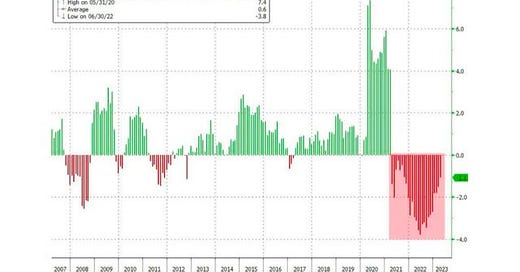
Despite the easing of inflationary pressures, real wages have declined for a record 25th consecutive month, reflecting the disparity between nominal price and earnings growth which shows contracting real purchasing power for the U.S. labor force.
In nominal terms, average hourly wages have risen from just under $30 per hour to approximately $33.50 since the start of 2021. In real terms, workers have gotten the equivalent of a pay reduction to just under $29 during the period due to inflation. Over the short term, inflation masks the true reality of the situation.
For the average American worker, your pay raise over the last two-plus years has actually been a pay reduction in terms of purchasing power.

The 25 consecutive months of year-over-year declines in real wages is a historic record — and not one that should be celebrated.
Positive Real Yields On The Horizon?
Using the trailing 12 months of inflation, yields on the short end of the U.S. Treasury curve are now positive compared to the inflation rate — a welcome sign for yield starved investors following the massively negative real yields that were seen over the previous three years. While comparing forward yields to trailing inflation readings is a form of heresy in the investment world, the measure does a decent job of displaying the interest rate regime with the benefit of hindsight.
Meanwhile, 5-year real yields are still in positive territory. These are measured by the difference between 5-year Treasury yields and 5-year inflation indexed Treasury yields. However, the positive rate on the 5-year real yields assumes that inflation expectations over the next five years are correct, which recent history has shown is not at all guaranteed.
Three years ago today, 5-year forward inflation expectations were 0.75% per year for the next five years. Three years later, inflation has compounded at 5.7% per year. If there is no inflation over the next two years, the 5-year compound annual growth rate from May 2020 to May 2025 will be 2.7%. At 1% over the next two years, it will be 3.3%. A rate of 2% for the next two years will put the reading at 3.9%.
The point here is twofold:
Inflation assumptions are a fickle thing. They rely on central banks not making policy errors, like QE infinity and ZIRP, as well as policy makers not unleashing a fiscal bonanza, and they don't account for the forces of technology, demographics and potential war.
Inflation compounds. There is something particularly off-putting about celebrating that your money buys 5% less than it did last year. Compounding inflation is the same reason why a dollar three decades ago feels like $0.48 today, despite exponential technological development and efficiency gains.
We cover inflation data because markets continue to treat it with a high priority, but it remains important to remain focused on the longer view.
Final Note
As an emergent monetary system, Bitcoin exists in parallel to a fiat system that will perpetually increase the amount of units of currency in the system. With each block that passes, the superiority of one system over the other reasserts itself, regardless of the short-term exchange rate fluctuations.
Looking at previous tightening cycles, the median time it takes for unemployment to meaningfully rise from the point where the Fed starts hiking is 14 months, which means the unemployment rate should start to tick upwards within the next few months if history is to serve as a precedent.
This will contribute to cooling inflationary pressures, but is also likely to contribute to dampening growth for the U.S. economy.
We still foresee a technical recession to be in the cards before the Fed flips from hawkish to dovish. If this is to unfold, dips are meant to be bought.
Thank you for reading Bitcoin Magazine Pro, we sincerely appreciate your support! Please consider leaving a like and letting us know your thoughts in the comments section. As well, sharing goes a long way toward helping us reach a wider audience!


