


Bitcoin Sellers Exhausted, Accumulators HODL The Line
Bitcoin supply-side dynamics look to be as strong as ever and on-chain indicators show that bitcoin made it through a capitulation phase, but macroeconomic headwinds remain for legacy and risk assets.


Relevant Past Articles:
On-Chain Data Shows 'Potential Bottom' For Bitcoin But Macro Headwinds Remain
Not Your Average Recession: Unwinding The Largest Financial Bubble In History
Analyzing On-Chain Bottom Indicators
In this week’s dashboard release, we highlighted some key on-chain metrics we like to track. In this article, we want to walk through more of those in detail. Across bitcoin’s short history, many on-chain cyclical indicators are currently pointing to what looks to be a classic bottom in the bitcoin price. Market extremes — potential tops and bottoms — are where these indicators have proven to be the most useful.
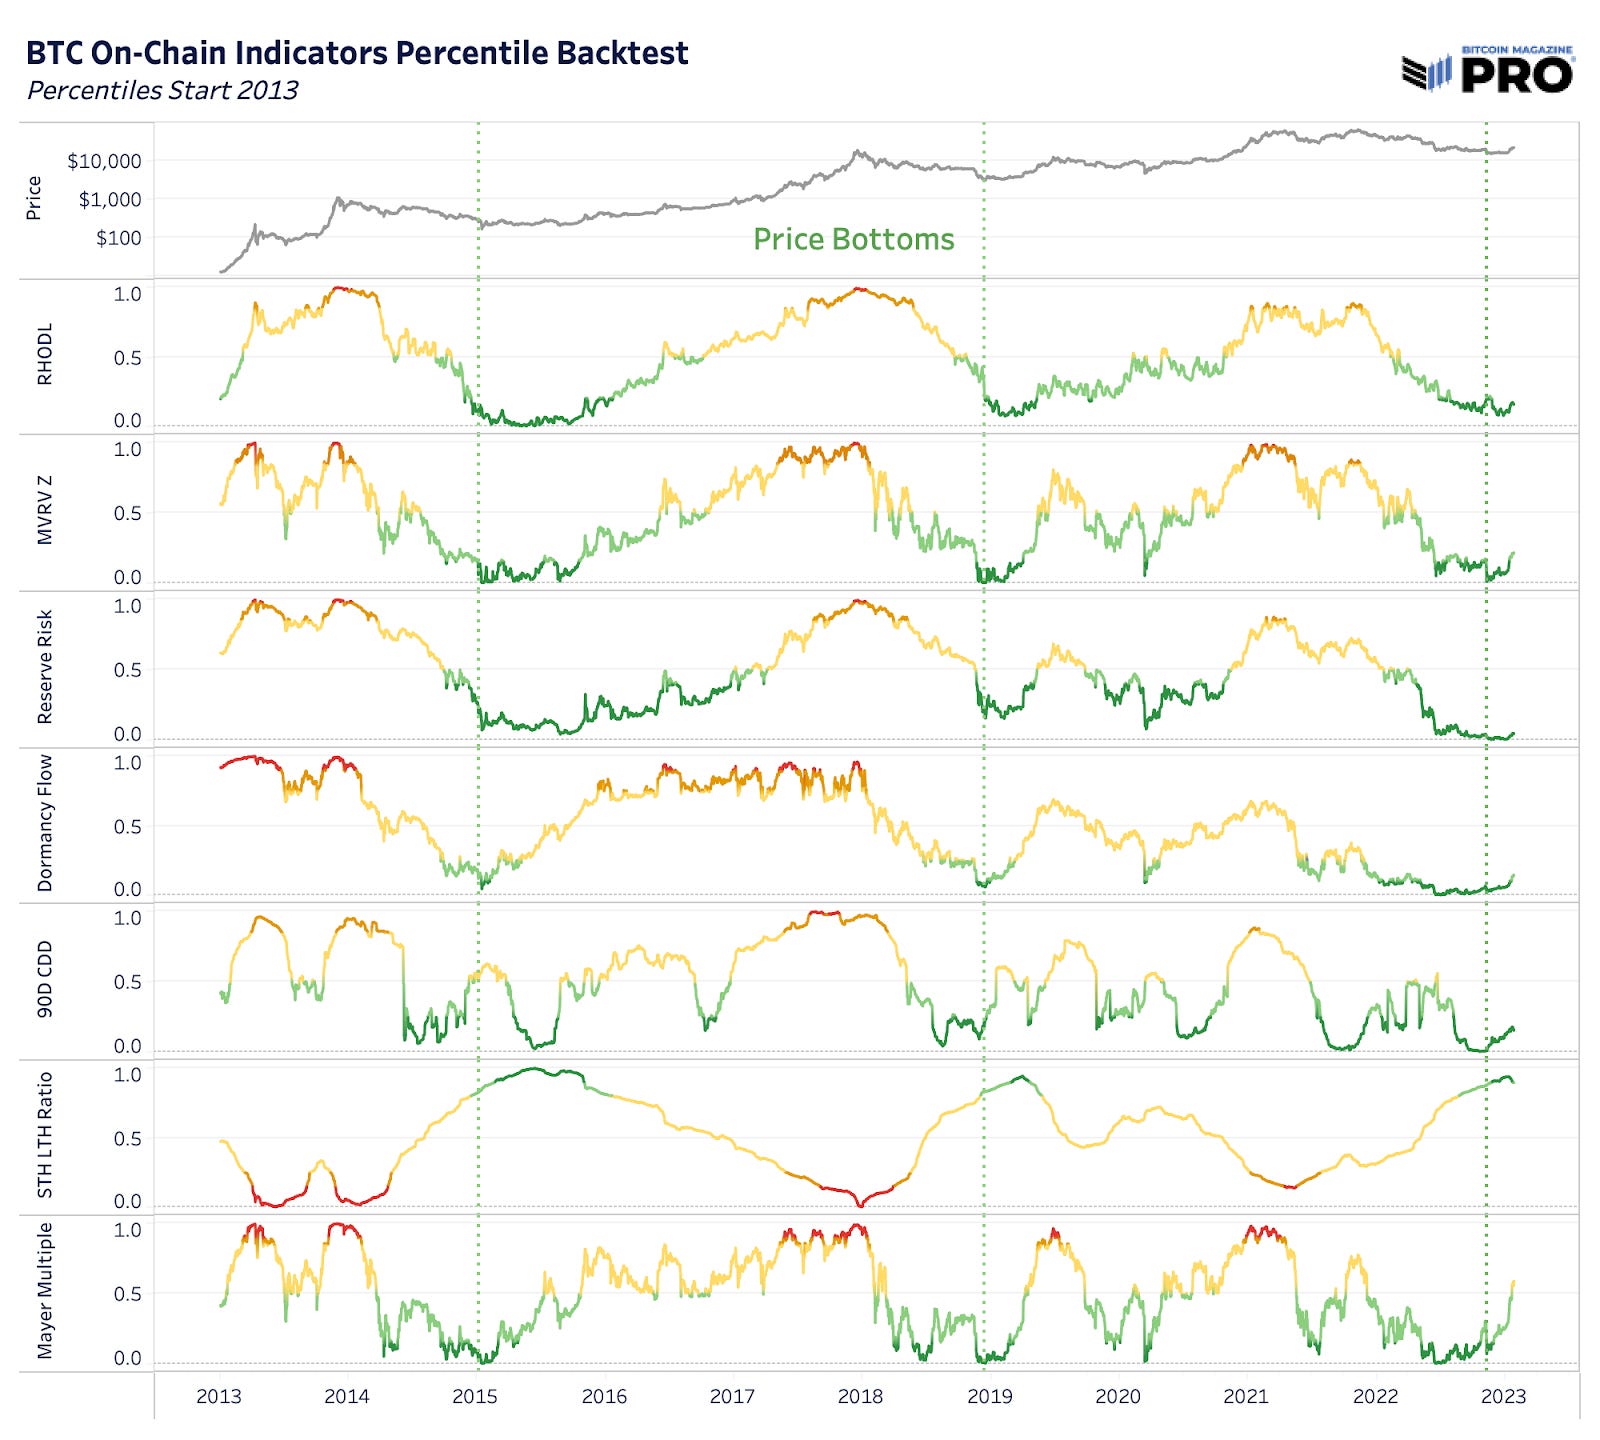
However, these indicators need to be considered alongside many other macroeconomic factors and readers should consider the possibility that this could be another bear market rally — as we still sit below the 200-week moving average price of around $24,600. That being said, if price can sustain above $20,000 in the short-term, the bullish metrics paint a compelling sign for more long-term accumulation here.
A major tail risk is a possible market-wide selloff in risk assets that are currently pricing a “soft landing” style scenario along with the potentially incorrect expectations of a Federal Reserve policy pivot in the second half of this year. Many economic indicators and data still point to the likelihood that we’re in the midst of a bear market similar to 2000-2002 or 2007-2008 and the worst has yet to unfold. This secular bear market is what’s different about this bitcoin cycle compared to any other in the past and what makes it that much harder to use historical bitcoin cycles after 2012 as perfect analogues for today.
All that being said, from a bitcoin-native perspective, the story is clear: Capitulation has clearly unfolded, and HODLers held the line. Let’s dive into some of our favorite bitcoin-native metrics to quantify the relationships between supply and demand.

Let’s start with a broad overview of our on-chain framework:
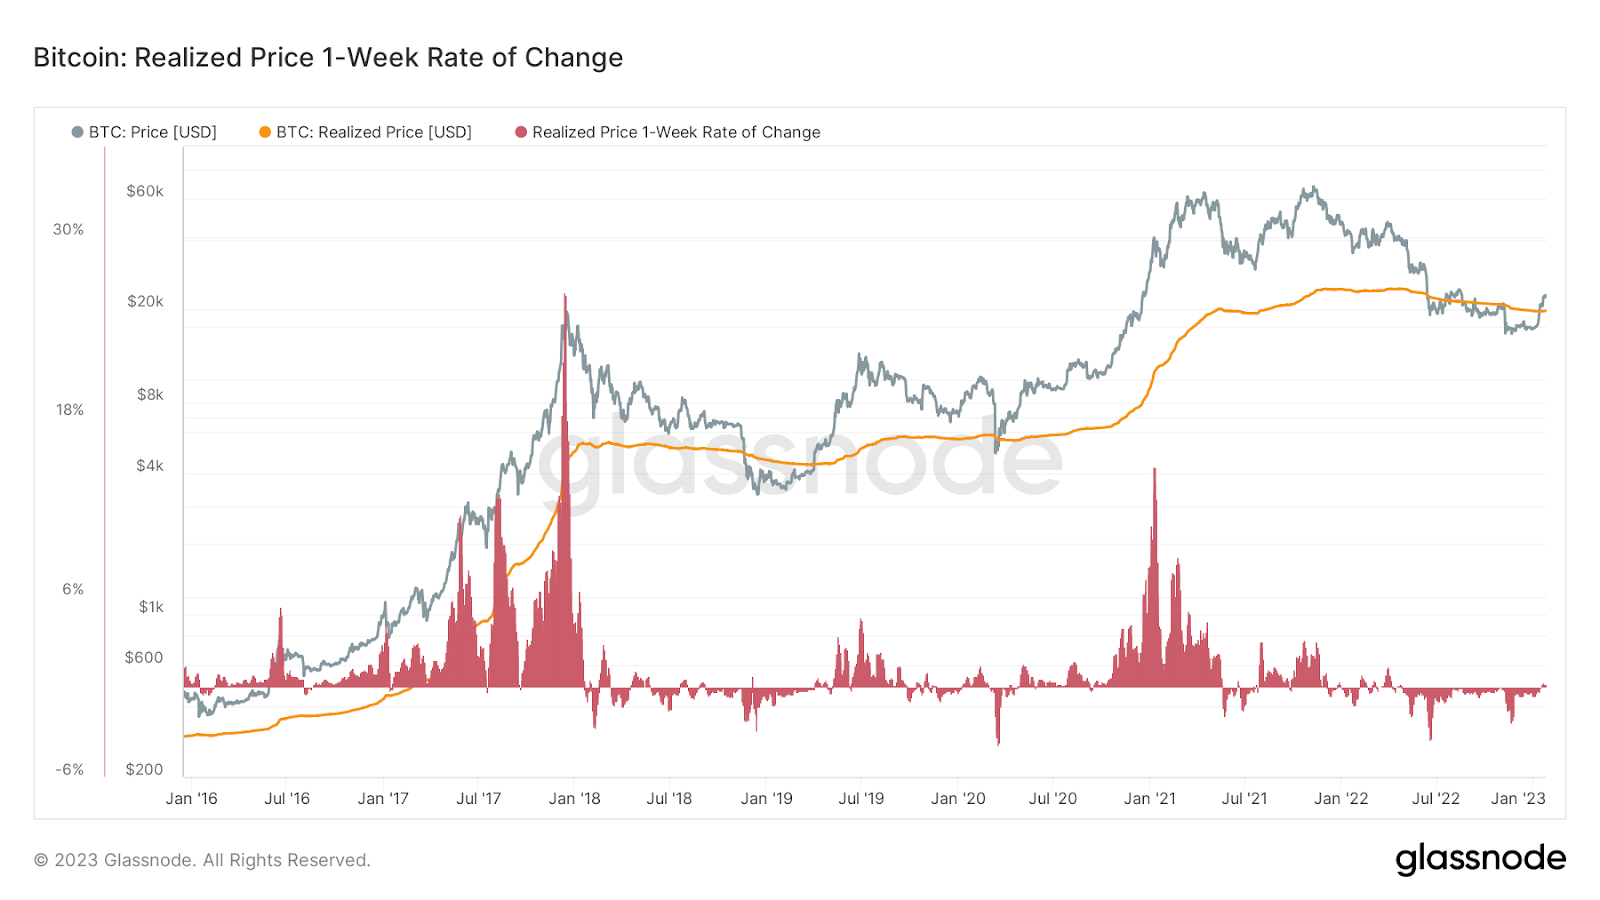
Given the transparent nature of bitcoin ownership, we can view various cohorts of bitcoin holders with extreme clarity. In this case, we are viewing the realized price for the average bitcoin holder as well as the same metric for both long-term holders (LTH) and short-term holders (STH).
Read Glassnode’s Quantifying Short-Term and Long-Term Holder Bitcoin Supply
The realized price, STH realized price and LTH realized price can give us an understanding of where various cohorts of the market are in profit or underwater.


With the resurgence past $23,000, bitcoin is looking to break above the cost basis of all three cohorts. This is significant because of the collective psychology effects when most market participants are no longer underwater.

The rest of this article is open to paying members only. Here’s what’s behind the paywall 🔏:
In-depth analysis of long-term and short-term holder metrics. 🔍
Reading HODL Waves and their effect on bitcoin price. 💎
Key takeaways for bitcoin’s supply-side dynamics. 🔑
Similarly, on a monthly basis, realized losses have flipped to realized profits for the first time since last April.


Capitulation and loss taking has flipped to profit realization across the network, which is a very healthy sign of thorough capitulation.
Now let’s shift to a breakdown of the various cohorts. Shown below is the cost basis of short-term holders and the STH market-value-to-realized-value ratio (MRVR). For short-term traders who follow trends, a break above the STH cost basis is significant and signals that this rally could have some legs.


For additional context, below are charts of short-term holders as a percentage of total bitcoin supply (less exchange balances). The first chart shows aggregate short-term holders broken up by those in profit/loss as a percentage of supply, while the second chart shows short-term holders currently in loss.
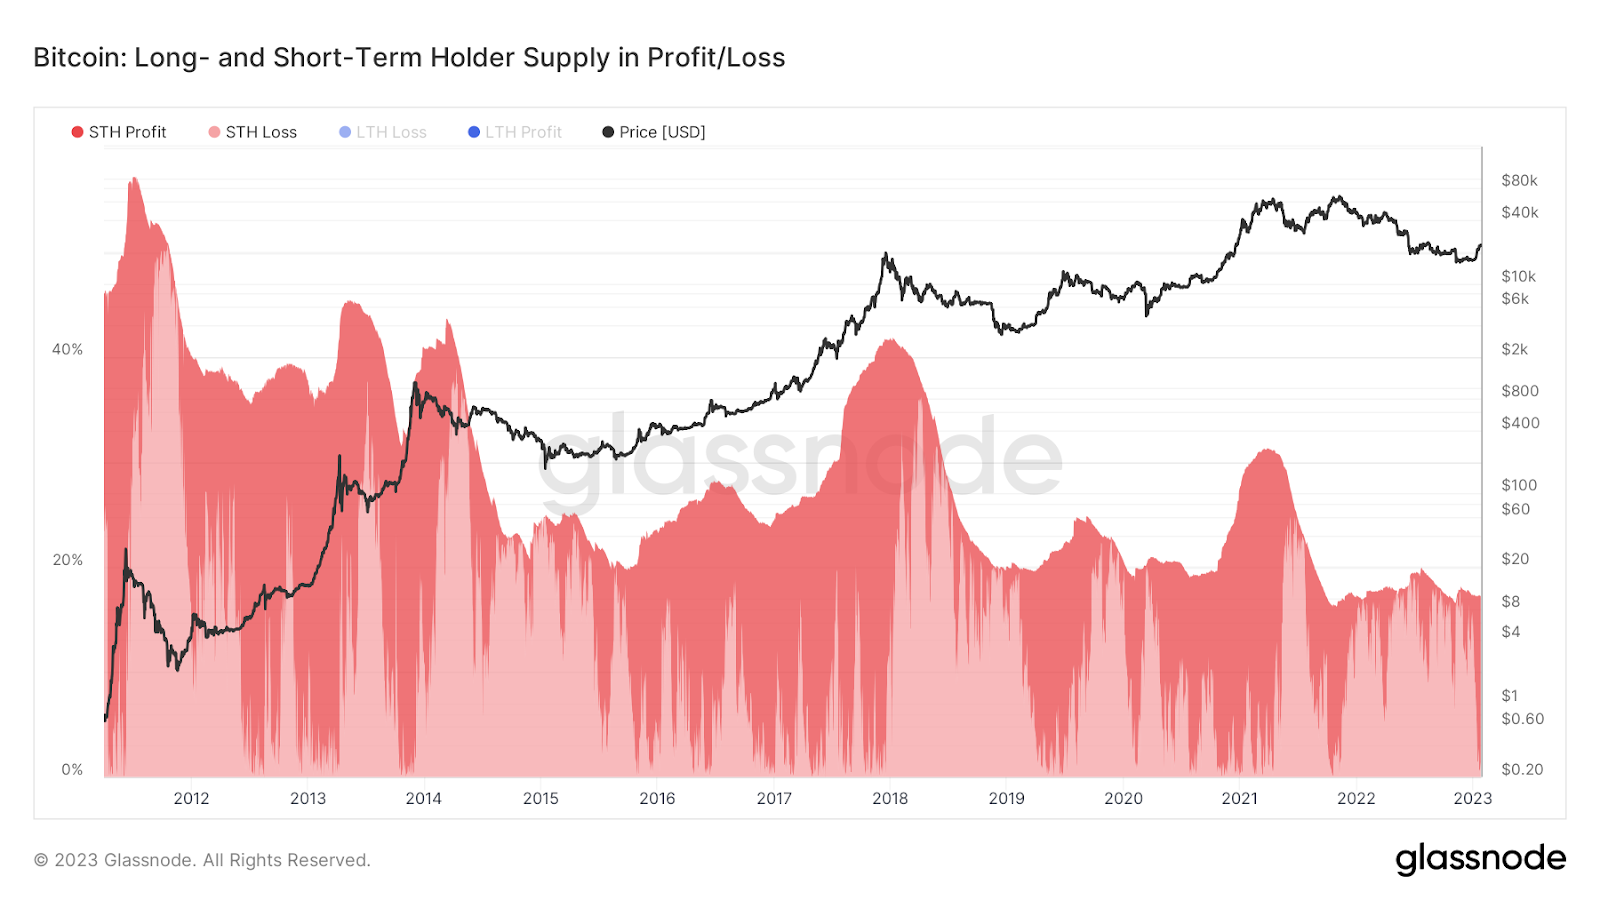

There is a strong case to be made that given the current elasticity of bitcoin’s supply — as evidenced by the historically small number of short-term holders or rather the large number of long-term holders — it will be challenging to shake out current market participants. Especially considering the gauntlet endured over the previous 12 months.
If we take a look at the ratio between the realized price of short-term holders and long-term holders, we can analyze a very interesting metric. When the LTH:STH realized price ratio is increasing, it means that the cost basis of STHs is increasing relative to LTHs, and conversely, when LTH:STH realized price ratio is decreasing, the cost basis of LTHs is increasing relative to the cost basis of STHs.
Essentially, what we can see taking place when the bitcoin price is rising while the LTH:STH is decreasing is that the marginal seller is exhausted.
Given the relatively slow moving average cost basis for long-term holders, a decreasing ratio is indicative of a rising cost basis for short-term holders, as allocators compete to acquire their share of an asset with a fixed supply. This is why you see the cost basis of LTHs stay somewhat stagnant during explosive bull markets, while the cost basis of STHs (many of whom are new market participants) explodes upwards — there are simply not enough coins to go around to meet newfound demand. Thus “number go up.”

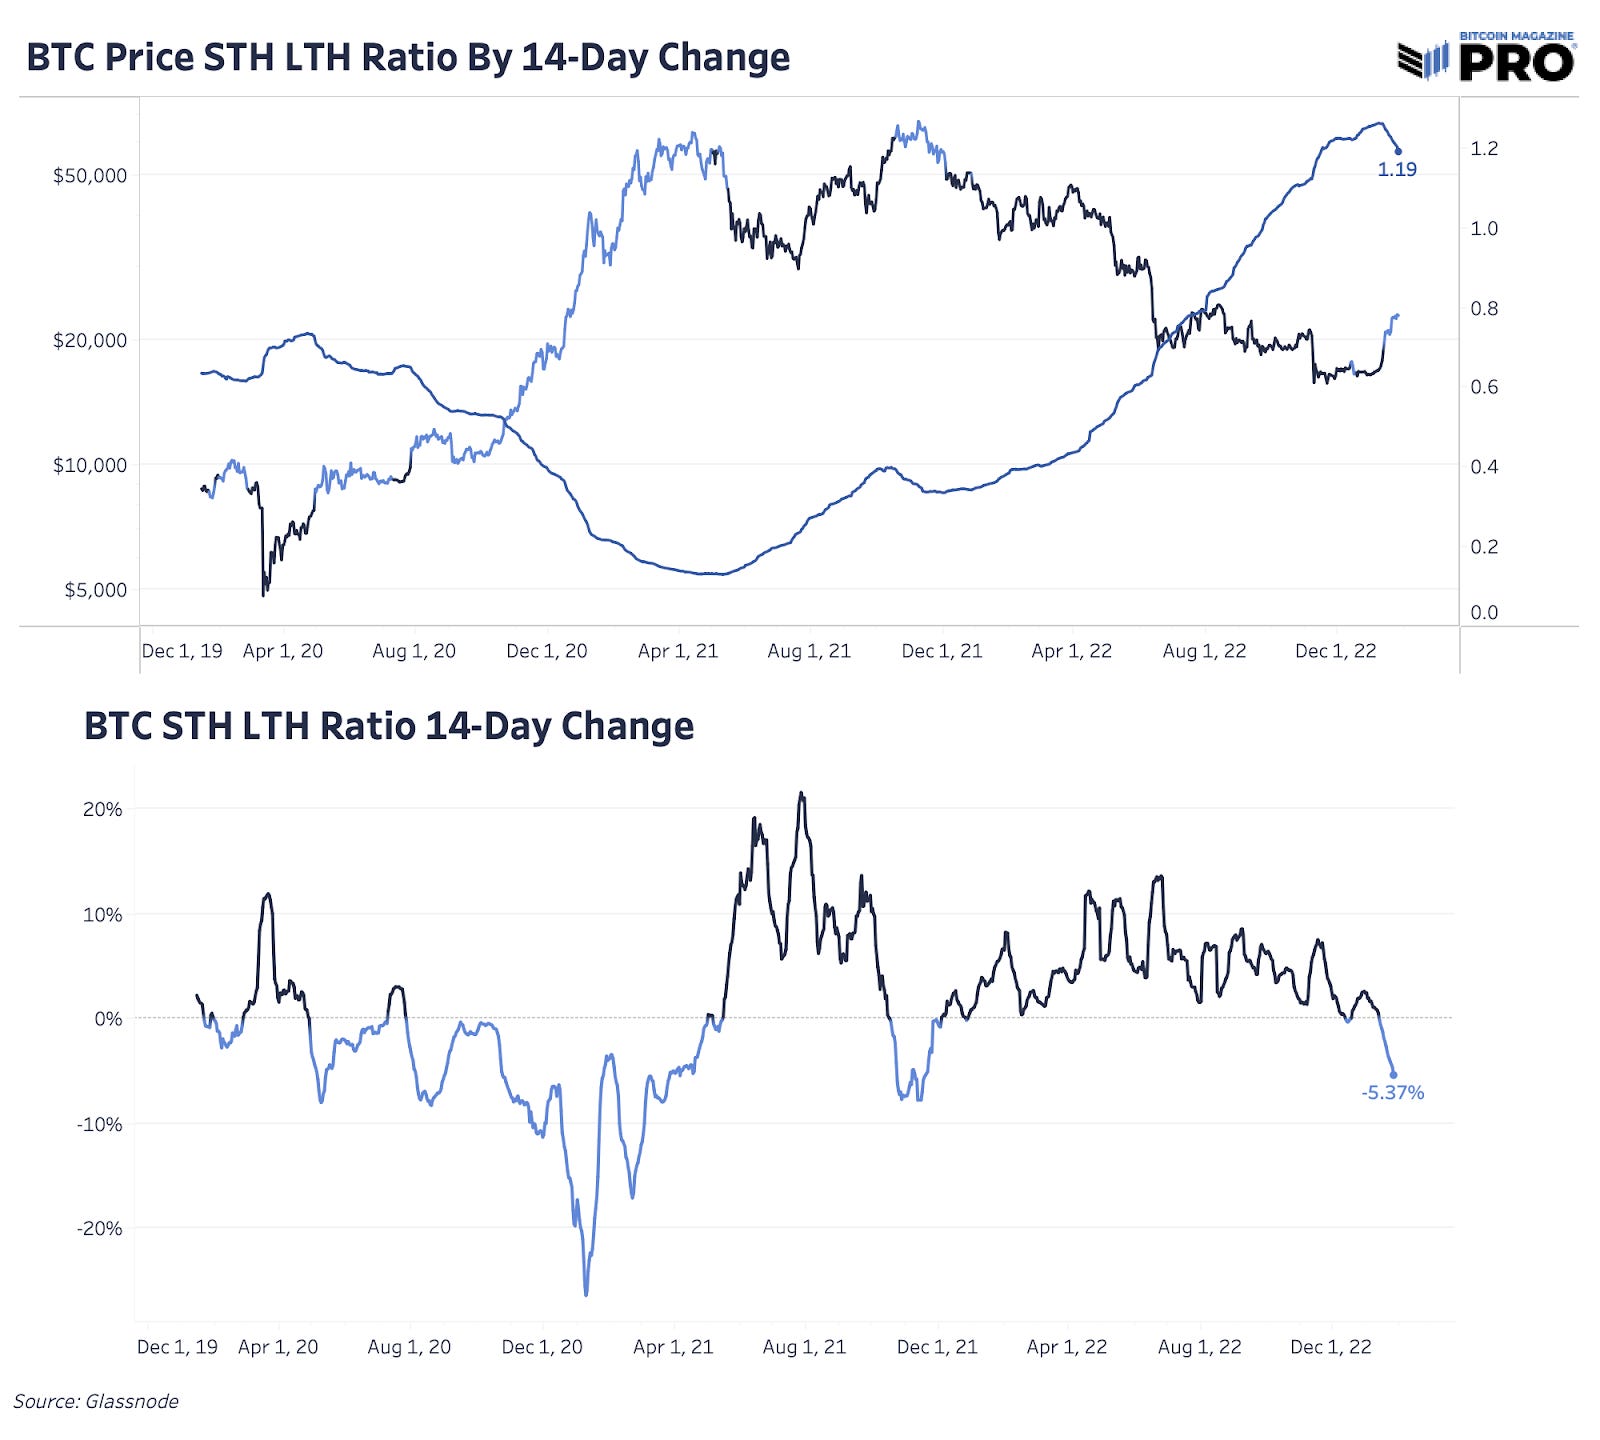
Our LTH:STH ratio indicator has decisively flipped bullish.
Something that could change this dynamic would be a large shift in LTH accumulation dynamics. Only a massive risk-off event in legacy markets could serve as a likely catalyst.


Statistically, long-term bitcoin holders are usually unfazed in the face of bitcoin price volatility. The data shows a healthy amount of accumulation throughout 2022, despite a massive risk-off event in both the bitcoin and legacy market.
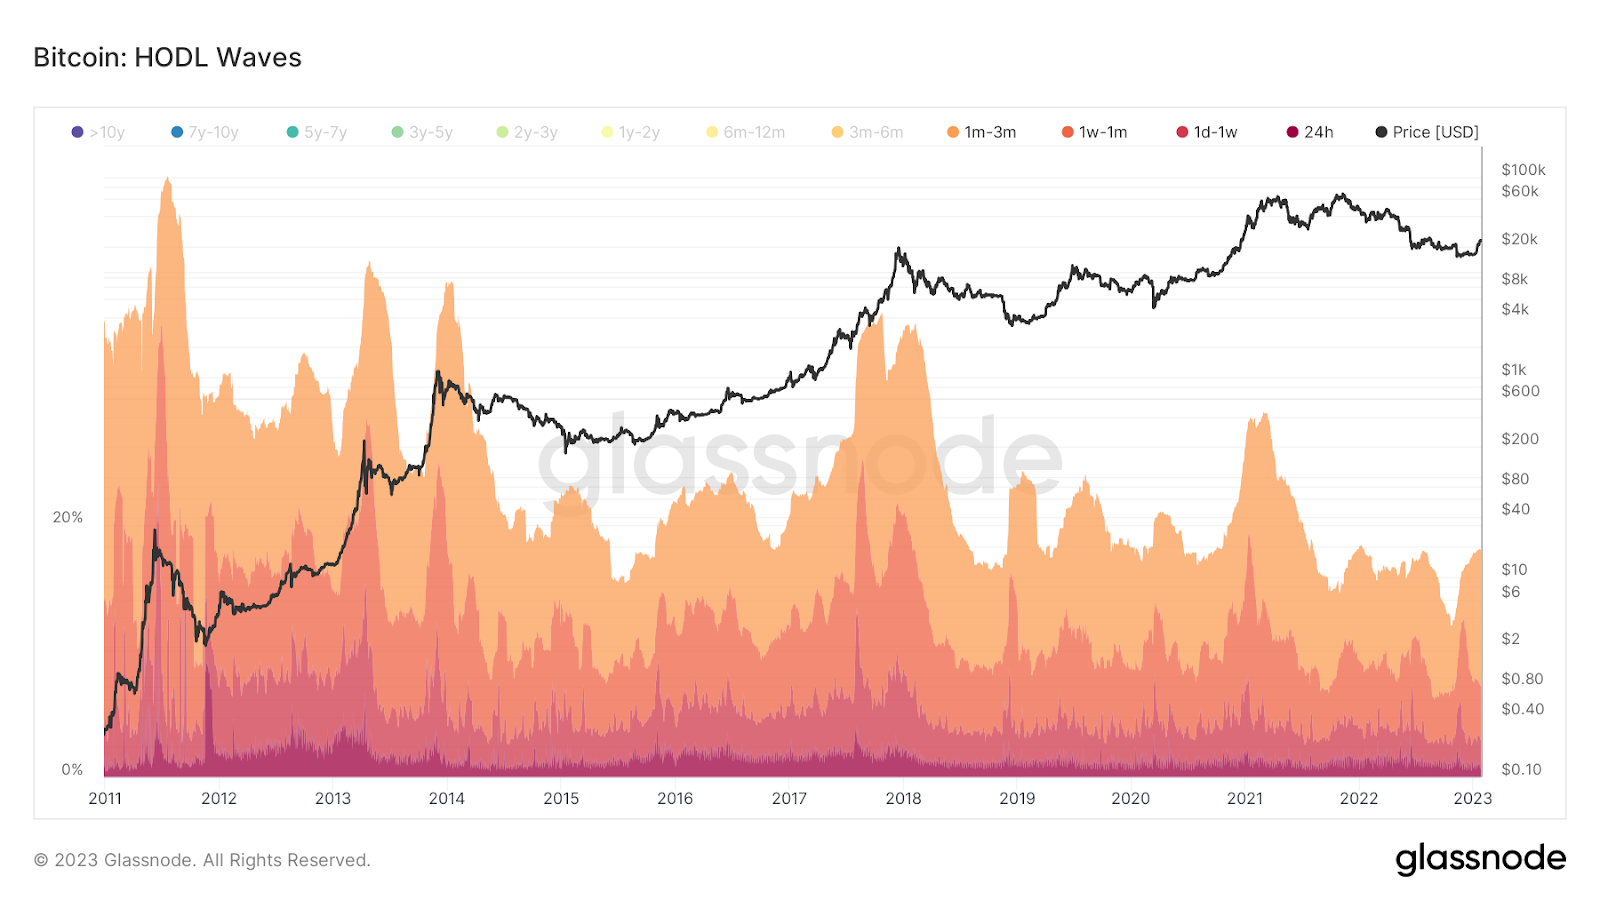
Finally, if we look at Realized Market Cap HODL Waves, we can gain insight into the current makeup of the market’s holders by economic weight.
To explain, the traditional HODL Waves metric is a basic indicator showing how long coins have been held. For instance, the chart below shows coins held for at least six months is nearing an all-time high with 77.91% of the circulating supply being dormant for at least six months.

Realized Cap HODL Waves takes this same approach, while also taking into account the value when each of these coins last moved. Taking a look at the Realized Cap HODL Waves, we can see that coins moved over the last six months account for an all-time low reading as a percentage of bitcoin’s realized market cap. This means that the current float of bitcoin exchanging hands over the last six months has never been more constrained relative to the aggregate economic value of the network — as measured by the realized market cap. We find this to be extremely noteworthy, and bullish.
In particular, looking at the Realized Cap HODL Waves near market tops for coins six months and younger displays why the market eventually reaches a tipping point: A disproportionate amount of the true economic value on the network had moved in recent months.
A visual comparison between the Realized Cap HODL Waves and the traditional HODL Waves metric for the same age bands can tell a better story than words.

Key Takeaways
In 2022, bitcoin experienced a historic capitulation event, with catastrophic leveraged blowups destroying the asset’s exchange rate. Now, bitcoin’s supply-side dynamics look extremely primed for its next appreciation phase. Capitulation has occurred, and price agnostic accumulators of the asset class have been filling their bags while panicked and/or leveraged players sold.
While liquidity dynamics in legacy markets should be noted, the supply-side dynamics for bitcoin look to be as strong as ever. All it will take for a significant price appreciation will be a small influx of newfound demand.
Macroeconomic headwinds are likely to remain, but we think it is likely that the worst is over in regards to bitcoin. In related news, check out the recent market performance update from Goldman Sachs.

Thank you for reading Bitcoin Magazine Pro, we sincerely appreciate your support! Please consider leaving a like and letting us know your thoughts in the comments section. As well, sharing goes a long way toward helping us reach a wider audience!