


Bitcoin Rips To $21,000, Shorts Demolished In Biggest Squeeze Since 2021
Bulls take charge with massive upward momentum in the bitcoin price. We analyze key price levels to watch to determine whether this is another bear market rally or a move with actual lasting power.


Relevant Articles:
Key Levels For The Bitcoin Price

One of the most useful models in tracking the cyclical tops for both the S&P 500 Index and bitcoin since March 2020 has proven to be net liquidity, an original model by 42 Macro. Net liquidity tracks the changes in Federal Reserve total assets, the U.S. Treasury general account balance and the reverse repo facility. A lower net liquidity translates to less capital available to deploy in markets. We find it useful as a key macro indicator to assess current liquidity conditions and how bitcoin trades in the market.
Bitcoin has acted as a liquidity sponge throughout its life and contracting liquidity in all markets has had a significant impact on the bitcoin price and trajectory. Ultimately, that’s one of the main drivers of our core long-term thesis that bitcoin’s growth depends on an environment of perpetual monetary debasement and expanding liquidity to work against current levels of unsustainable sovereign debt and deflationary forces. In the short-term, it’s not clear when overall liquidity will increase again en masse. That’s the trillion dollar question and the topic of conversation on which everyone is speculating. Net liquidity provides a view into that trajectory as a measure that’s updated weekly with fresh data.
Bitcoin is seeing some of its largest relative strength since January 2021, but it also comes at a time when we’re seeing a significant daily uptick in net liquidity after a period of historically low volatility. The uptick is driven by a much lower reverse repo balance since the start of the year. With the Fed’s position of “higher for longer,” a projected view of Core CPI at 3.5% for 2023 and continued balance sheet runoff, we will likely see net liquidity decline — barring a spontaneous or emergency policy reversal.

Below is a list of key price levels worth watching as we wait to see how the market responds to bitcoin’s strength over the last few days. Price is now above both the 50- and 100-day moving averages and just a touch below the 200-day moving average. Sitting right above the 200-day moving average is both the on-chain realized price of $19,700 and the 2017 cycle top. These are key levels to watch over the coming weeks to see if we have continued momentum or rejection at that price.
The following is an excerpt from our new Bitcoin Magazine PRO Market Dashboard that we plan to release to paid subscribers sometime this month. Apart from the Mayer Multiple, status signals here compare the current price versus key price levels as a simple sign of bearish or bullish momentum. By upgrading to being a paid subscriber, you will get first and exclusive access to our new Markets Dashboard upon release.

Price has broken above the short-term holder realized price. That’s happened only a few times in this bear market and these events were short-lived. As this price reflects the average on-chain cost basis of the more recent buyers, it will be key to see if these market participants are looking to sell here at cost or if they will stay to continue with the momentum.


The rest of this article is open to paying members only. Here’s what’s behind the paywall 🔏:
Bitcoin’s relative strength and Mayer Multiple data.
Analysis of bitcoin’s delta skew for the options market.
A closer look at seller exhaustion levels.
Bitcoin Magazine PRO is on Seeking Alpha! Please consider giving us a follow.

On a much longer time period of a depressed and stagnating bitcoin price, the Mayer Multiple is in its 37th percentile after spending close to the second half of 2022 below the 10th percentile. To reach these low levels again, we would have to see bitcoin revisit $10,000 and below.

Bitcoin’s relative strength and recent upside momentum is encouraging. With firm support at the $16,000 and $18,000 levels, it’s up to the bulls to continue pressing the price upward from here and keep this recent strength from becoming yet another bear market rally that fades into the start of a new trend.

While the 200-day moving average may seem somewhat arbitrary, the mere fact that many technical traders and momentum- and trend-based investors monitor this level gives it significance. A clean break above could mean continued strength for bitcoin in the coming days and weeks ahead.

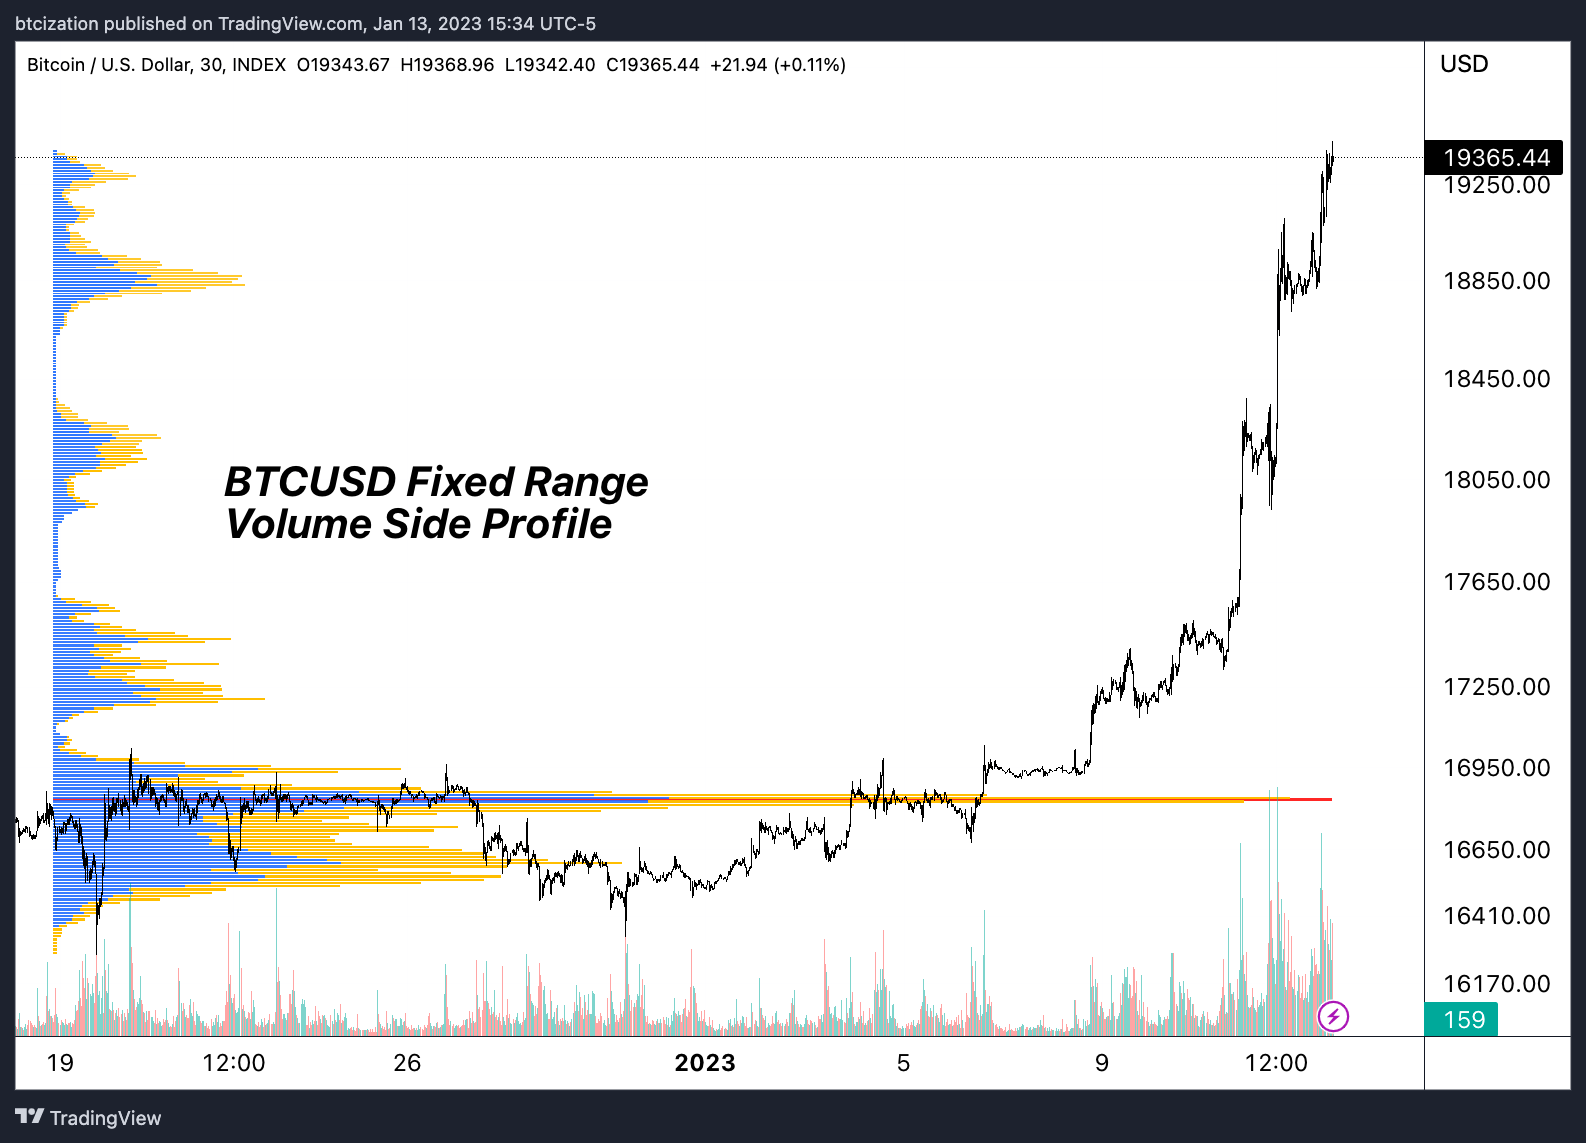
The velocity of the recent upward move has been very mechanical in nature. By mechanical, we mean that the basis for the move has not been new money flooding into the market, but rather traders and speculators who had to cover their short position as this relatively illiquid market moved higher.
Over the last 24 hours, the market has seen the largest amount of short liquidations across futures platforms since July 2021, where price rapidly reversed from the $30,000 level on the back of forcefully closed, dollar-collateralized short positions.

Market conditions are quite different today, i.e., macro conditions, Alameda/3AC no longer dominant players, relative size of the on-chain capitulation in recent months, etc. The price action to start the new year has been quite the promising sign for bitcoin bulls. Similarly, over the last week, shorts as a percentage of futures liquidations has reached its highest level in the history of the data. Boom!

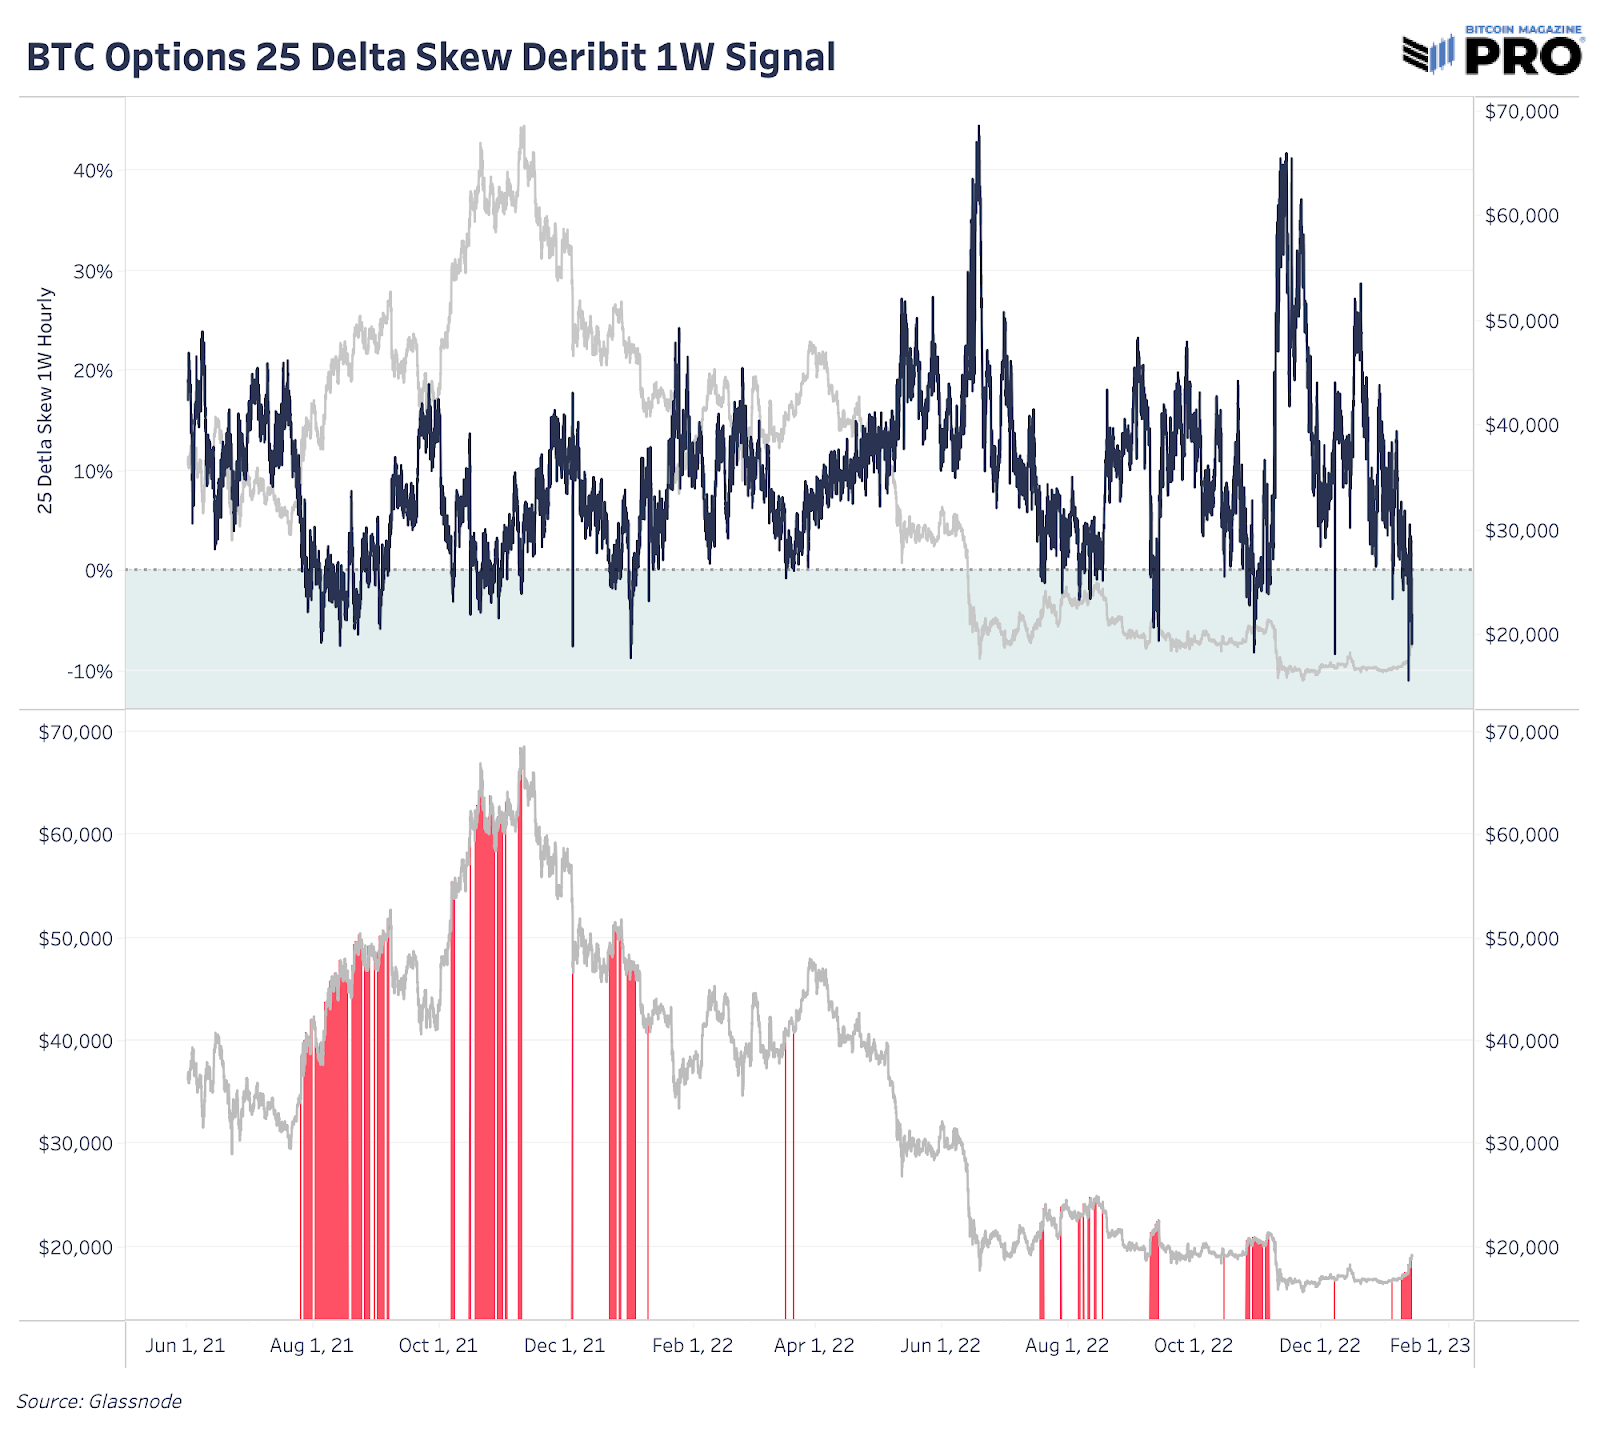
While shorts have been decimated as of late, there are some near-term signs that this immediate upside could be capped, as the rally has brought about the return of speculation in the options market with premiums evaporating for puts dated one week and one month in the future.

In simple terms, the delta skew shows the market’s demand for puts relative to calls. High levels of skew show a large demand for protection in the form of puts, and a negative reading shows a lack of demand for puts, with traders instead reaching for upside exposure in the form of call options.
“Skew is the relative richness of put vs call options, expressed in terms of Implied Volatility (IV). For options with a specific expiry, 25 Delta Skew refers to puts with a delta of -25% and calls with a delta of 25% to demonstrate this difference in the market’s perception of implied volatility. 25 Delta Skew is calculated as the difference between a 25-delta put’s implied volatility and a 25-delta call’s implied volatility, normalized by the ATM Implied Volatility.” — Glassnode Documentation
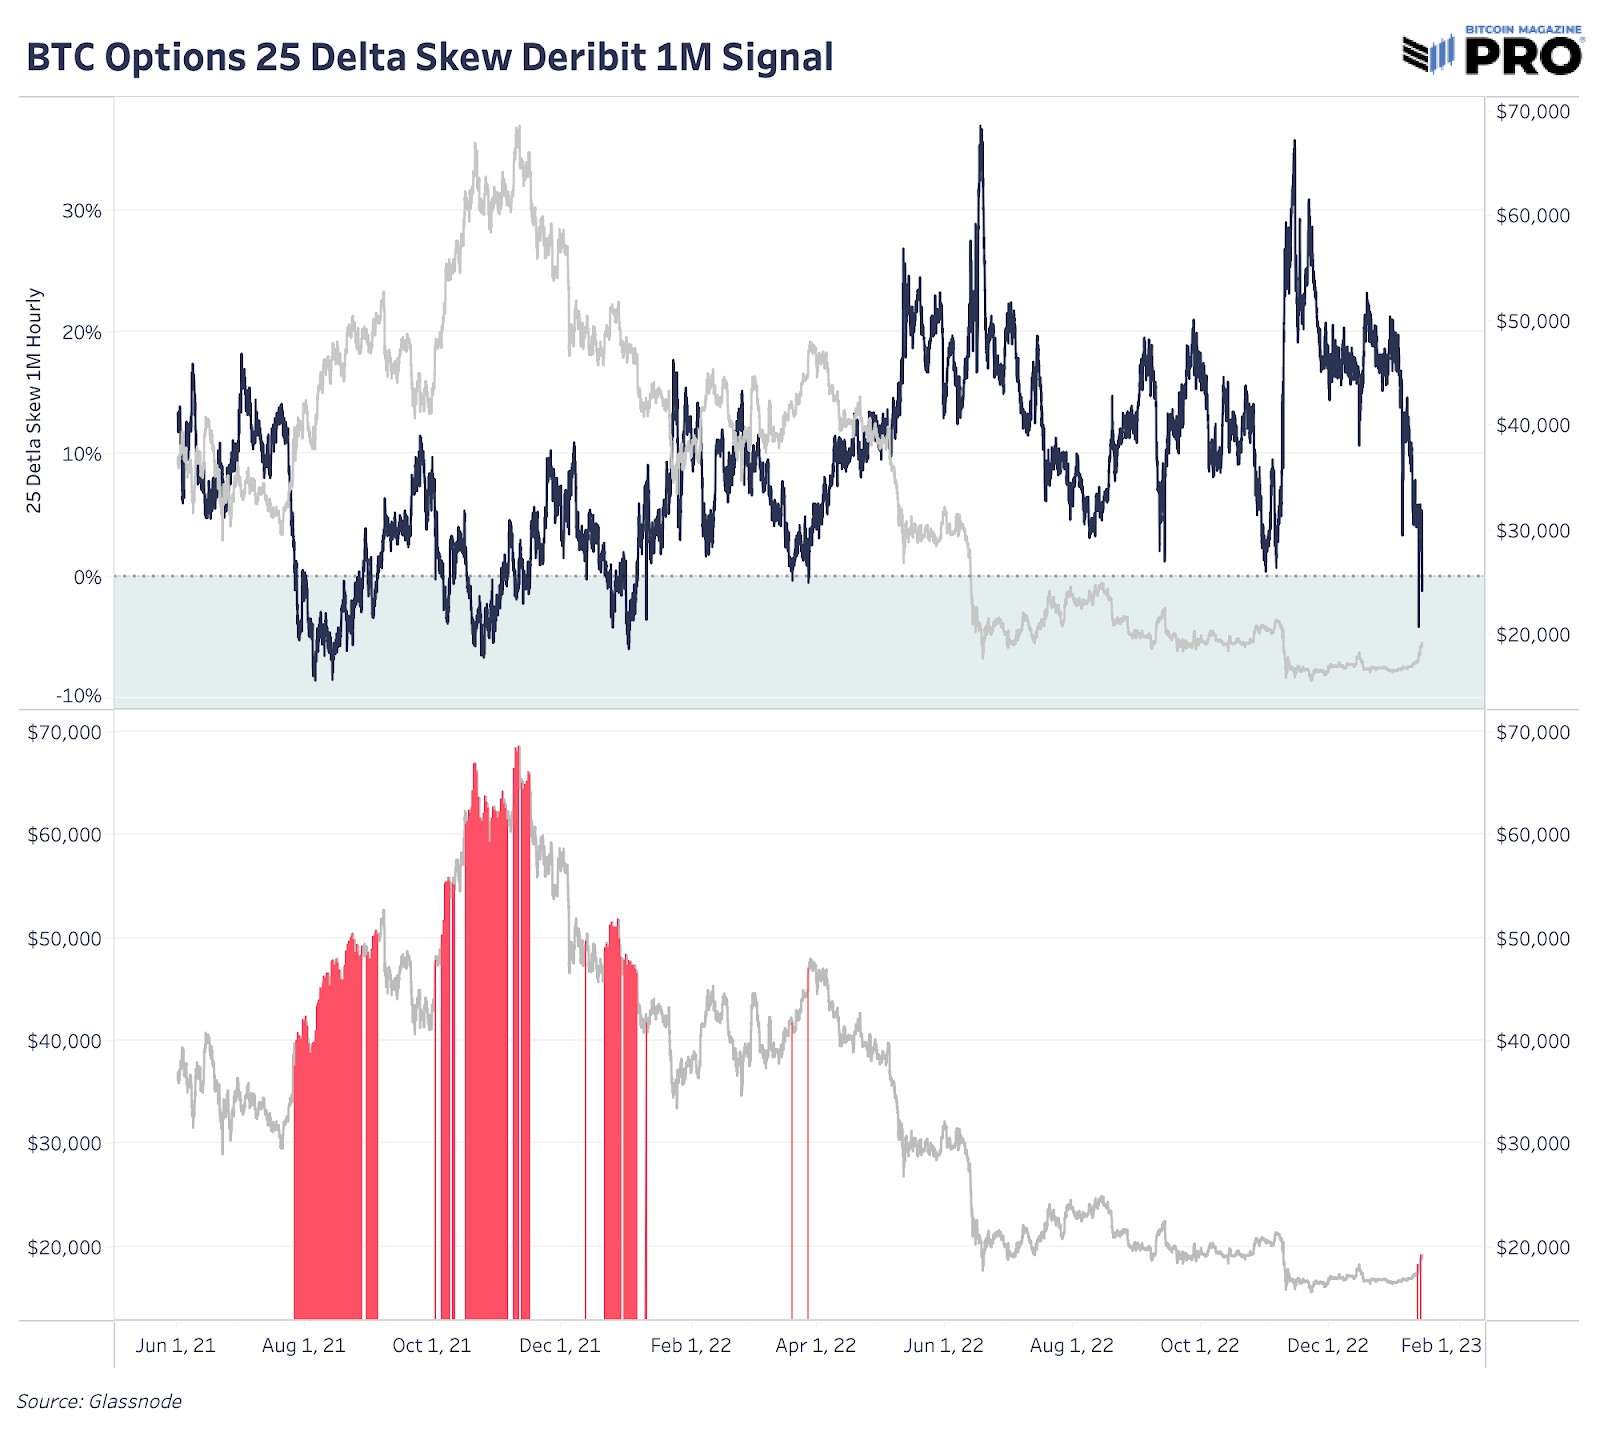
Conversely, here is a look at when puts garnered a significant premium relative to calls for one-month bitcoin options over the previous years.
Given the nature of the move to the upside to start the year, along with the broader moves in global equity, currency and volatility markets — stocks up, dollar down, lower levels of implied volatility — a macro reversal could see bitcoin give back recent gains due to futures markets and general market illiquidity driving much of this current move.
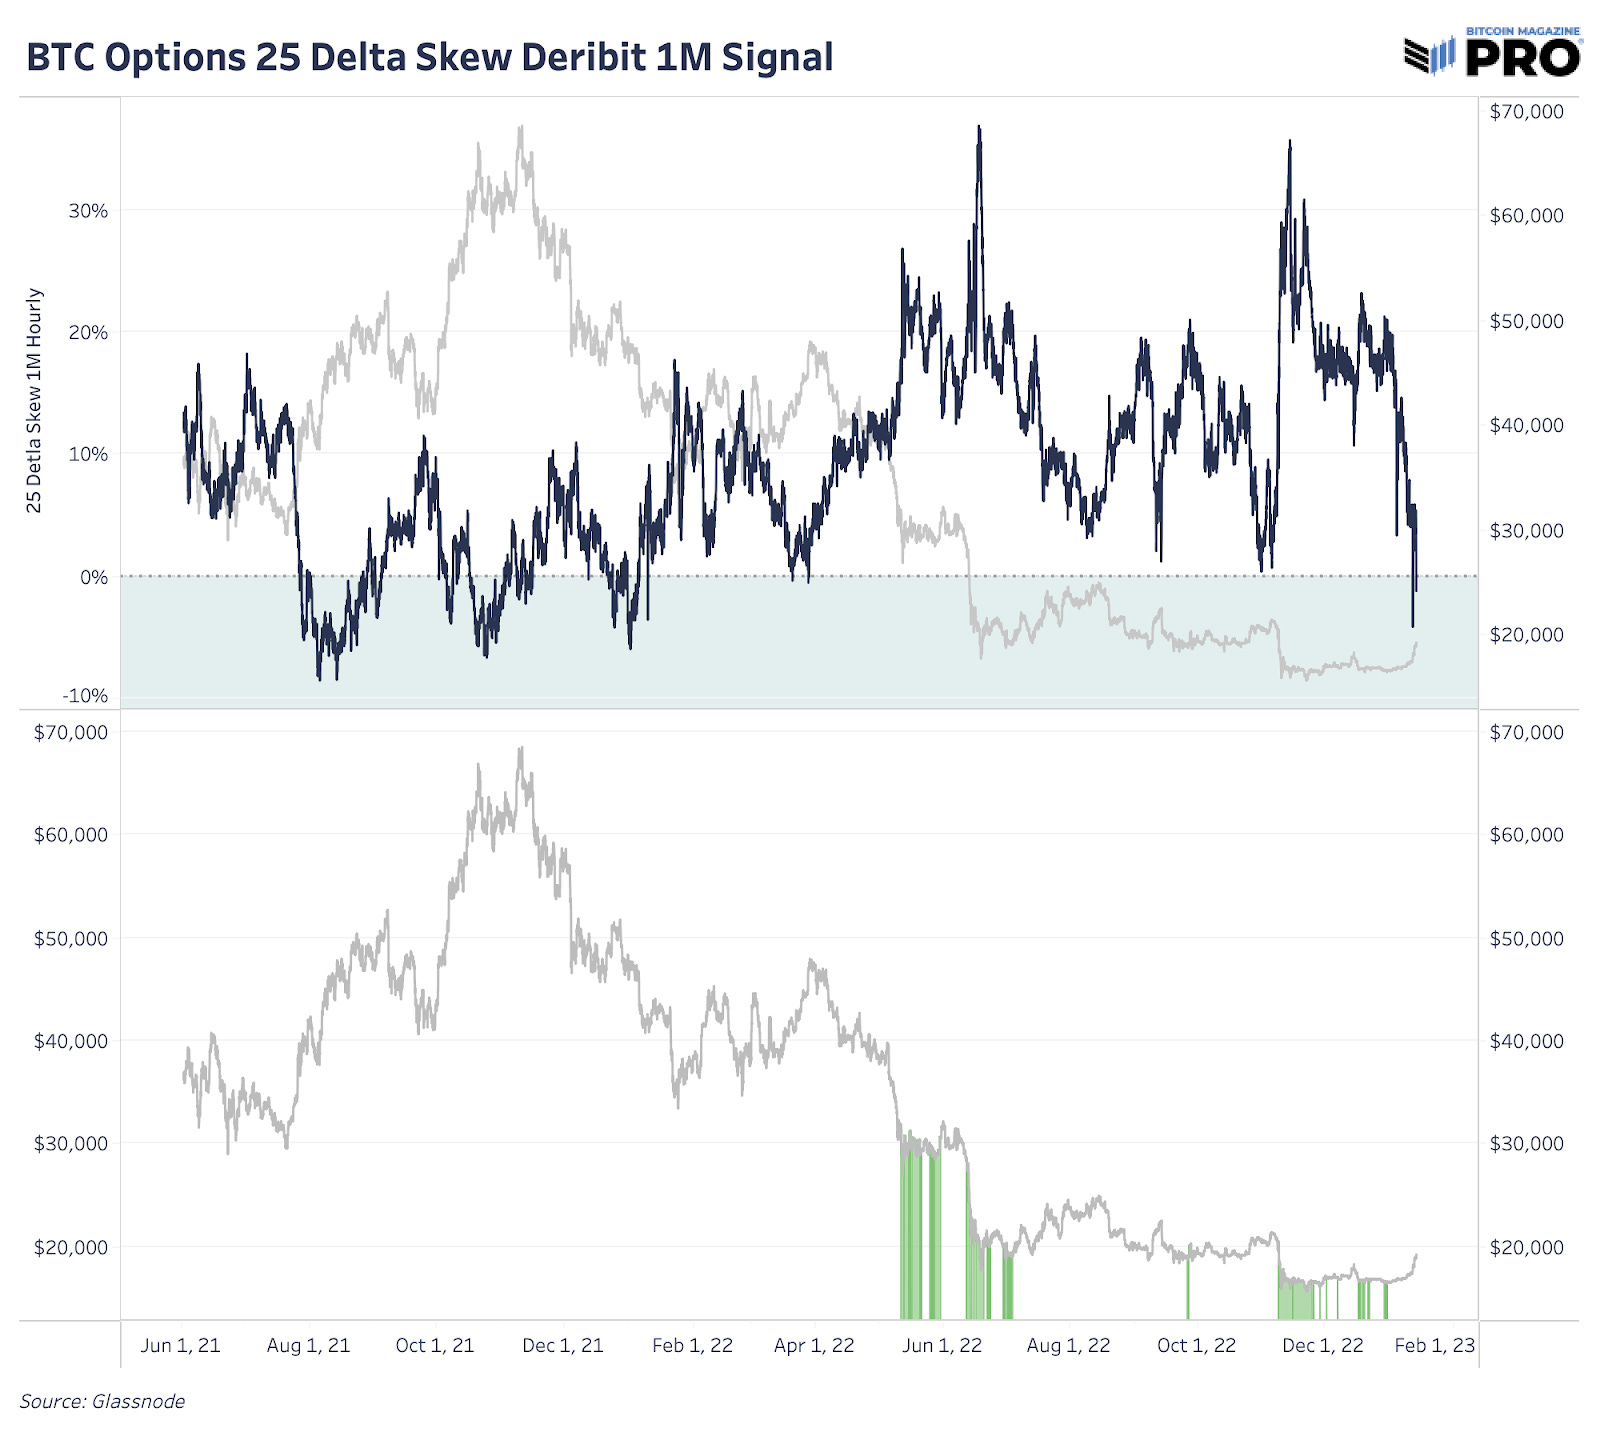
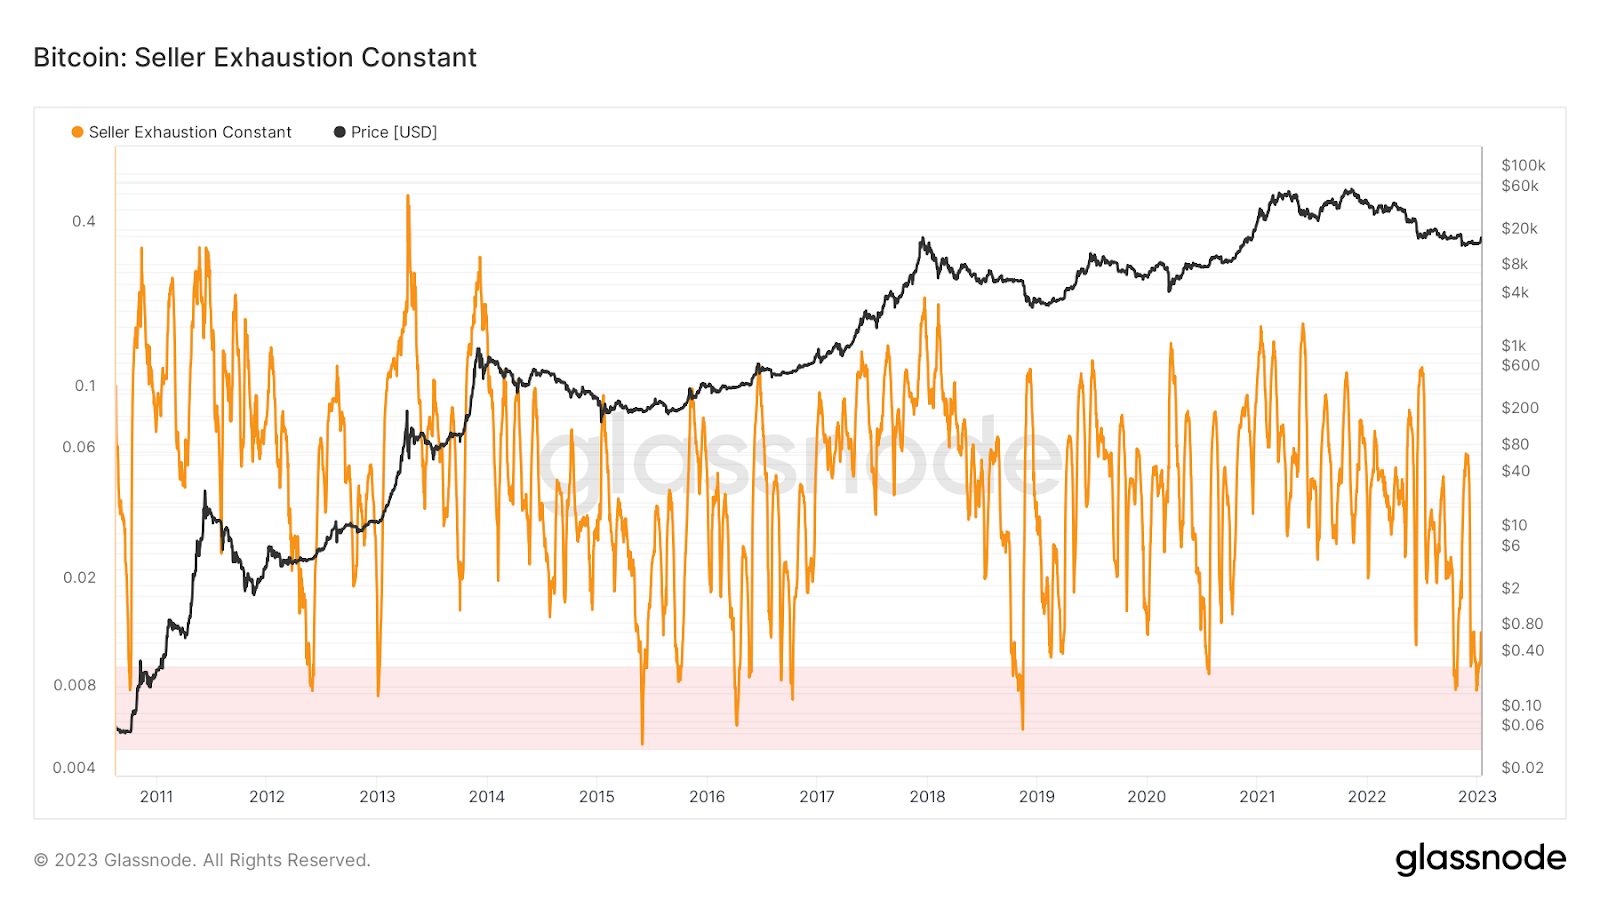
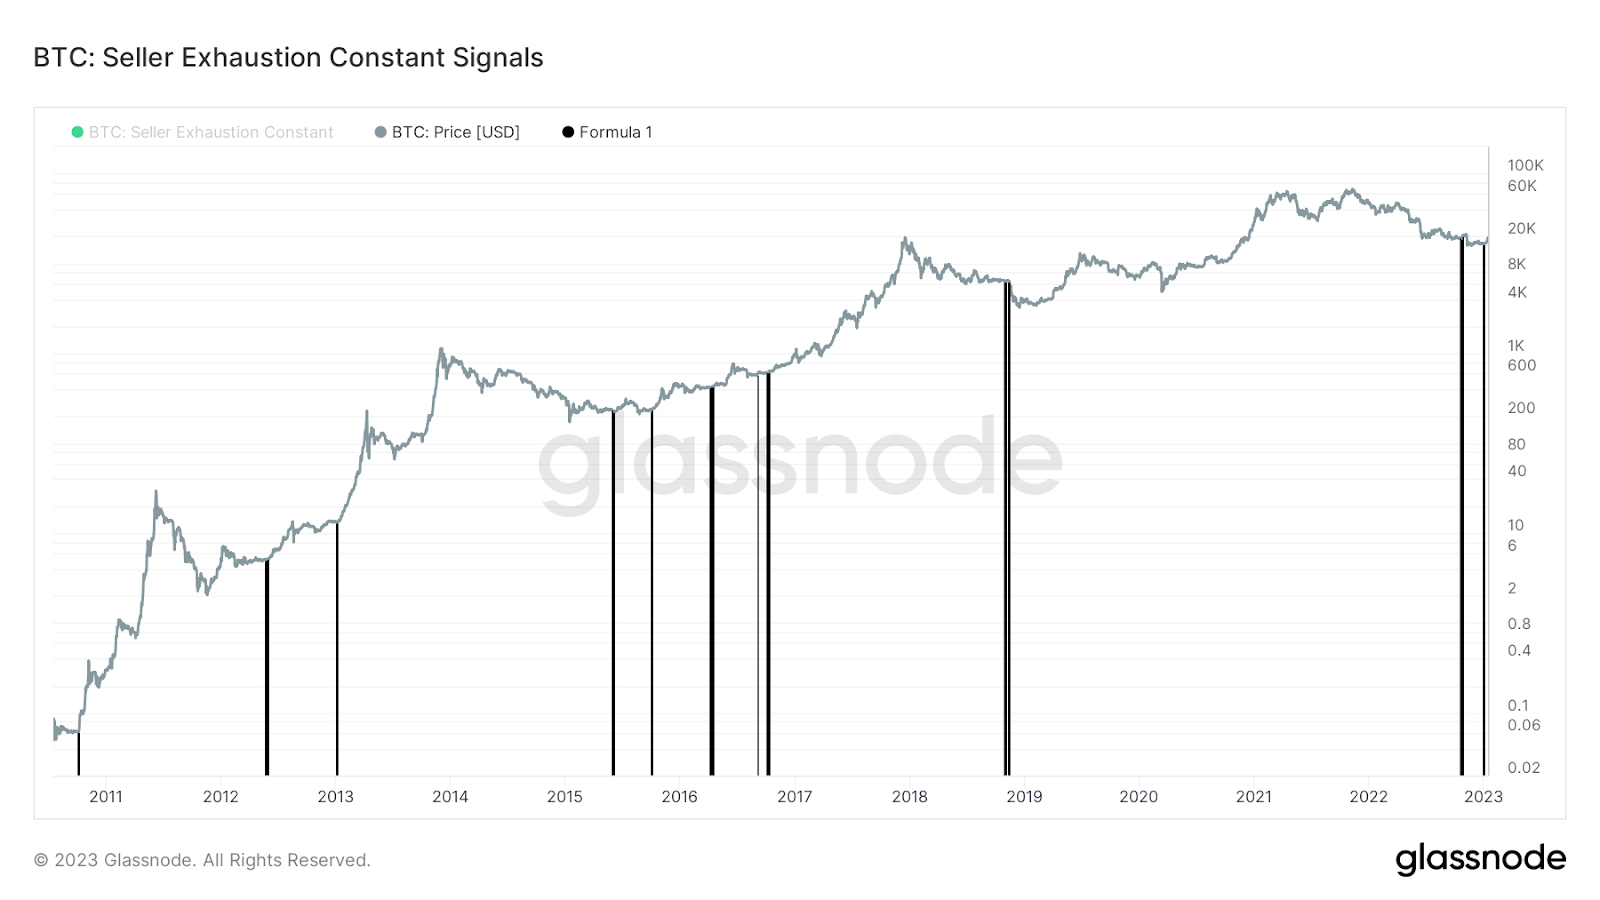
However, as highlighted in our January 4 release, “Time-Based Capitulation: Bitcoin Volatility Hits Historic Lows Amid Market Apathy,” when zooming out much further, broad-based exhaustion was seen on-chain with the combination of lack of volatility and on-chain profitability flashing quite the strong signal to market participants.
“Seller Exhaustion Constant is defined as the product of the Percentage Supply in Profit and 30-day price volatility. It detects when two factors co-align: low volatility and high losses, or, in other words, low risk bottoms.” — Glassnode Documentation
While there is a long way to go in terms of surpassing previous bull market heights, the year-to-date performance has been hopeful following a year where the industry practically imploded.
Overall, this is a promising start to 2023.
Thank you for reading Bitcoin Magazine Pro, we sincerely appreciate your support! Please consider leaving a like and letting us know your thoughts in the comments section. As well, sharing goes a long way toward helping us reach a wider audience!
Good job once again for the analysis from both of you.
Keep it coming Dylan and Sam.
Stay humble and stack Satoshis
What is meant by the “repo market” in lay terms? Thanks!