


The Fuel For Next Bull Run
Bitcoin has faced significant macro headwinds, and while they will likely continue, it is worth looking at a number of on-chain factors that may indicate when the bitcoin market could shift.


Relevant Past Articles:
Revisiting Our Base Case

As readers know, our base case has been a bearish one for the bitcoin price throughout this year. That doesn’t change our long-term views on where we see bitcoin (and Bitcoin) going over the next decade, but price does matter to many today.
Our conviction is that we face significant headwinds as long as the macro environment is this terrible. With that being said, we’re always looking for reasons to test that conviction and even change our bias based on new data and developments.
Today, we want to highlight many of the cyclical bottom and top metrics that we’ve analyzed before. Many do make the case that a bitcoin bottom might be in. Overall, we think these conflict with much more important macro trends that are still unfolding. We may be wrong in our views, and over time the market will provide us with the answer. Over the last couple of days, bitcoin has shown some resilience relative to equities with a strong support and interest level at $20,000. It’s that time again in the bear market for active participants to gauge if this is a new breakout trend or a delayed reversal coming as equities continue selling off heavily (at the time of writing).
In an overview of key on-chain cyclical indicators, nearly every metric used to gauge overheated and overcooked market conditions are in some of the lowest historical percentiles we’ve seen compared to previous cycles. In the below chart, there’s a short list of these key on-chain metrics which we highlight more in this analysis: Can On-Chain Indicators Call Tops And Bottoms?

Bitcoin’s realized price hovers just below the realized price of nearly $21,100. It’s no coincidence that this metric has acted as a major support for the bitcoin price over time and also as the short-term resistance bitcoin has been looking to break out of this week.
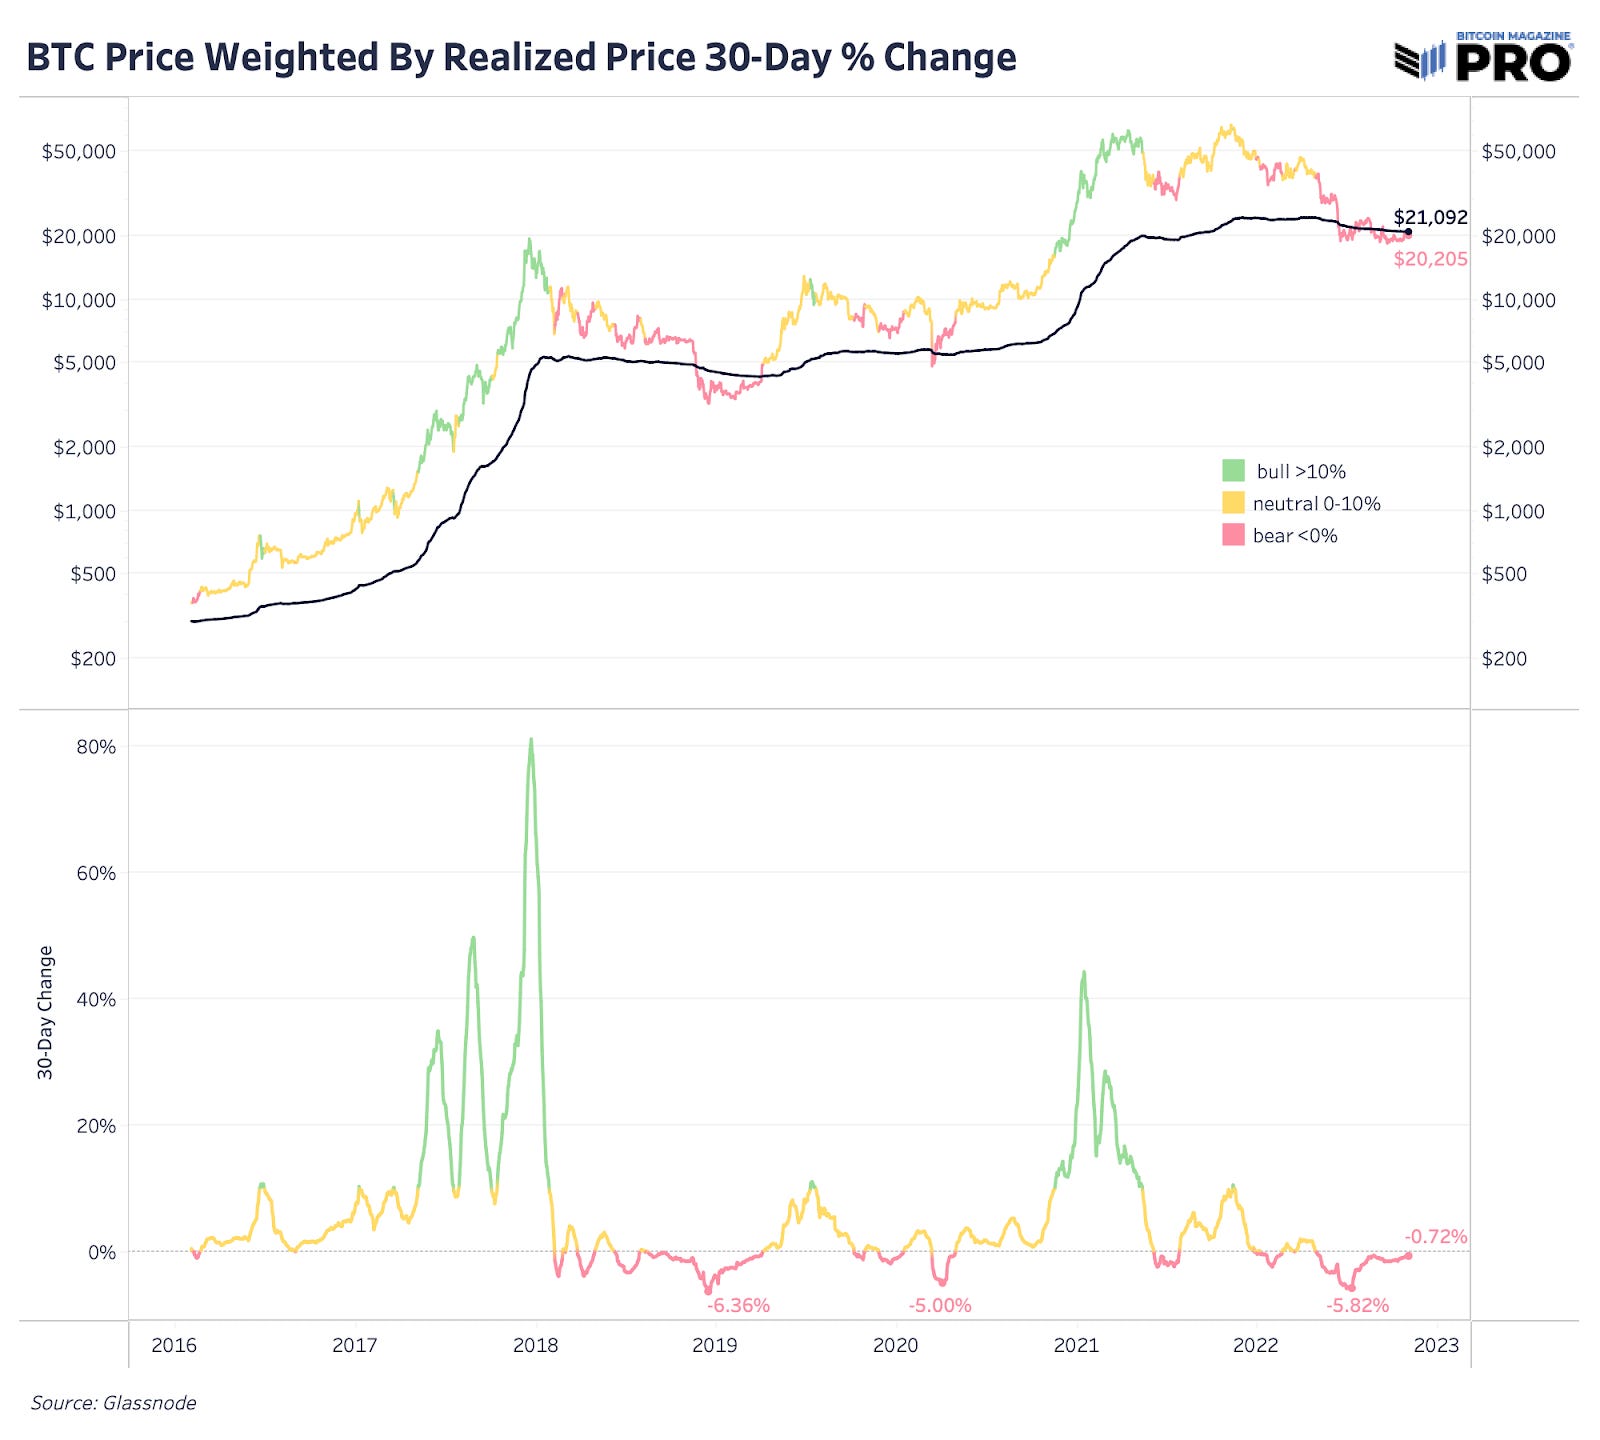
One thing that has been positive about realized price is that, looking at the 30-day percentage change, we’re far beyond a deep decline phase in realized price. Simply put, when realized price is trending down, that’s capital outflows we can see on-chain. Said even more simply, the average price of all bitcoin holders (as viewed by the bitcoin UTXO set) is still declining, but declining at a less aggressive pace than it was previously. When we see realized price climbing at a rapid pace, those periods show capital inflows to bitcoin and buyers coming in. We’re still in a period of seeing realized price fall over the last 30 days but it’s nowhere near the decline we saw back in the June and July contagion event.
Set a reminder to listen in to our upcoming Bitcoin Magazine PRO Twitter Spaces with special guest Joe Consorti of The Bitcoin Layer. LIVE Monday 11/7 at 1:00 pm PT.

A deeper look at the Market Value To Realized Value Ratio (MVRV) shows us that bitcoin’s price has been suppressed below the realized price for some time. On one hand, this is a major allocation signal for long-term buyers. On the other hand, the few cycles we know of show us that this dynamic can last for quite some time. See 2015-2016 as an example of how long that dynamic played out.

Throughout the history of bitcoin, there have only been 710 days where the market price was below the realized price (average cost basis of all bitcoin visible on-chain).

Dialing in more specifically on the short-term holder cohort, we can gain some insight into the cyclical dynamic of accumulation and distribution through the bull and bear market cycles. Shown below is when short-term holders are in profit (green) or loss (red).


To read more on the classification of short-term and long-term holders, read here.
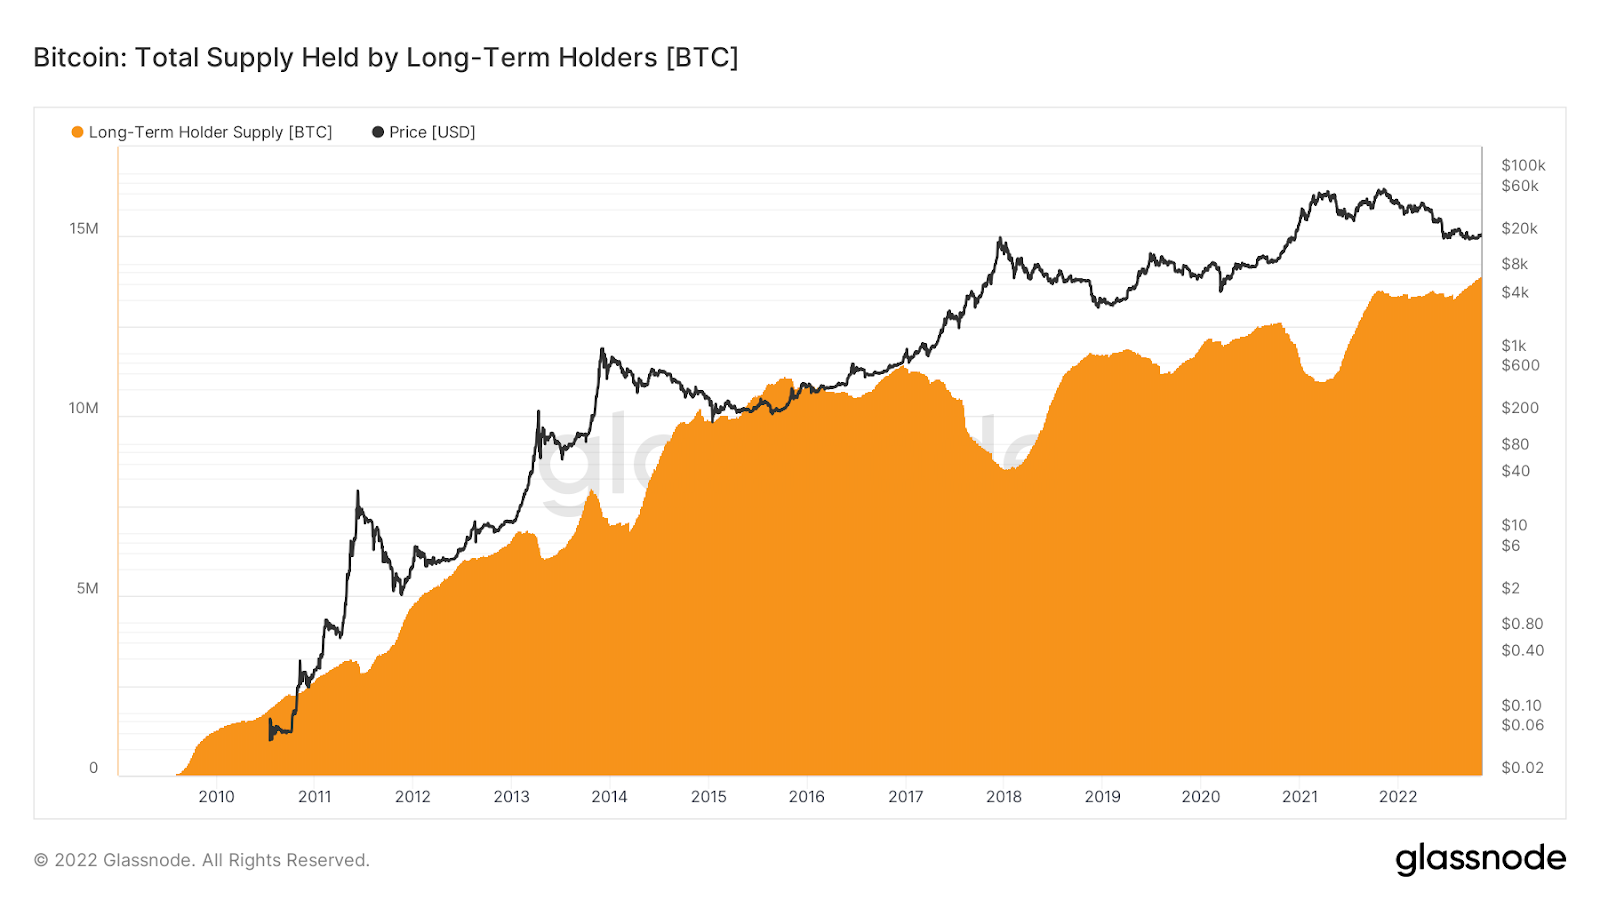
While short-term holders are on average still underwater, the long-term holder cohort is larger than ever, as the price-agnostic accumulation of the circulating supply by convicted holders continues.
While price is still set at the margin, which will continue to be dominated by macroeconomic developments and the global liquidity tide, the price eventually rises as the marginal seller becomes exhausted. It’s supply versus demand over the long term, and the data clearly shows price-agnostic accumulation is taking place.
Another tool we have to evaluate HODLing tendencies is Reserve Risk, a favorite of ours to monitor the bitcoin native risk/reward of an allocation based on aggregate HODLing tendencies.
We explained this metric in depth here: Reserve Risk Overview.
The following is an excerpt from Glassnode Insights,
The general principles that underpin Reserve Risk are as follows:
Every coin that is not spent accumulates coin-days which quantify how long it has been dormant. This is good tool for measuring the conviction of strong hand HODLers.
As price increases, the incentive to sell and realize these profits also increases. As a result, we typically see HODLers spending their coins as bull markets progress.
Stronger hands will resist the temptation to sell and this collective action builds up an “opportunity cost.” Everyday HODLers actively decide NOT to sell increases the cumulative unspent “opportunity cost” (called the HODL bank).
Reserve Risk takes the ratio between the current price (incentive to sell) and this cumulative “opportunity cost” (HODL bank). In other words, Reserve Risk compares the incentive to sell, to the strength of HODLers who have resisted the temptation.
In our own terms, Reserve Risk is low when HODLer conviction is high (unspent opportunity cost is high and increasing), and price is low. Conversely, Reserve Risk is high when HODLer conviction is low (unspent opportunity cost is low) and price is high.
So where are we today?
The lowest readings in bitcoin history.

To those with zero bitcoin allocation reading this today, as defined by Reserve Risk, there has never been a more asymmetric time to allocate to bitcoin relative to HODLer dynamics than today. Supply is extremely tight, it’s just a matter of how much tighter it can get relative to the current/future demand.
Yes, the macro dynamics seem to influence all short-term market movements, but we are aiming to quantify long-term, supply-based trends. In that regard, price has never been this low relative to HODLer conviction.
We’ll finish off today’s piece with one of the most basic on-chain metrics, but one that is extremely telling as to the reality of the price-agnostic accumulation taking place. We like to say that the supply inelasticity of bitcoin cuts both ways. In bull markets, due the tightly held free float, any significant amount of capital sends the market soaring. Likewise, when the marginal seller is aggressively unloading inventory, even if 60%+ of the market is holding, the exchange rate suffers.


The story is the same as it was in early March. While the exchange rate for an absolutely scarce monetary asset is set at the margin, the lower it stays for longer, the more the spring coils when the marginal seller is finally exhausted by the marginal buyer.
While our focus over the last six months has been predominantly on the macroeconomic environment, these are exactly the conditions that prime the market for the next explosive bull run. Patience is required — we still expect choppy waters ahead — but make no mistake, bitcoin isn’t going anywhere, and those currently accumulating at these prices know it.
Thank you for reading Bitcoin Magazine Pro, we sincerely appreciate your support! Please consider leaving a like and letting us know your thoughts in the comments section. As well, sharing goes a long way toward helping us reach a wider audience!
Absolute dynamite article. Always great to get a refresher on LT signals.
tremendo articulo, con una gran visión y entendimiento del mercado