Realized Market Capitalization Trends
Today, we’re providing an in-depth breakdown of realized market capitalization. Traditional asset classes along with bitcoin itself are often quoted in terms of their market capitalization, which is calculated by finding the product of price and circulating supply. With bitcoin, and the introduction of a completely transparent set of property rights, you can calculate the realized market capitalization, which values each unit of supply at the price it was last moved across the network.


The realized market capitalization of bitcoin is one of best ways to quantify the monetization process of the asset, as the infamous volatility of the asset is seemingly only occurring to the upside. The fluctuations in the exchange rate are not nearly as volatile as the gradual-then-sudden appreciation of the realized market value of the asset.
Currently the realized cap of bitcoin is $467 billion, a mere 0.20% off of its all-time high. Despite falling by more than 50% off of the highs since November, the realized market value of bitcoin has only fallen from peak to trough by 2.62%.
A thread written in December 2021 covers this dynamic extensively, citing the patterns of realized price during bitcoin market cycles.

Among the most fascinating dynamics of the realized price/market cap metrics, when viewing them through the lense of organic capital flows, is that the realized market capitalization has increased by $19 billion since the peak of the bull market. In absolute terms this is a massive gain, given that the entire realized market cap of bitcoin was only $91 billion at the peak of the 2017 bull run, especially considering the fact that bitcoin’s market price went down since the market high six months ago.
In rate of change terms, capital inflows into the network have been somewhat muted, at just 1.59% month over month. While this is still meaningful (and shows that on a net basis capital is still flowing into the bitcoin market), it is not enough to send bitcoin past $100,000 to a multitrillion dollar asset class.
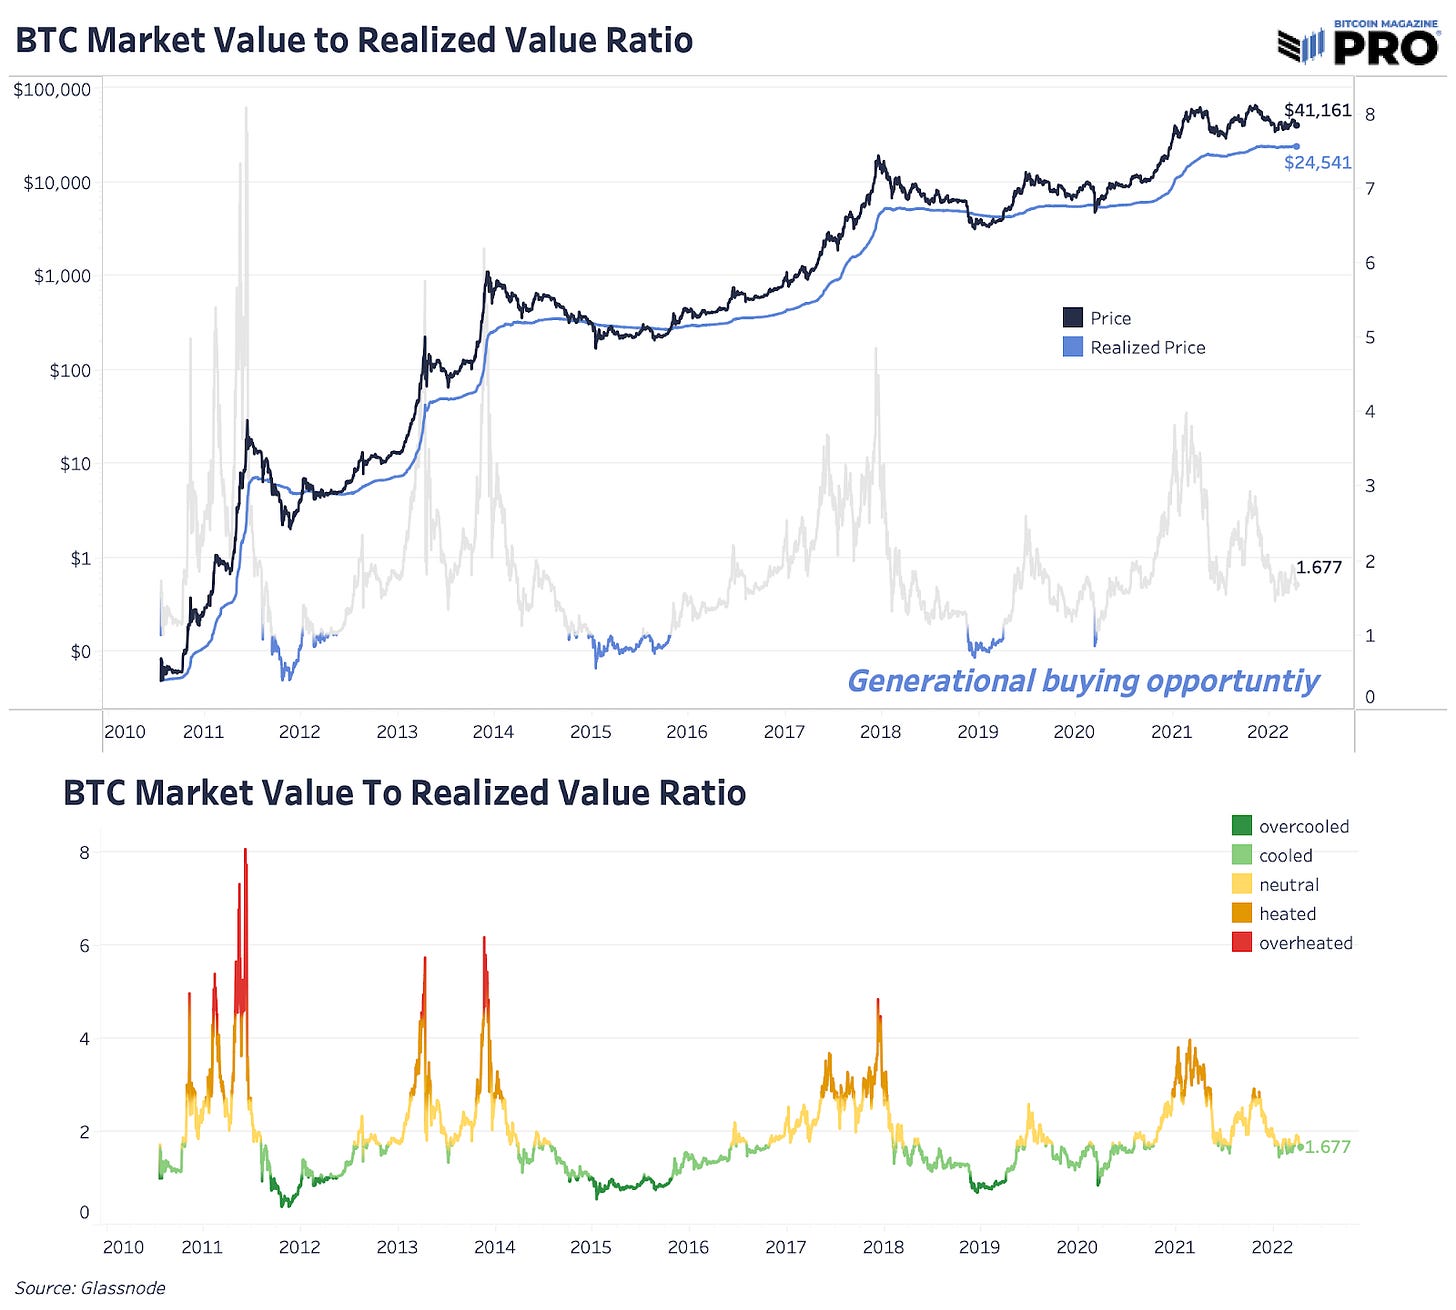
We can also look at the current MVRV (market value to realized value) ratio to view where bitcoin stands relative to historical standards. With realized price currently at $24,500, the MVRV ratio of bitcoin is 1.67.
With this ratio, the boom and bust cycles of bitcoin are clearly displayed.
The below chart shows the monthly net profit and losses, relative to market cap, being realized on the network which line up with the realized capitalization drawdowns and cycle capitulations shown above.
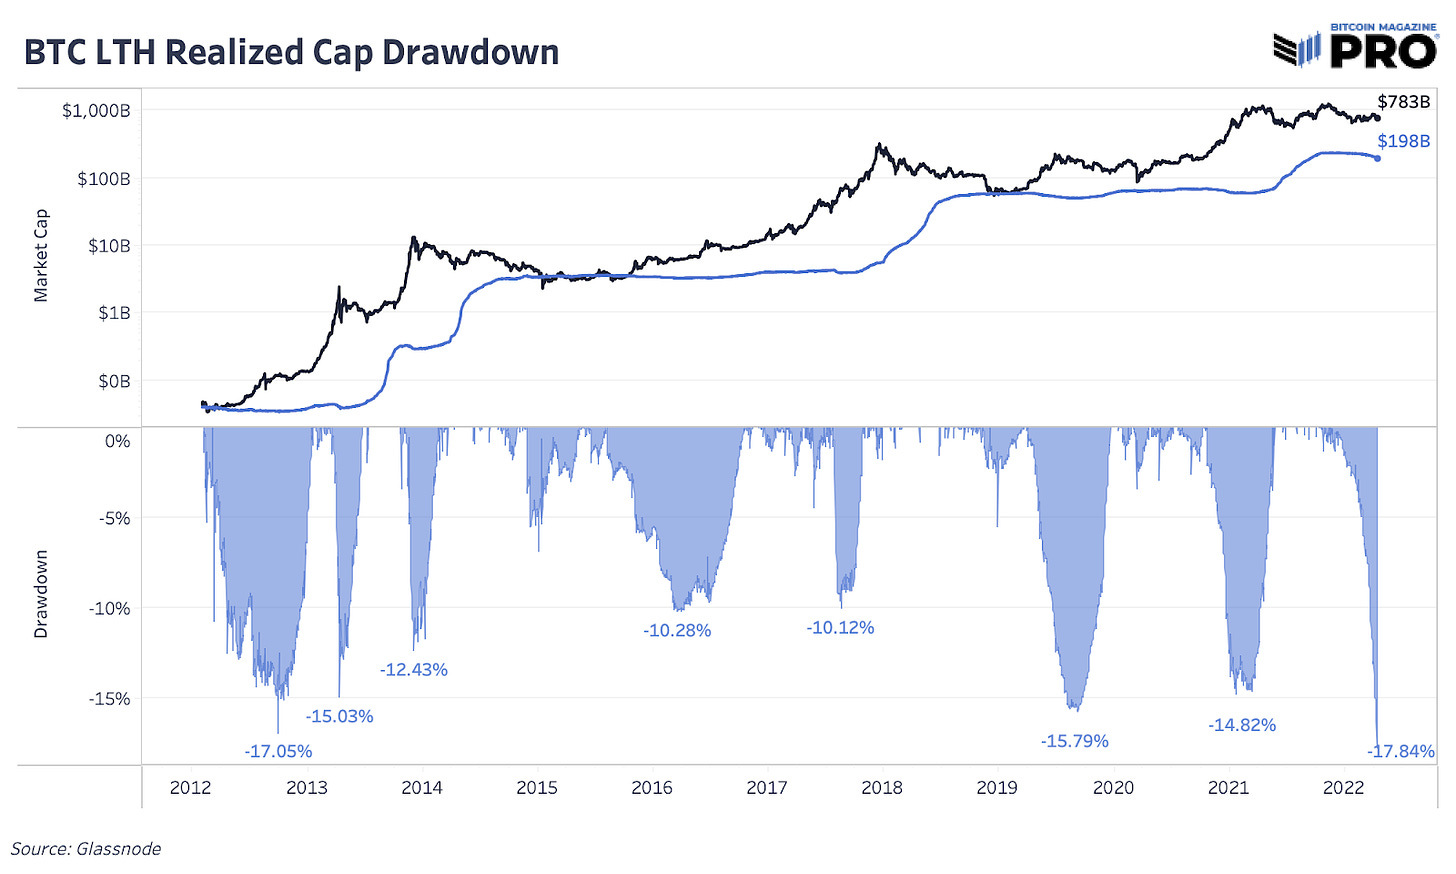
We can also break down realized capitalization into different cohorts including long- and short-term holders. Under the surface, we’re seeing the largest drawdown in long-term holder realized capitalization in bitcoin’s history.
Although long-term holder supply is fairly neutral since the start of the year, up 0.6% as accumulation and coins aging into this group continues, the data shows that there’s been plenty of selling too. Long-term holders realized capitalization and realized price falls as coins with higher cost basis are sold. This lowers the overall average cost basis which is down 11.49% over the last 30 days.
With this data and the process by which long-term holders are quantified, that class of 2021 holders that recently aged into the cohort are the ones moving their holdings.
Re-accumulation has been our base case since the start of Q1 2022, and the state of these metrics continue to support that market outlook despite the recent rise in long-term holder selling pressure.


Good one dudes. Question: doesnt that 11% downswing in LTH realized price seem significant, historically speaking? move seems more outsized than even past crypto winters ... trouble brewing in long term holder land? or are we to give this less significance given that these are 2021 newbies (now "aged" into the LTH class) that are now finally capitulating?