


Holiday Chart Pack: Powell Gives Investors Coal For Christmas
We review the current interest rate regime, slowing economy and the potential for challenging financial conditions as the Fed tightens into economic weakness. Buckle up.


Relevant Past Articles:
Note: Much of today’s commentary will be centered around a chart breakdown from the fantastic website www.currentmarketvaluation.com, a great resource for readers.
The State of Equity Markets

In today’s equity market valuation analysis, we will cover a few separate economic models and frameworks investors can use to evaluate the attractiveness of the equities market. To begin with, It’s important to remember that the very structure of the current monetary system means that on a long enough timeframe, upwards trends in productivity numbers and equities are a result of the compounding effects of inflation. Nominal gross domestic product and total U.S. equity market capitalization over the decades have been quite literally “up only”. Yes, this does include massive productivity enhancements, but the effect of inflation often masks the real returns that equities offer over decades of time.
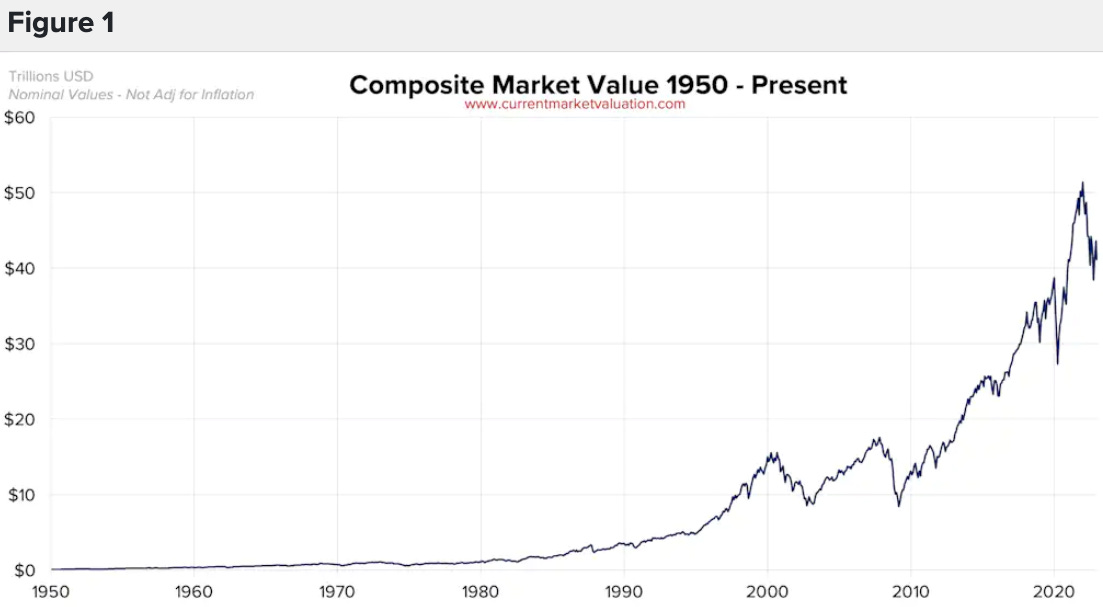

As a percentage of GDP, equity market values since the 1950s are in a general upwards trend, which can be attributed to a variety of factors including globalization, the industrialization of much of the developing world, and greater financialization of the economy.
Often referred to as the Buffet Indicator, equity markets still look historically overvalued relative to the output produced by the U.S. economy, and with a recession on the horizon, further equity weakness could be on the way.

In particular, looking at this drawdown relative to those of the past, the current rise in U.S. Treasury yields as equity markets have deflated offers a much different picture relative to compared to previous drawdowns. The closest comparison is the 1970s, which saw equities drawdown in real terms (relative to nominal gross domestic product).


We can also look at things like margin debt and its year-over-year change to understand the cyclical nature of equity market cycles. In real and nominal terms, we've seen the biggest year-over-year change in margin debt ever, with tech darlings like Tesla taking a massive hit recently.


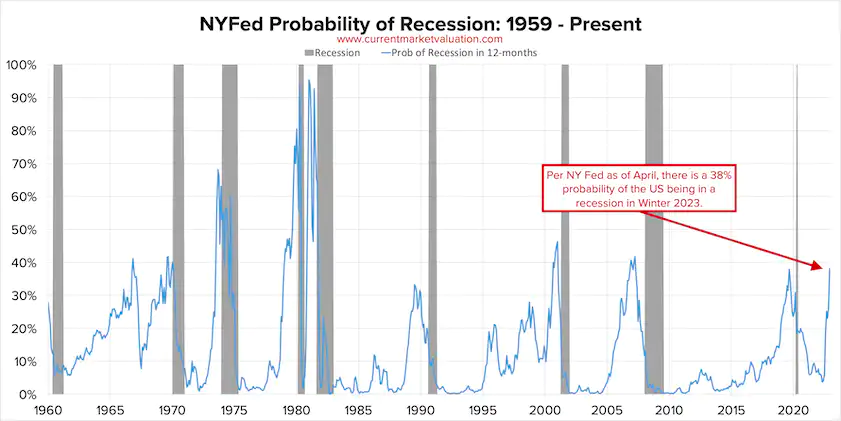
By the looks of it, the drawdown in financial assets and the lag effects of Fed policy will lead to more pain ahead in 2023 for the real economy. Signs are flashing across all meaningful yield curves that Fed policy is tightening the figurative belt on the real economy, which will have reinforcing negative impacts on financial asset prices.
We can observe the 10y3m yield spread as a predictor of U.S. recessionary conditions. Currently, it is the most inverted it has been since the 1980s.

As a result of higher interest rates, financial asset valuations are falling and interest expenses are increasing at a historic rate. This suggests incredibly challenging market conditions are likely to come.

Source: Bob Elliot
As headlines come across similar to the following, ask yourself: what has happened to government spending in previous recessions/periods of growth? Now ask yourself: how this will occur as rates have increased rather than decreased going into a recession for the first time in four decades?

Huge components of U.S. public spending: entitlements, military, and interest expense on the public debt typically increase by a large margin during recession. Meanwhile, tax receipts fall during this increase in government expenditure.
If this is to be the playbook at the height of this slowdown, it will require a subsequently exuberant response from the central banks of the world, with a particular eye on the Federal Reserve. If anything, the debt spiral dynamic of the U.S. national debt will only intensify as a result of these conditions.

As we head into 2023, readers should be prepared to face harsh conditions economically, but if a softer-than-expected recession is the result, no harm will have been done. On the other hand, if this hurricane of economic conditions does manifest true economic hardship across the globe, the policy response will be something to keep a close eye on. Our view: in the end, all roads lead to more debasement. Prepare accordingly.
Final Note:
Merry Christmas and Happy Holidays to All! -The Bitcoin Magazine PRO Team
Thank you for reading Bitcoin Magazine Pro! If you enjoyed this piece, leave a like and let us know your thoughts in the comments section. As well, sharing helps us reach a wider audience!