


Liquidity, The Central Bank Balance Sheet & Bitcoin
Liquidity, The Central Bank Balance Sheet & Bitcoin
The global reduction in liquidity has sent assets to new lows and continues to drive wealth destruction. From central bank balance sheets to M2 money supply, how is bitcoin affected?


Relevant Past Articles:
Liquidity Is In The Driver's Seat
By far, one of the most important factors in any market is liquidity — which can be defined in many different ways. In this piece, we cover some ways to think about global liquidity and how it impacts bitcoin.
One high-level view of liquidity is that of central banks’ balance sheets. As central banks have become the marginal buyer of their own sovereign debts, mortgage-backed securities and other financial instruments, this has supplied the market with more liquidity to buy assets further up the risk curve. A seller of government bonds is a buyer of a different asset. When the system has more reserves, money, capital, etc. (however one wants to describe it), they have to go somewhere.
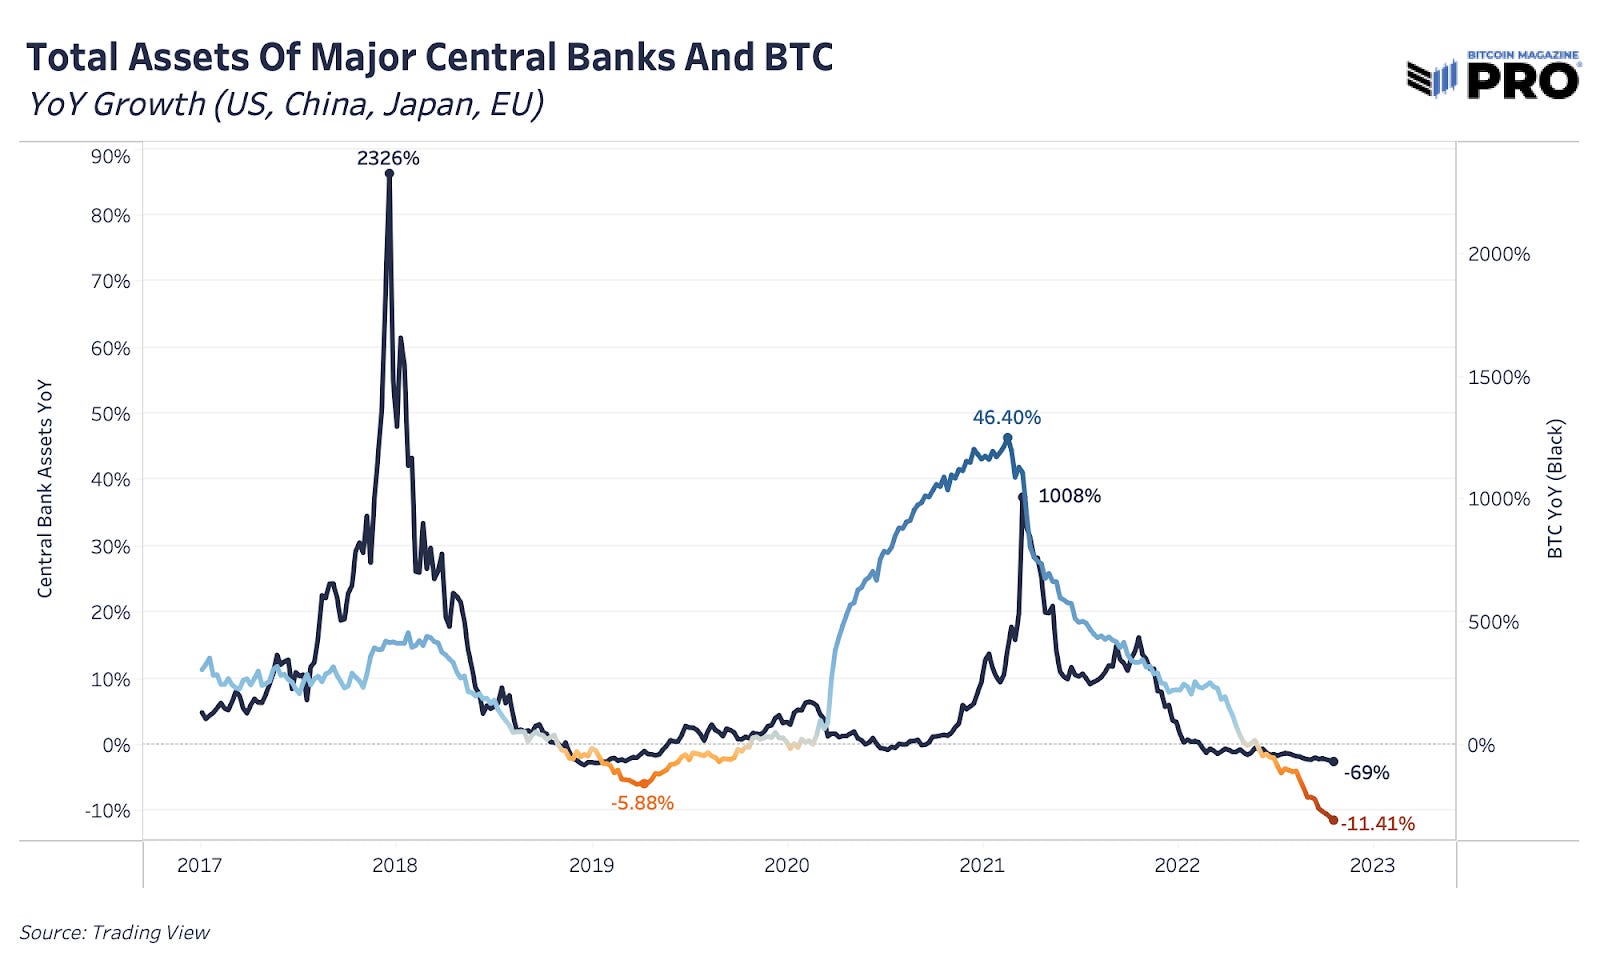
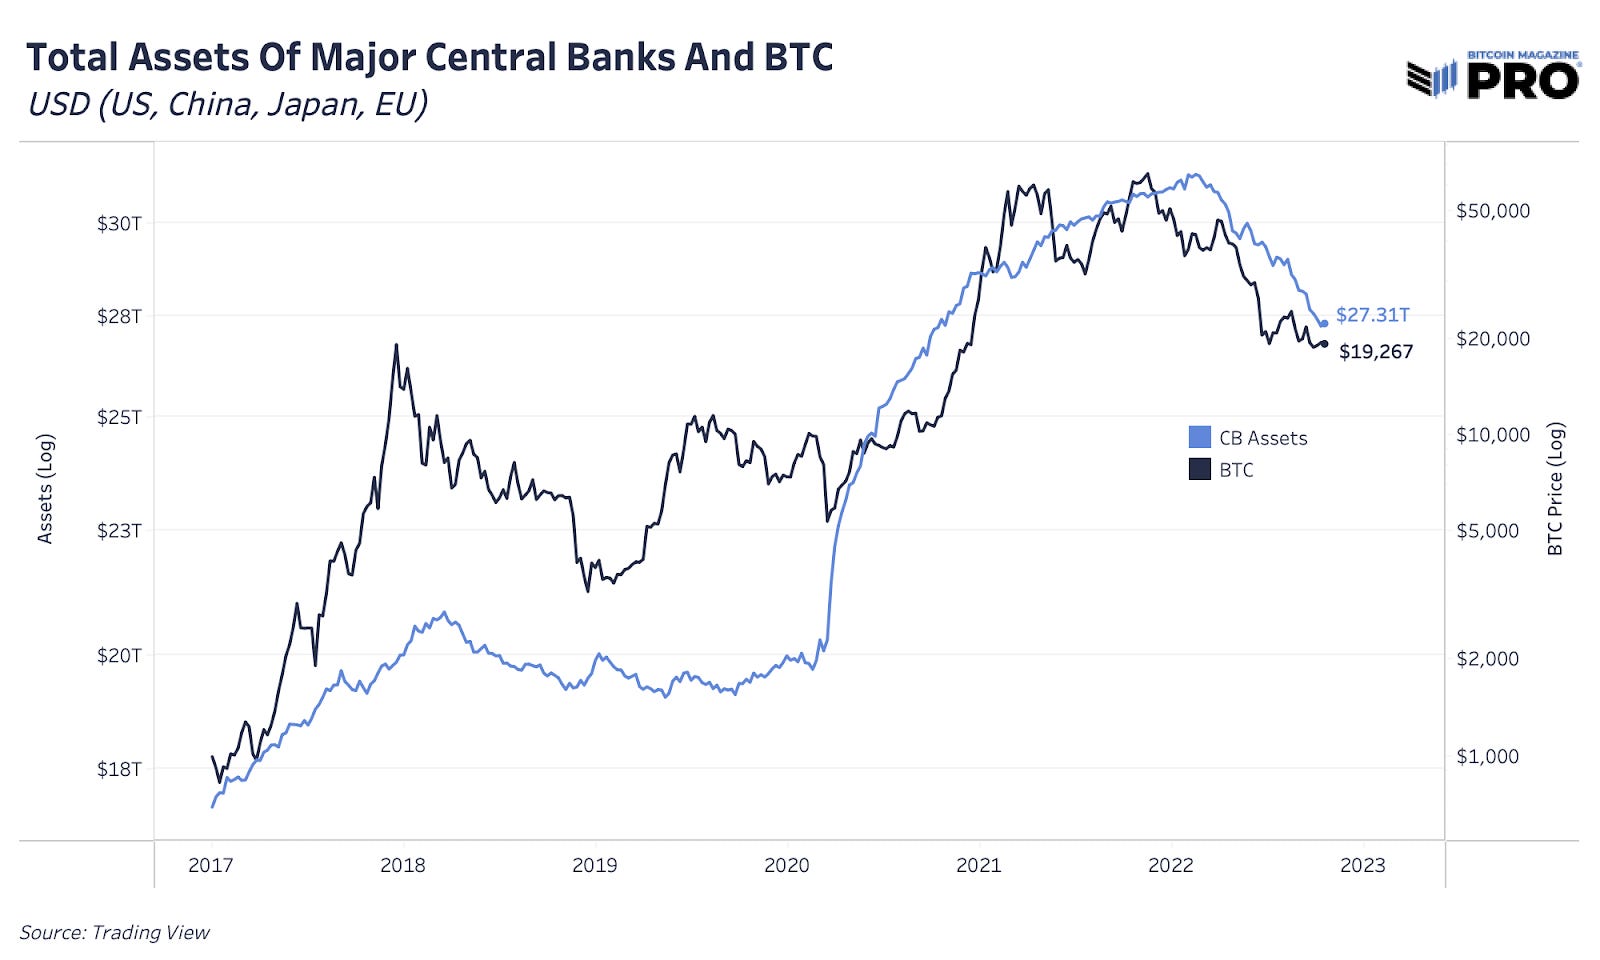
In many ways that has led to one of the largest rises in asset valuations globally over the last 12 years, coinciding with the new era of quantitative easing and debt monetization experiments. Central bank balance sheets across the United States, China, Japan and the European Union reached over $31 trillion earlier this year, which is nearly 10X from the levels back in 2003. This was already a growing trend for decades, but the 2020 fiscal and monetary policies took balance sheets to record levels in a time of global crisis.
Since earlier this year, we’ve seen a peak in central bank assets and a global attempt to wind down these balance sheets. The peak in the S&P 500 index was just two months prior to all of the quantitative tightening (QT) efforts we’re watching play out today. Although not the only factor that drives price and valuations in the market, bitcoin’s price and cycle has been affected in the same way. The annual rate-of-change peak in major central banks’ assets happened just weeks prior to bitcoin’s first push to new all-time highs around $60,000, back in March 2021. Whether it’s the direct impact and influence of central banks or the market’s perception of that impact, it’s been a clear macro-driving force of all markets over the last 18 months.

One of the macroeconomic experts on global liquidity is CrossBorder Capital, founded by Michael Howell. They take the definition of liquidity far beyond that of central bank balance sheets showing the deep, sophisticated data and flows relationships that reveal just how much valuations depend on global liquidity. The vacuum sucking liquidity out of the system is destructive for global wealth across all financial assets and housing, not just bitcoin. And it’s not over yet.
At a market cap of just fractions of global wealth, bitcoin has faced the liquidity steamroller that’s hammered every other market in the world. If we use the framework that bitcoin is a liquidity sponge (more so than other assets) — soaking in all of the excess monetary supply and liquidity in the system in times of crisis expansion — then the significant contraction of liquidity will cut the other way. Coupled with bitcoin’s inelastic illiquid supply profile of 77.15% with a vast number of HODLers of last resort, the negative impact on price is magnified much more than other assets.
Keep reading with a 7-day free trial
Subscribe to Bitcoin Magazine Pro to keep reading this post and get 7 days of free access to the full post archives.