Bitcoin Magazine PRO Monthly Report, April 2022 Preview
Become a premium subscriber to Bitcoin Magazine PRO to get access to this monthly report and all of the Bitcoin Magazine PRO research. We will release the full monthly report to free subscribers next Monday, May 9.
Sign up with the button below to get 25% off a premium subscription and access to the full report.
PREPARED BY:
Dylan LeClair, Head of Market Research
Sam Rule, Lead Analyst
Summary:
On-Chain Market Dynamics
On-Chain Cyclical Indicators
MVRV, Realized Price To Liveliness Ratio
Last Active Supply, Adjusted Supply
LTH Capitulation And Accumulation, Exchange Balances
Whale Accumulation And Purpose ETF
Bitcoin Derivatives
Perpetual Swaps Market Funding Rate
Futures Open Interest, Perpetual Futures Open Interest
Stablecoin Margin And Stablecoin Supply
Bitcoin Mining
Hash Rate, Hash Price, Difficulty
Miner Capitulation, Puell Multiple
Bitcoin Production Cost, Bitcoin Energy Value
Macro Landscape
U.S. Treasury Yields, Fed Funds Rate Projections
BTC VIX Correlation, High Yield Credit Spreads
BTC DXY Correlation, Concluding Thoughts
Executive Summary
Markets have continued selling off throughout April across credit and equity, bitcoin included. Now down 43% from the all-time high, bitcoin continues to make higher lows in the face of a major macro credit deleveraging scenario unfolding. Compared to the drawdowns in various equity indexes and tech stocks, bitcoin still trades like a high beta risk-on asset, but it has held up surprisingly well when comparing all-time high and year-to-date drawdowns.
Zooming out, a logarithmic view of bitcoin’s average price by quarter shows that adoption and monetization carries on. Even with market liquidity fading and a bearish market scenario looming, long-term holders and investors continue with accumulation opportunities like they have every cycle. March and April were the second and third-largest outflow months for bitcoin leaving exchanges, hash rate reached new all-time highs, and another sovereign nation, Central African Republic, adopted bitcoin as legal tender.
On-Chain Market Dynamics
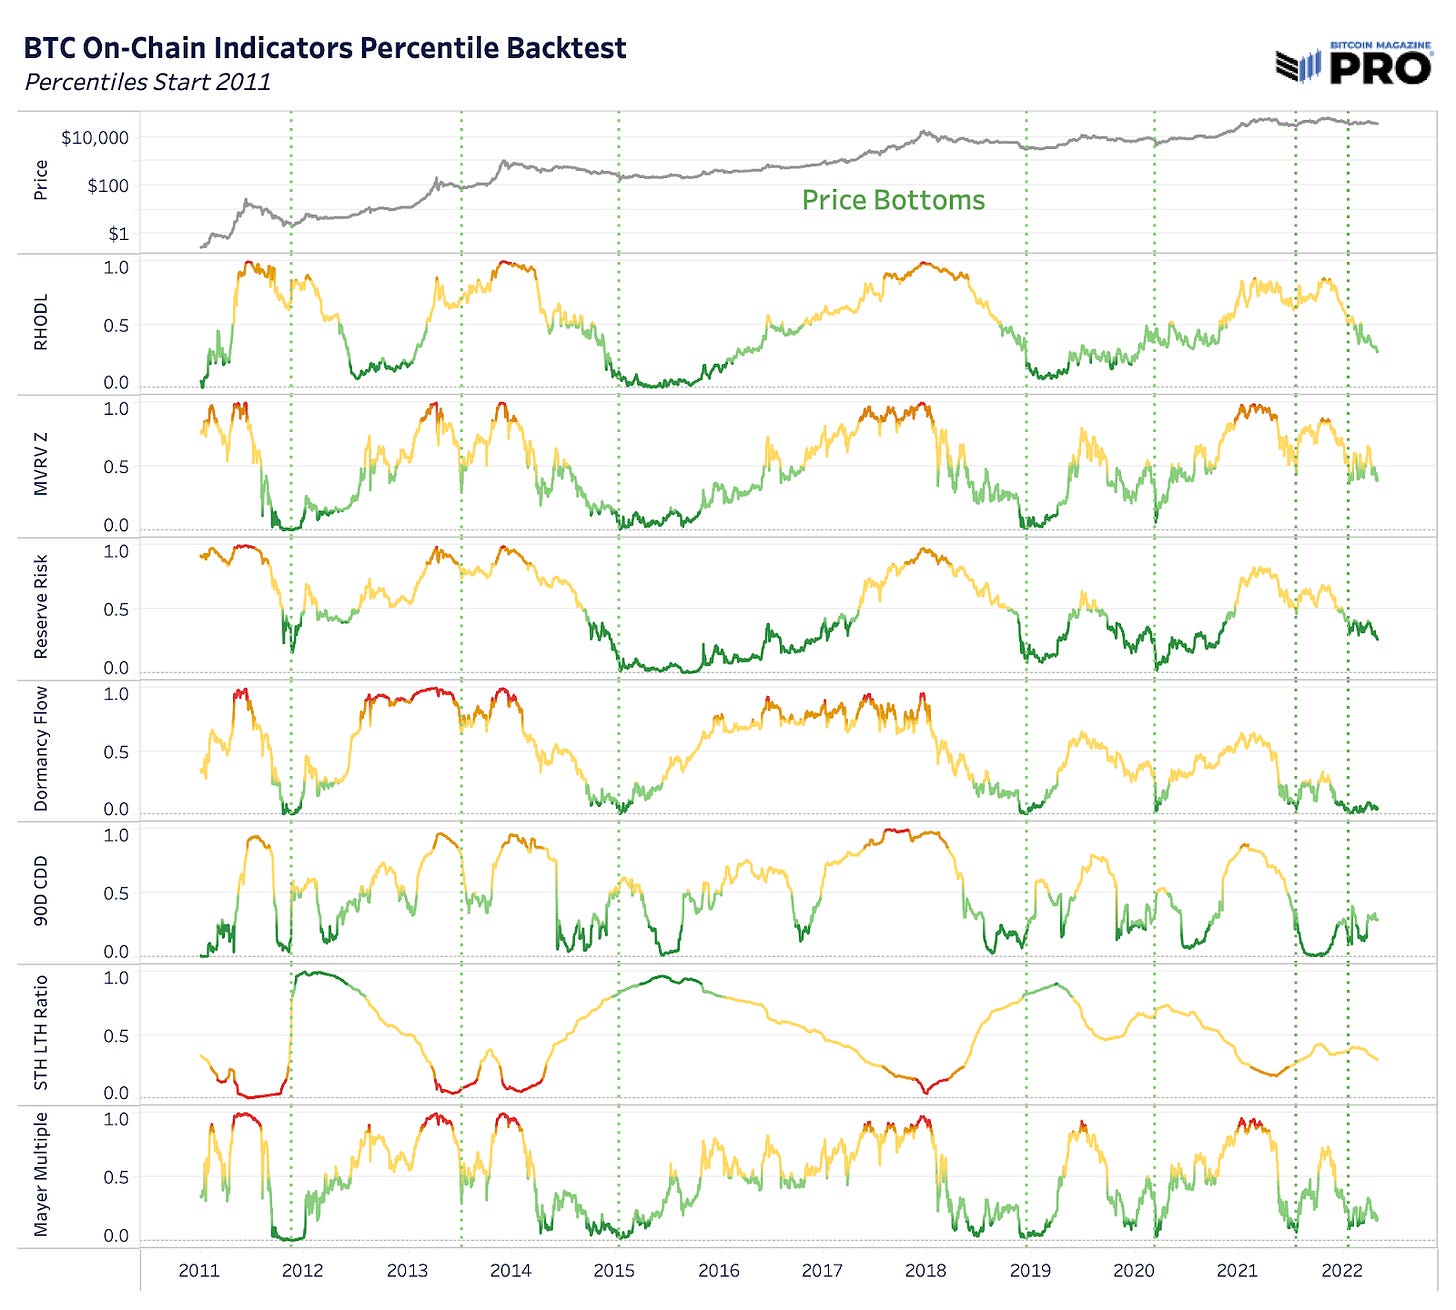
There’s a variety of on-chain analysis metrics that can help signal changes in economic behavior and market structure when bitcoin cycles are close to tops and bottoms. Over the last month, some key on-chain metrics across Reserve Risk, Dormancy Flow, and 90 Days Coin Days Destroyed have signaled that bitcoin may be close to a cyclical bottom showing that long-term this is yet another significant accumulation opportunity even pending further drawdown in price.
Yet, timing bottoms is near an impossible feat and the unique macro conditions we find ourselves in today make it that much more difficult to assess. Bitcoin’s ongoing monetization and adoption process is up against a larger force: macro credit deleveraging while bitcoin maintains a tight relationship with liquidity and risk assets early in its adoption curve. The charts below show key bitcoin market indicators tracking percentiles and percentile thresholds over time. More about the methodology can be read here.
The Market Value to Realized Value Ratio, a ratio of price and bitcoin’s realized price (cost basis) of the network, has yet to revisit market capitulation levels we’ve seen throughout bitcoin’s history. These events, where price falls below the entire cost basis of the network for a short period of time, have acted as generational buying opportunities in bitcoin’s history.
Currently at $24,511 with a strong technical price support at $30,000, this becomes a key range to watch if risk assets see greater outflows and bitcoin faces more downside over the coming months.
To supplement these on-chain metrics, there is also the Realized Price to Liveliness Ratio developed by Don Shahar. This metric divides bitcoin’s realized price by Liveliness, the sum of coin days destroyed over all coin days created. Liveliness increases when there is more distribution from holders and decreases when there is more accumulation. The ratio creates a view of useful support and resistance areas based on bitcoin’s fair value price weighted by the state of holding activity. Currently, bitcoin has struggled to remain significantly above the ratio for the entire year, now at a resistance of $39,933.
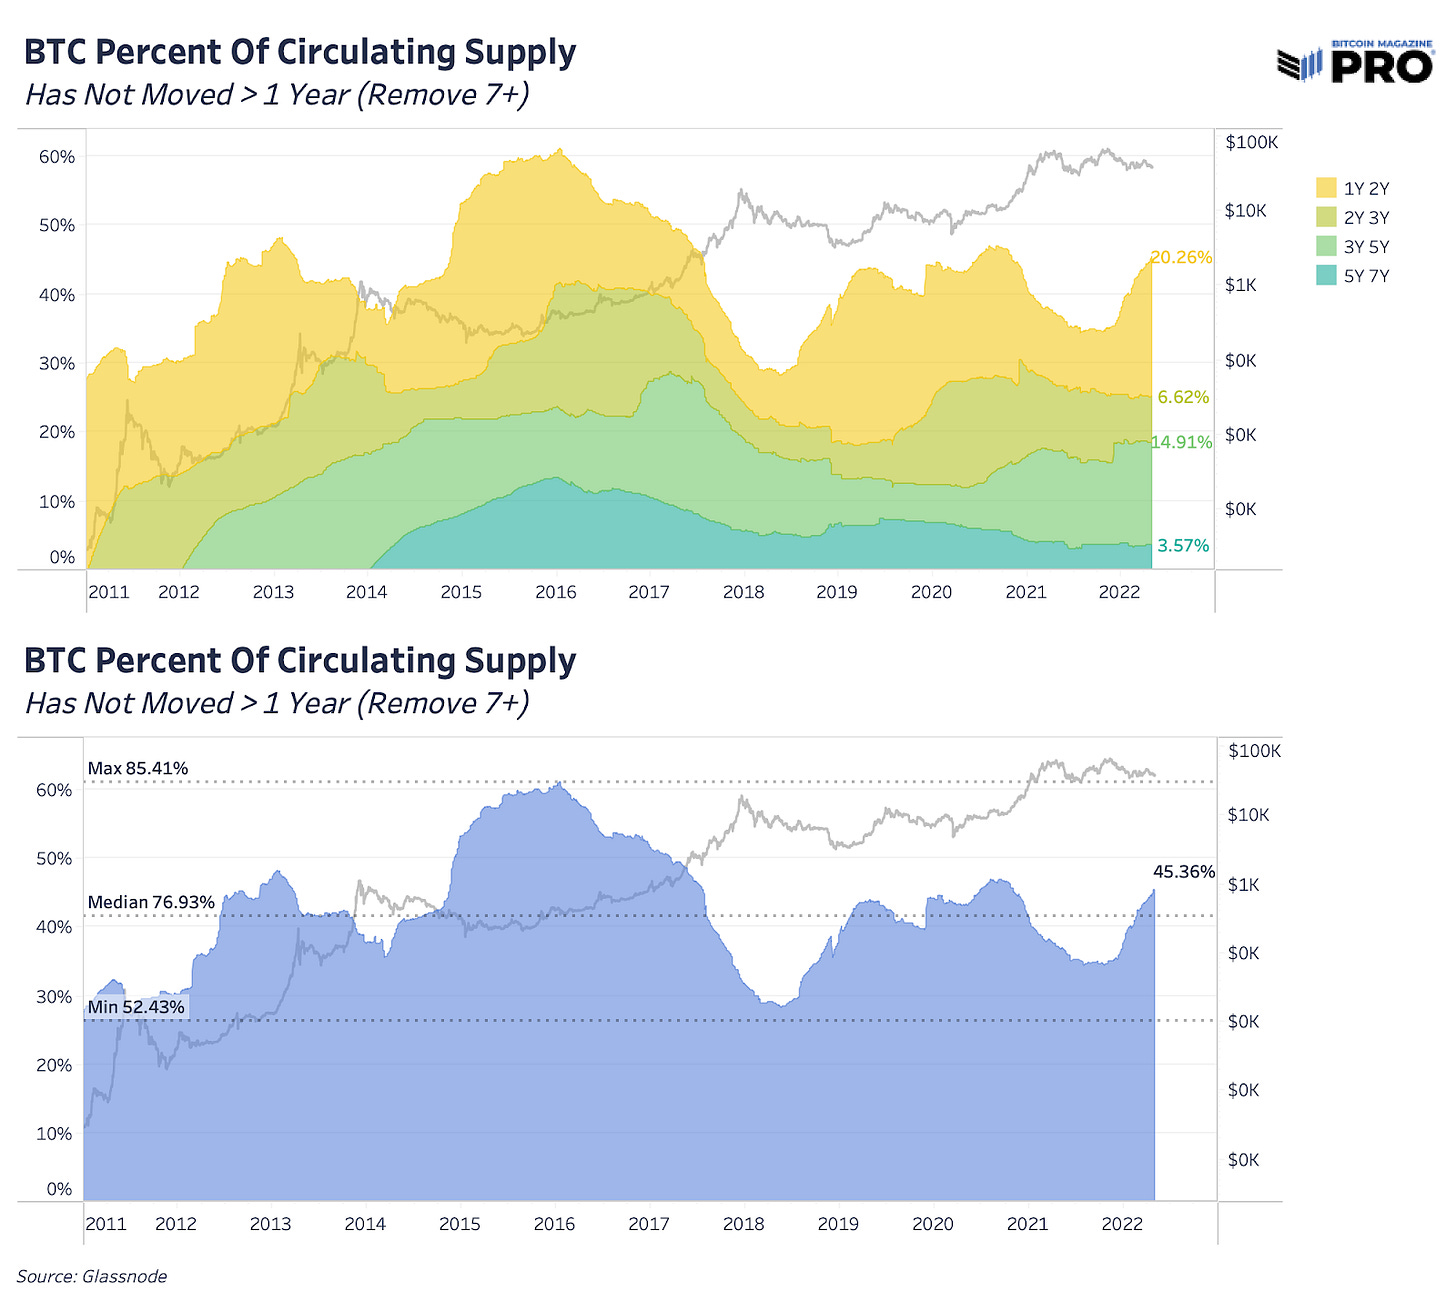
In our March Monthly Report, we highlighted the percentage of circulating supply that has been held for over one year. That is now at a new all-time high of 64.81% consisting of 12.33 million bitcoin valued at a $475 billion market cap. This trend continues to climb higher just like previous accumulation cycles as newer coins acquired over the last year continue to sit dormant but new all-time highs have been helped by a growing number of older coins.
Breaking this down by HODL Waves to look at the various age bands of coins that haven’t moved, there’s been a rising impact on the percent of supply that hasn’t moved because of much older coins over Bitcoin’s lifetime. Older coins that haven’t moved in over seven years now make up nearly 20% of that 64.81%.
Removing the older, largely-assumed lost coins, we still have a rising trend of coins that haven’t moved in the one-to-two year range but it’s not as significant as previous cycles. What this does show, however, is the rising impact of potentially lost bitcoin on circulating and HODLed supply.
Although 21 million is bitcoin’s hard cap supply, there’s nearly 3.5 million coins that are more than seven years old and can be assumed lost or likely to never move again. Some of these coins will likely make their way onto the market but many won’t, increasing Bitcoin’s supply scarcity over time. Currently, those lost coin estimates are worth $11.5 billion and leave Bitcoin’s adjusted supply around 15.5 million, versus the 19.02 million circulating supply today.
Over the last month, we’ve also seen a rise in long-term holder capitulation, specifically newer long-term holders. The long-term holder realized price has been declining at its fastest rate in bitcoin’s history, falling 17.71% over the last 30 days down to just below $13,000. We can see these dynamics more closely in the long-term holder spent price which tracks the average price long-term holders are spending coins at.
The long-term holder spent price, now just shy of market price, shows long-term holders on average are currently selling at breakeven. Long-term holders on average selling at breakeven or at a loss is rare in Bitcoin’s history, only occurring a few times during bear markets.


