PRO Market Keys Of The Week: 4/24/2023
Upcoming dates for economic metrics and earnings data for U.S. equities. CBOE introduces a 0-day expiry volatility index. Debt ceiling woes raise rates of 1-year credit default swaps for Treasuries.
What We’re Watching
Upcoming Economic Calendar:
April 26, 2023
8:00 a.m. EST., U.S. Durable Goods Orders (MoM), forecast: 0.7%, previous: -1%
April 27, 2023
8:30 a.m. EST, U.S. GDP Growth Rate (QoQ), forecast: 2%, previous: 2.6%
April 28, 2023
5:00 a.m. EST, European Union GDP (YoY) Flash, forecast: 1.4%, previous: 1.8%
8:30 a.m. EST, U.S. Core PCE Price Index (MoM), forecast: 0.3%, previous: 0.3%
8:30 a.m. EST, Personal Income (MoM), forecast: 0.2%, previous: 0.3%
8:30 a.m. EST, Personal Spending (MoM), forecast: -0.1%, previous: 0.2%
Zero-Day Expiry Volatility Index Introduced
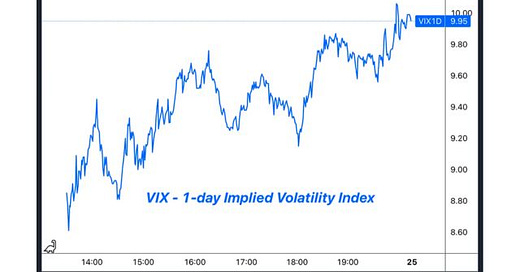
The Chicago Board Options Exchange (CBOE) rolled out a 1-Day Volatility Index (VIX1D) today. This is a brand new, 1-day implied volatility contract that was created in response to the growing popularity of zero-day until expiry options: a shiny new fear gauge of sorts for Wall Street as options market and short-term equity price action is increasingly driven by derivative positioning and options flows. Below, we show the VIX1D during its first day of trading, while also comparing it to other VIX (S&P 500 implied volatility) indices.
As one- and zero-day expiry options have become an increasing part of the flow in equity markets, an index purpose-built to showcase 1-day implied volatility will be a useful risk gauge going forward. It’s likely that the net result of this new financial tool is further profits for institutional investors and market makers, while retail bleeds money, as documented in a recent study.
Goldman Sachs Global Investment Research produced a stunning graphic regarding the prevalence of zero-day flow.
Earnings Season Ahead For U.S. Equity Markets
Here are the names that will impact indices the most and dates when earnings are released:
April 25, 2023
After-hours, MSFT - Microsoft Corporation EPS Forecast: $2.22 Last year EPS: $2.22
April 26, 2023
After-hours, GOOG - Alphabet Inc. EPS Forecast: $1.07 Last year EPS: $1.23
After-hours, GOOGL - Alphabet Inc. EPS Forecast: $1.07 Last year EPS: $1.23
April 27, 2023
After-hours, AMZN - Amazon.com, Inc. EPS Forecast: $0.21 Last year EPS: $0.21
April 28, 2023
Pre-market, XOM - Exxon Mobil Corporation EPS Forecast: $2.65 Last year EPS: $2.07
Pre-market, CVX - Chevron Corporation EPS Forecast: $3.36 Last year EPS: $3.36
April 29, 2023
Pre-market, AAPL - Apple Inc. EPS Forecast: $1.00 Last year EPS: $0.73
Pre-market, FB - Facebook, Inc. EPS Forecast: $3.04 Last year EPS: $3.30
Pre-market, JNJ - Johnson & Johnson EPS Forecast: $2.48 Last year EPS: $2.59
Pre-market, PG - Procter & Gamble Company EPS Forecast: $1.19 Last year EPS: $1.26
Pre-market, T - AT&T Inc. EPS Forecast: $0.79 Last year EPS: $0.89
Pre-market, VZ - Verizon Communications Inc. EPS Forecast: $1.28 Last year EPS: $1.31
Earnings expectations continue to dwindle, but a hot GDP print or beats on earning expectations could send risk assets higher in the face of another Federal Reserve rate hike or even without one.
Earnings have been a mixed bag so far, but far from what you would expect to see in a real economic downturn. Companies are still exceeding expectations with positive surprises.
Earnings are still in contractions and have been for over a year, but there remains optimism priced into 2024 — along with rate cuts, which is an interesting dichotomy in economic outcomes.
Thoughts on earning seasons are mixed across the board, with headlines from “Morgan Stanley Sees Risks to Stocks From Earnings, Fed” to “Investors Buy Up Earnings Wins, Sending Stocks Higher Than Usual” rolling off the press in recent days. Earnings and GDP remain key data points with markets looking ahead to the summer and a resolution to raise the debt ceiling.
Debt Ceiling Woes As The Treasury General Account Balance Dwindles
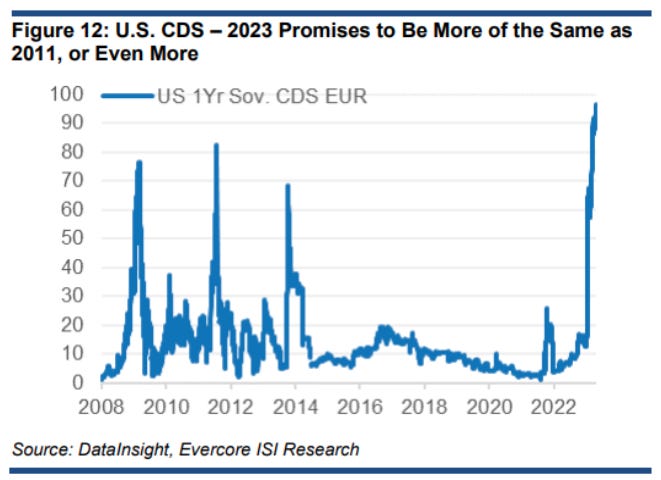
Debt ceiling worries have raised the odds for 1-year credit default swaps of U.S. Treasuries to the highest reading ever. While the weighted probability of a default — a delay in repayment is likely the worst case — is still miniscule, it is not everyday that five-year swaps for the protection against U.S. government default spike higher than that of multinational corporations like Apple.
Source: Zerohedge
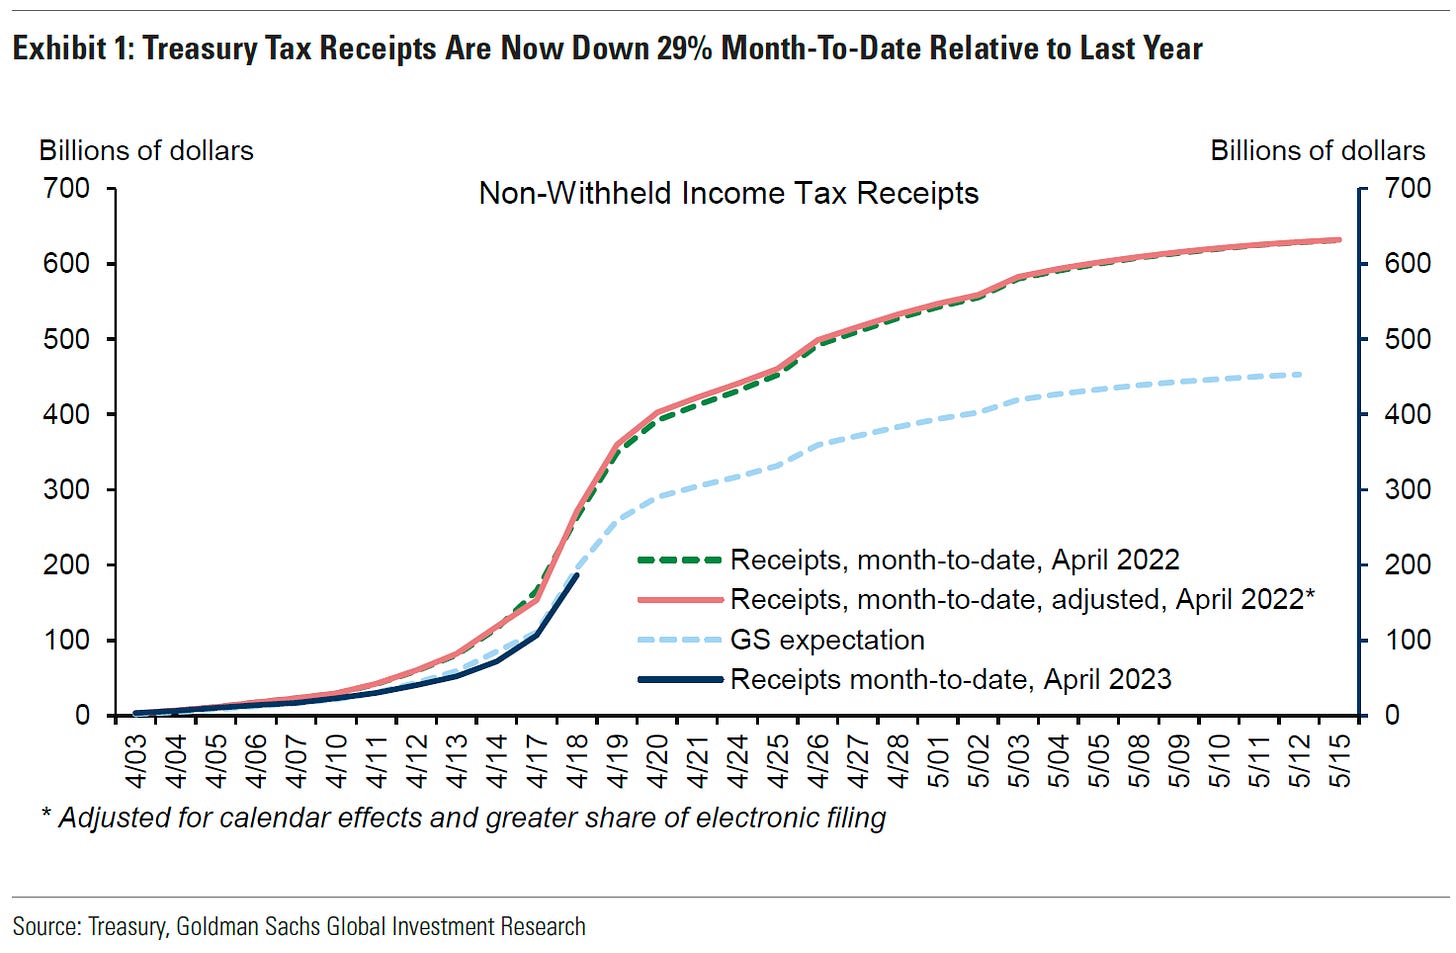
What will likely be a dominant factor in risk asset prices over the medium term is liquidity injections from the U.S. Treasury, or lack thereof. As displayed below, tax revenues are down 29% compared to last year, while interest expense as a percentage of revenues is soaring.
Source: Goldman Sachs
The Fed’s tightening program has faced counter measures by Treasury liquidity injections for much of 2022 and 2023. Keep an eye out for a responding mini-tantrum in equity markets at least until the debt limit is negotiated higher — as it always is.
Later this week, we will publish an analysis on the history of the halving cycles using on-chain and miner data, as we weigh in on the age-old question: Is the halving priced in?
Thank you for reading Bitcoin Magazine Pro, we sincerely appreciate your support! Please consider leaving a like and letting us know your thoughts in the comments section. As well, sharing goes a long way toward helping us reach a wider audience!


