PRO Market Keys Of The Week: 4/18/2023
Both equity market and bitcoin volatility are trending lower, allowing for Wall Street to take on more risk. Year-to-date adjusted returns show bitcoin’s dominance plus a long-term holder bull signal.
Today's Market Keys will shine a light on some historic macro conditions before turning our attention to some very promising data points in the Bitcoin sphere. Before we begin, we want to inform our subscribers of behind-the-scenes work on new and exciting approach to deliver insights and visuals to the Bitcoin Magazine PRO product. Our team is experimenting with new ways for our readers to view and interact with live data around the clock that we often cover in our article insights. We are looking forward to rolling this out in the months ahead, so stay tuned!
Equity And Bitcoin Volatility
Equity market volatility hits a multiyear low! The 1-month implied volatility gauge for U.S. equity markets (VIX) touched levels not seen since late 2021, around the time that equity indices globally peaked, a sign of the current supportive conditions in equity markets. With implied volatility at such low levels, allocators on Wall Street can afford to layer on more risk, which isn’t the case during periods of higher volatility and market illiquidity.
While equity market implied volatility hits new lows, bitcoin 1-month implied volatility (BVIV) is also drifting lower as the market consolidates around the $30,000 level. BVIV was released to be calculated using the same methodology used by VIX, but adjusted for 24/7/365 markets. A lower volatility index for bitcoin may mean we are coming due for a quick price move — in either direction.
Using VIX and BVIV as measures of expected market volatility, we can see that bitcoin currently trades with approximately 3.5 times the expected market volatility compared to the U.S. equity markets.
U.S. Equity Market Displaying Impressive Strength Relative To Bonds
Denominated in U.S. Treasury Bonds, the S&P 500 and equity markets by extension, have shown impressive strength to start the year, with the relative pair near highs only seen at the peak of the everything asset bubble.
While this relative strength has been on display for equities, it is worth revisiting the fact that capital markets remain in an environment where the trailing 1-year correlation between bonds and equities remains positive during an equity market & bond downtrend. This dynamic presents a new paradigm for multiple generations of investors who had only invested during a secular bond bull market, where stocks and bonds were inversely correlated during equity market downturns.
Year-to-Date Risk Adjusted Returns
We know the bitcoin price has been on a tear to start 2023, but just how special has the start of the year been for the monetary asset? Looking at absolute returns can often be misleading, as various assets trade with varying levels of realized and implied levels of volatility, as demonstrated above with the relative levels of the BVIV and VIX index.
As shown below, not only has bitcoin blown out the competition in absolute levels of returns to start the calendar year, but in risk-adjusted terms, it has also led the pack against the Nasdaq, Gold, S&P 500, U.S. Treasury Bonds and Crude Oil. The graph below is a taste of some of the new data series we will be rolling out in the coming weeks/months ahead.
Bitcoin 2023 ticket prices increase FRIDAY at midnight! Lock in your ticket & join the Bitcoin Magazine PRO team at the Bitcoin event of the year. Paid subscribers get 15% off tickets and everyone can use code “BMPRO” for 10% OFF.
Bitcoin Bull Signal Close To Firing
While the state of the current macroeconomic regime gives us some cause for concern, the bitcoin-centric analytics in front of us are screaming that the start of a new bull market is currently ahead of us, if not yet started already.
Let us explain:
From the most basic level, why does the price of any asset go up or down? Supply and demand is the answer from Econ 101.. But what can we possibly derive from an immutable and transparent ledger that records data on the spending behaviors of its holders? Quite a lot actually, and the signs point to an increasingly illiquid supply that will respond ever more violently to an increase in demand — or a further decrease in the flow of available supply, coming around April 2024!
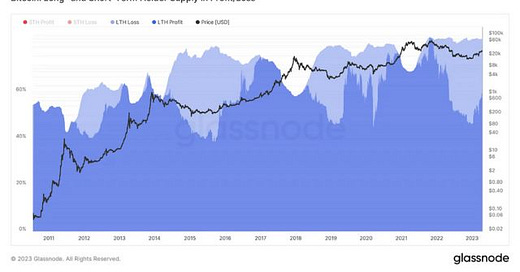
When you zoom out, the bitcoin market is quite simple! It is an asset with a terminal supply of 21,000,000, but a fluctuating supply available to the market as HODLers of last resort setting the floor with their intense accumulation and refusal to sell. Even the holders with the most conviction shave off some of their stash at the peak of hype cycles, which resolves in the exchange rate falling, as market selling finally overwhelms the waning supply of frenzied demand that entered the market. Notice the accumulation pattern of long-term holders during bottoms and the distribution that occurs near cycle peaks.
This cycle was somewhat different in regards to new supply that entered the spot market because derivative speculation played a larger role in the bull cycle and the subsequent bust. The accumulation of convicted long-term holders and investors is what served as support as bitcoin fell close to 80% below the all-time highs made in November 2021.
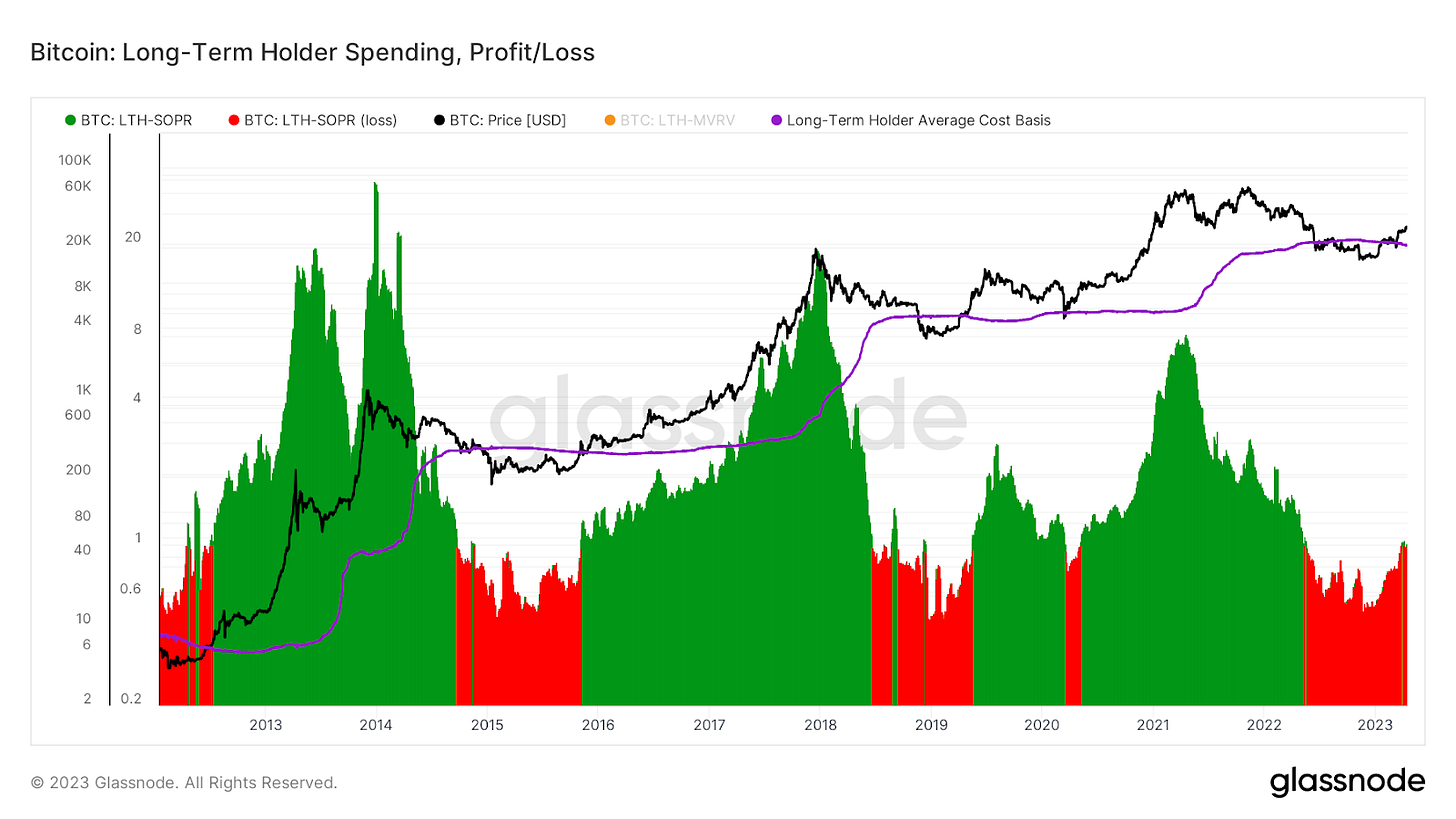
We can look at the average cost basis of long-term holders, also called the realized price, as a gauge for a capitulation level from bitcoin’s cohort with most conviction. Shown below is the long-term holders’ realized price in purple plotted against the BTC/USD exchange rate, and the spending habits of long-term holders, as shown by the green/red area.
Notice what happens historically as the following conditions are met:
Long term holders continue accumulation in the face of a flattening exchange rate, helping to solidify the bottom as panicked speculators and traders exit their holdings.
BTC/USD exchange rate surpasses the average long-term holder cost basis.
BTC/USD exchange rate surpasses the average long-term holder spend price (the average cost basis for the few long-term holders who are spending their coins into the market/parting with their stack.
The bitcoin market is just slightly below the level where condition three is satisfied. While past performance is in no way indicative of future results, the bitcoin supply/demand equation is primed to present the most lucrative opportunity over the next 12-18 months since 2020, which coincidentally — or not — was the year of the last bitcoin halving cycle.
Final Note
About 54,000 blocks until block 840,000. Approximately 368 days until the next bitcoin halving.
Stack accordingly.
We opened last week’s article about inflation to all subscribers. Enjoy!
Thank you for reading Bitcoin Magazine Pro, we sincerely appreciate your support! Please consider leaving a like and letting us know your thoughts in the comments section. As well, sharing goes a long way toward helping us reach a wider audience!


“which coincidentally — or not”
I’m going with “or not”