July Report Release: Long Live Macro
We’re releasing the July Monthly Report across both PDF and Substack options. Click the “Read Now” button below to access the full report PDF.
PREPARED BY:
Dylan LeClair, Head of Market Research
Sam Rule, Lead Analyst
Summary:
Long Live Macro
Risk Parity Correlation, Recession
Inflation, Federal Reserve Policy
Global Indicators, Eurodollar Curve
Government Spending
Spending Percentage Of Tax Receipts
Hyper-Financialization
Net Worth, Negative Real Yields
Equities
Compressed Valuations
Rising U.S. Dollar Risk
Earnings Projections, PMI Slowdown
Illiquidity And Volatility
Credit Spreads, Unemployment
Extreme Tail Risks
Central Bank Balance Sheets
Introducing: Bitcoin
Days Below Realized Price
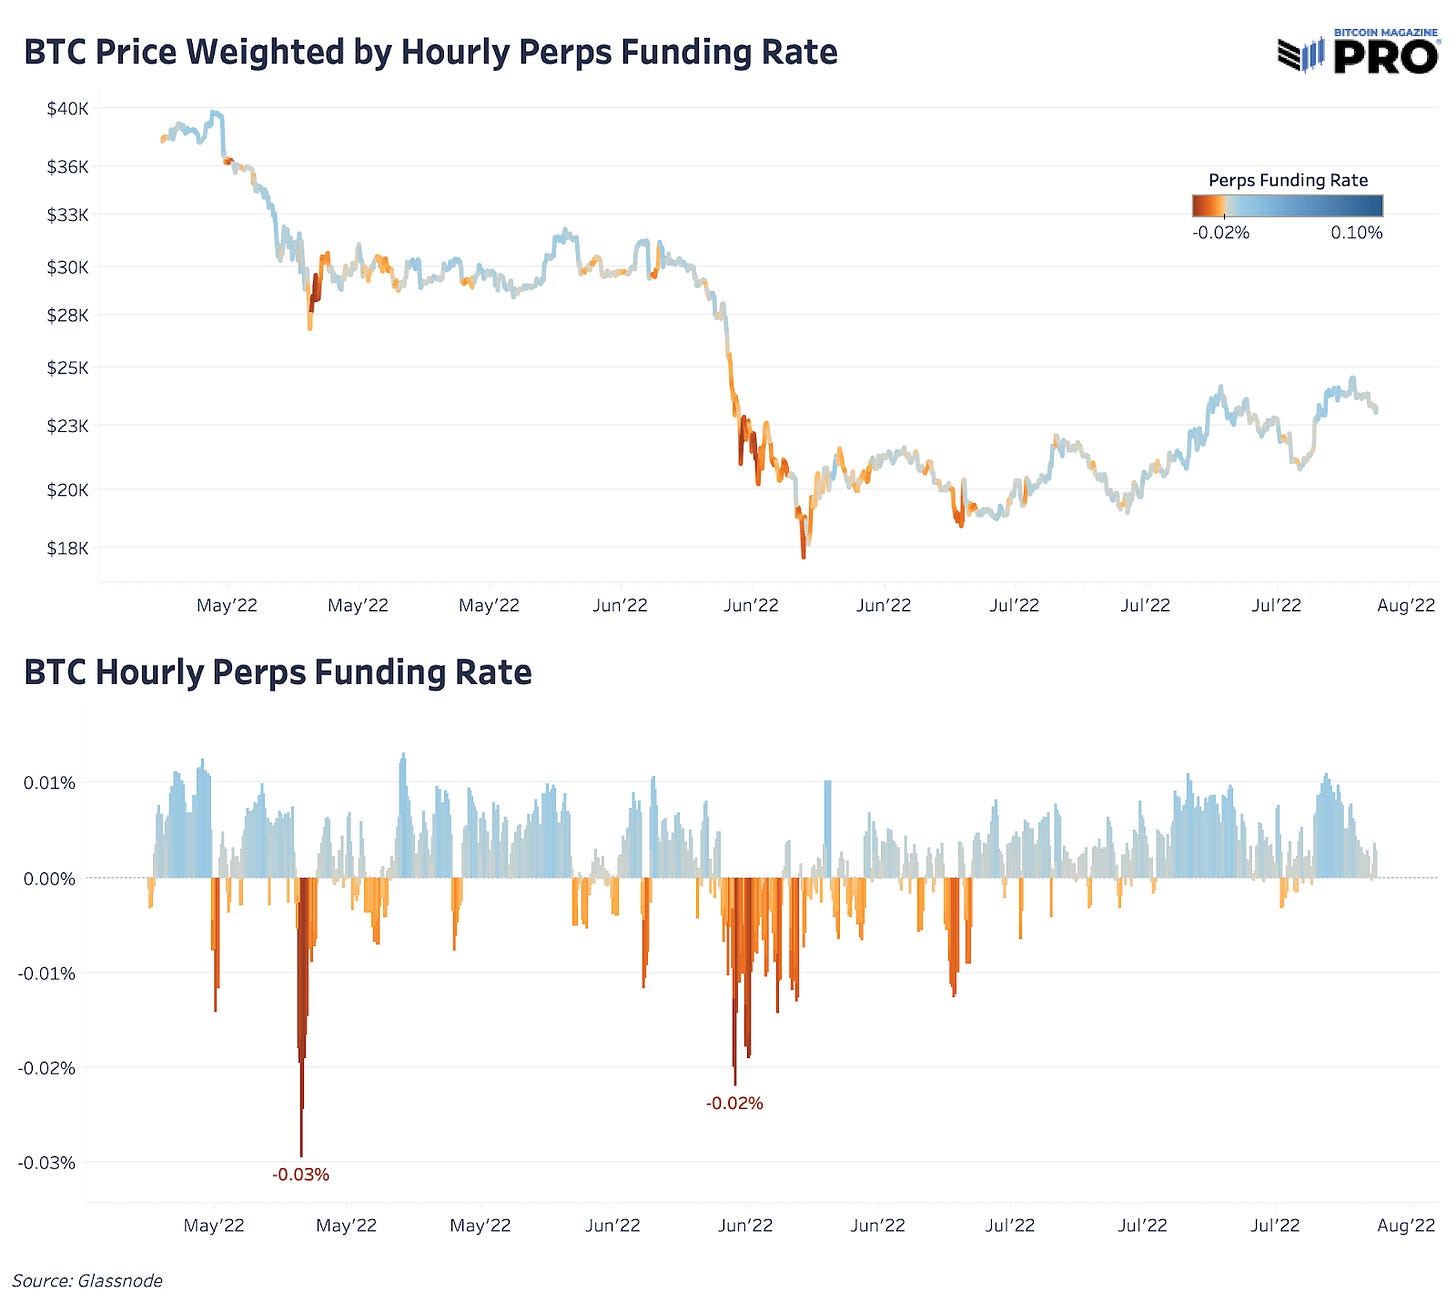
Put/Call Options, Perps Funding
Global M2 Growth
Executive Summary
With 2022 well past the halfway point, it is abundantly clear that long/short macro investing has come back with vengeance. Riding high following the stimulus-frenzied market of 2020/2021, 2022 has been characterized by soaring inflation, hawkish central bank monetary policy, cratering asset prices and increasing geopolitical tension between economic superpowers.
The contents of this report will dive into the dynamic macroeconomic landscape, which will use a multidimensional approach to analyze financial markets and economic data.
Long Live Macro
The story of 2022 has been the inflation-induced monetary tightening that has occurred across financial markets. In an attempt to fulfill their dual mandate of price stability and full employment (more on this later), the Federal Reserve has embarked upon one of the fastest hiking cycles in history.
While this is a bitcoin-focused publication, the contents of this report will extensively cover many different developing macroeconomic trends, with the purpose of gaining a more comprehensive understanding of the global financial market landscape, which we will then use to evaluate probable future outcomes, which will in turn bring us back to bitcoin and the potential future performance thereof.
On Thursday July 28, it was announced that the United States economy contracted by 0.9% in real terms during the second quarter, marking the second consecutive quarter of negative gross domestic product (GDP) growth, and officially entering the economy into a technical recession (despite the denial by certain key political parties and figures). A deceleration and an eventual outright contraction of growth became an increasingly obvious outcome during the first quarter of 2022 as prices of key commodities, particularly energy, soared causing interest rates to fly and central banks to reverse course from their policies of easing to net tightening. Notably, stocks and bonds held an extremely strong positive correlation for long periods of time during the sell-off, which hadn’t occurred since the inflationary bear market of the 1970s.
In a previous issue of Bitcoin Magazine Pro released on March 7, 2022, titled Rising Commodities And Flattening Yield Curve, we stated the following:
“It would be wise to warn our readers that despite being extremely bullish on bitcoin’s prospects over the long term, the current macroeconomic outlooks looks extremely weak. Any excessive leverage present in your portfolio should be evaluated…
“…Indiscriminate selling of bitcoin will occur (along with every other asset) in a rush to dollars. What is occurring during this time is essentially a short squeeze of dollars.
“The response will be a deflationary cascade across financial markets and global recession if this is to unfold.”
Nearly five months later, risk assets have puked, the Federal Reserve has raised their target rate by a total of 225 basis points over the course of the last four FOMC meetings, year-over-year consumer price index (CPI) inflation has accelerated to a politically unpalatable 8.99%, and the dollar has strengthened materially against other major global currencies.
Is the bottom in risk assets in, or is the bullish price action merely a classic bear market rally? Let’s examine, with specific focus on the following asset classes: equities, fixed income, yields, volatility, commodities, foreign exchange, real estate and lastly, bitcoin and cryptocurrencies.
The most important dynamic to understand is that the Federal Reserve (and other global central banks of less importance) only have one tool to fight structural inflation: monetary policy. While the optimal solution to a fundamental supply/demand imbalance would be to increase supply through CapEx (capital expenditures) investments from commodity producers, the Federal Reserve is working to instead kill demand to bring down prices in an attempt to fulfill its dual mandate of maximum employment and stable prices.
Stated another way, the Fed is purposefully embarking upon a mission to punish asset prices and weaken U.S. economic activity in an attempt to curb inflation. Fed Chairman Jerome Powell is stating the Fed’s goals quite clearly.
In the latest FOMC meeting on Wednesday July 28, Powell said the following,
“We actually think we need a period of growth below potential in order to create some slack so that the supply side can catch up.”
“We also think that there will be, in all likelihood, some softening in labor market conditions.”
The good news for the Federal Reserve is that the slowdown in growth is coming. The bad news is that it is coming, fast. Across G-7 countries, business confidence is rolling over meaningfully while consumer confidence in many countries is at its lowest reading in recorded history. The consumer has gotten pillaged as a result of the spiraling inflationary pressures.
Shown below are U.S. hourly earnings in real terms, showing that workers in the U.S. have seen their compensation reduced in real terms even while wages are fast rising in nominal terms.
As the Fed has tightened, the bond market has begun to price in a significant slowdown in growth and call the Fed’s bluff, as Treasury bonds yields have fallen below the respective yields offered on Treasury bills, as the market is pricing in the dynamic of inflation today at the expense of a long-term slowdown in real growth.
Similarly, eurodollar futures, a market for future Fed funds rate has severely inverted into 2023, with the market’s expectations for long-term rates to settle around 2.5%, more than 100bps lower than expectations for rates in December.
Let’s revisit the reason why this is the case. Why does the market so strongly believe that the Fed cannot sustain high rates for long? The short answer/s to the question is as follows:
Sustained periods of high interest rates will functionally bankrupt the U.S. government;
U.S. entitlement spending (Social Security and the Department of Health and Human Services) plus military spending plus interest expense accounted for 149% of tax receipts for the fourth quarter of 2021.
For context, 149% was the number during a time when short-term interest rates were below 1%, tax receipts were at all-time highs (due to bloated financial markets), and before COLA (cost of living adjustments for entitlement programs) was raised by 5.9% at the end of 2021 (future estimates for 2023 COLA adjustment are approximately 8%).
As a thought experiment, think of the U.S. government as a business that entered the year 2022 spending $149 for every $100 it earned in income on just the bare minimum essentials. On top of this, the business has a debt-to-income ratio of 124%. To make matters worse, as the year has progressed, interest rates have soared, future income (in the form of tax receipts) are guaranteed to fall due a lack of harvestable capital gains, and inflation has further increased the size of annual expenses (in the form of entitlements which can be thought of as off-balance-sheet IOUs, otherwise known as unfunded liabilities).
Now, we know that the Keynesian economic model is built upon the concept of governments and central banks using fiscal and monetary policy during business cycle downturns to ease the burden on individuals and institutions. Empirical evidence of this phenomenon can be seen by looking at previous recessionary periods in U.S. economic history over the last five decades. During the last eight recessions, spending on the “essentials basket” (entitlements, defense budget, and Treasury interest expense) increased in nominal terms by an average of 23.79% from the official start of the recession until six months after the official “conclusion” of real growth contraction on average.
Similarly, median spending by the U.S. government on the “essentials basket” increased by a median amount of 24.79% from the official start of the recession until six months after the official conclusion of real growth contraction.
Now with that in mind, notice the relationship between recessionary periods and spending as a percentage of tax receipts during and directly following the period.
Notice a trend?
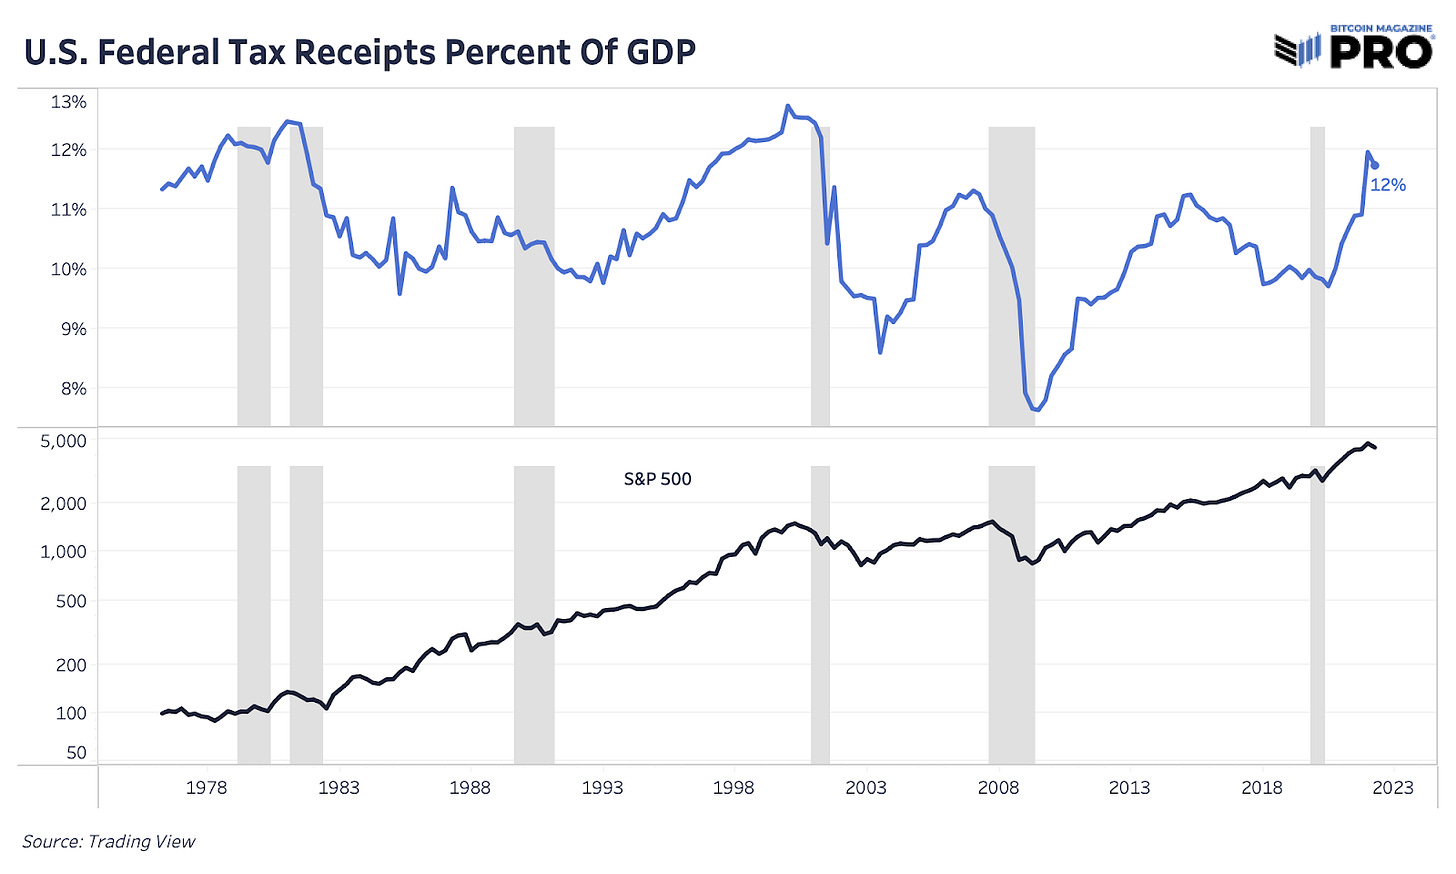
Now, let’s take a look at tax receipts as a percentage of GDP during recessionary periods. With the anomaly being the dramatic V-shaped recovery following the COVID-19 crash, where asset prices soared straight to fresh highs in rapid fashion, aided by large amount of fiscal and monetary stimulus in tandem, during every economic downturn, tax receipts as a percentage of GDP dramatically decreased during the recessionary period, as taxes are often cut and cratering asset values mean a lack of harvestable capital gains for the government to tax.
What’s The Takeaway?
The Fed can only tighten for as long as the U.S. government (and the global economy) can remain solvent. As productivity slowly crawls to a halt around the world, less dollars circulate, straining those with dollar liabilities. Foreigners that are short dollars find themselves particularly vulnerable during slowdowns of global growth.
The logical response from strained debtors is to sell anything with dollar liquidity in order to make good on said liabilities: stocks, bonds, bitcoin … anything to cover a short dollar position during a short squeeze (otherwise known as a liquidity crisis).
Given this reality, a problematic outcome for dollar debtors would be if there ever happened to be a deceleration, or worse, an outright contraction of global growth. An even worse scenario would be if financial conditions and liquidity conditions were tightening due to hawkish central bank monetary policy in an attempt to fight inflationary pressures.
Yikes.
Despite the latest statements from Jerome Powell — who may pretend to remain optimistic on the future economic outlook — the probability of a “soft landing” for the U.S. economy is for lack of a better term … negligible.
Hyper-Financialization
Readers should take solace in the fact that the future economic outlook would have the potential to look even worse if the economy had for some reason become hyper-financialized over the course of the last three decades due to continuous monetary stimulus and financial market intervention during a historic period of disinflationary forces that are not repeatable.
Oh no.
Please excuse the satirical commentary, and join us in appreciating how truly epic the current macroeconomic circumstances are. Readers should do their best to come to terms with the fact that the world that they used to know is forever gone.
The four-decade stretch of positive real yields on U.S. Treasurys is gone.
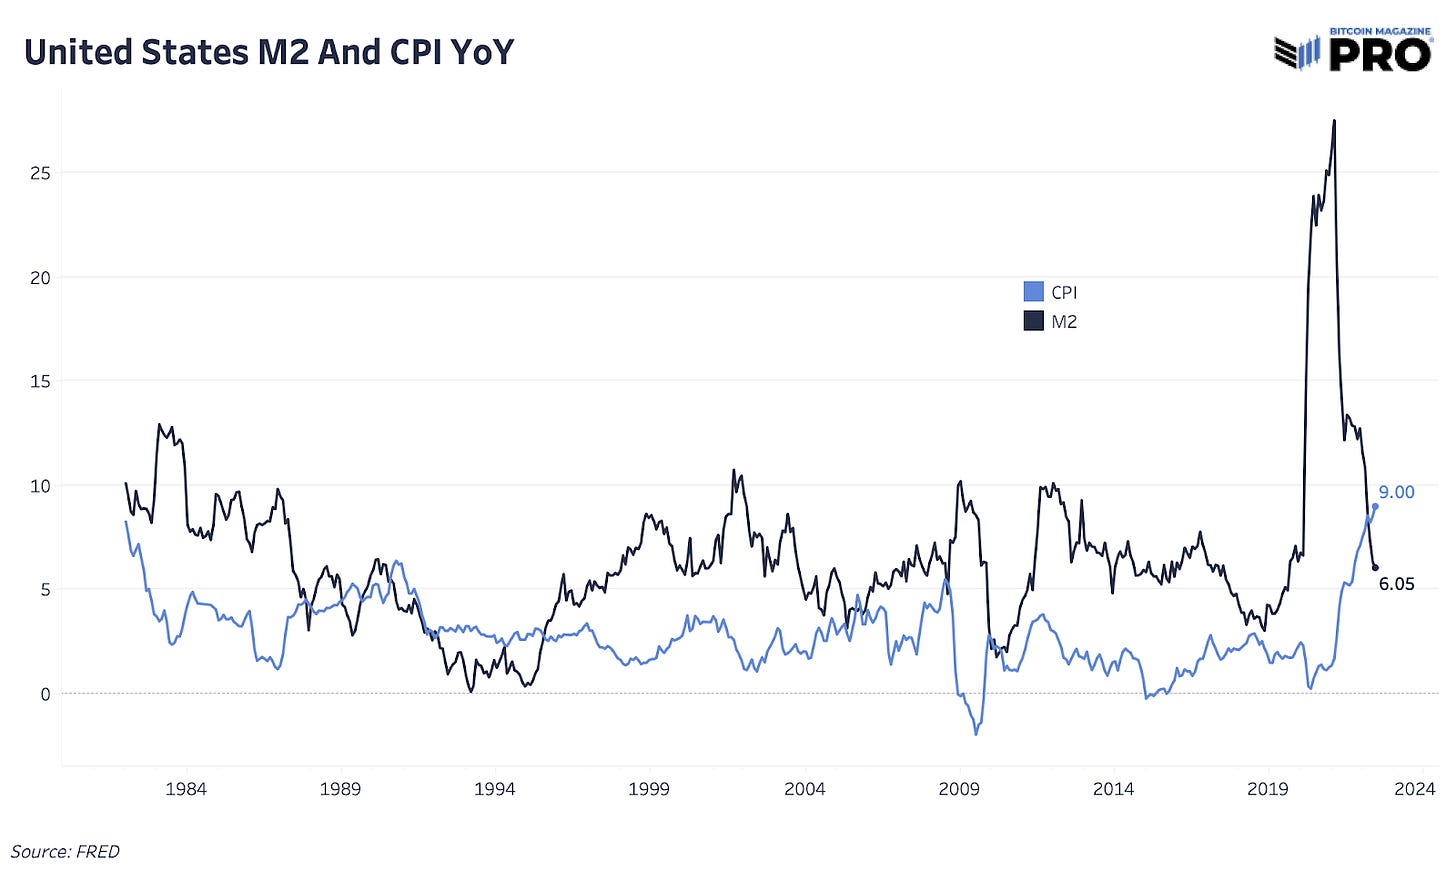
Why? Mainly, because decades of disinflationary forces in consumer prices aided by ongoing globalization are now reversing. Globalization, specifically the rise of China as an industrial superpower, allowed for disinflationary consumer prices in tandem with dovish/expansionist monetary policy, creating a once-in-a-generation asset boom in real terms. M2 U.S. money supply outpaced the growth in consumer price inflation for nearly four decades, and that has recently reversed.
The first two decades of the 21st century were characterized by disinflationary growth, where monetary debasement eluded consumer prices and nestled itself in financial markets. As commodity markets were flush with supply riding off the backs of prior decades’ CapEx cycles, and as technological gains and the offshoring of domestic manufacturing to emerging markets gave the world more for less, 2022 has introduced the sobering reality that inflationary pressures exist due to the limitations of real physical goods.
No amount of jawboning from Jay Powell and crew can easily fix the structural supply demand imbalances that exist in global energy markets, due to a variety of factors, of which a large contributor was the premature commitment to unreliable fossil fuel “alternatives.”
The Fed has a tool bag that contains only a hammer. Inflation is the nail, and the global economic and financial system is a hot air balloon currently 3,000 feet above sea level, with a rogue burner rapidly lifting the airship to increasingly unwelcome elevations. Jay Powell is the pilot, and his plan to softly land the balloon on the ground below is to simply pierce the balloon with the hammer and set of nails, and worry about the consequences later.
The “good news” about the situation is that it's a sure thing that the balloon will return to the earth.
The bad news is that no one really understands just how fast the pierced balloon will plummet towards the ground, or what the plan for landing safely is. Nevertheless, the balloon will land.
Enough of the balloon analogies, let’s assess the forward market for risk.
Equities
Equities were pummeled throughout the majority of 2022 before finding lots of relief in the month of July. Part of the upwards rally was a result of late shorts and hedges being squeezed and being forced to buy back into a relatively illiquid market.
It is important to understand that markets do not trade in a straight line, and previous bear markets in history had vicious rallies upwards that convinced a majority of participants that the worst was over, only to reverse and continue bleeding out.
In terms of valuation, the first leg down in this bear market was about duration: As yields screamed upwards on high and accelerating inflation prints, forward multiples on stocks (especially growth-oriented tech with large forward multiples to present earnings) rapidly repriced lower to reflect the changing yield environment.
The next risk factor for equity markets is the looming impact of an increasingly strong dollar relative to other currencies. A strong dollar has negative impacts on global growth, in particular due to the effects we covered earlier in regards to the world’s implicit dollar short position.
As the dollar screams higher, foreigners sell their domestic currency and/or USD-denominated assets for dollars, which can lead to increasing weakness in other currencies. The response from foreign central banks often is to tighten policy, constraining growth prospects even further, which in turn accelerates the global economic slowdown.
Similarly, for U.S. corporations who sell goods abroad, as the dollar strengthens, international sales suffer from decreasing levels of competitiveness compared to their foreign competitors who are pricing goods in the weaker currency.
Current projections for S&P 500 earnings per share growth for 2023 are estimated to be approximately 8% higher than the current projections for end of year 2022. History doesn’t repeat, but it often rhymes, and a look at historical recessions shows that earnings per share fell a median -34% in bear markets since the 1960s over the course of 17 months. While raging inflation may decrease the likelihood of decline in earnings per share (EPS) of the magnitude of -34% in nominal terms, the forecasts for forward EPS estimates look similar to the forecasts of falling inflation throughout 2021 and the projections of positive real economic growth during the early months of 2022.
It looks likely that a potential reversal lower in equity markets would be the result of earnings downgrades, rather than another dramatic move higher in yields, which characterized the first two quarters of 2022.
ISM Manufacturing
Deteriorating U.S. Manufacturing Purchasing Managers' Index (PMI) data is yet another reason to remain cautious on the forward performance of U.S. equities. Over the last two years, year-over-year performance of the equity market is strongly correlated with real-time ISM manufacturing data. Thus, if the trend is further weakness in PMI prints, there is yet another reason to remain cautious about the current upside in investing into equities currently.
The glaring remaining equity market risk factor over the intermediate term is credit risk. As liquidity dries up from the result of higher risk-free yields and slowing growth, liquidity and solvency risk begin to slowly build.
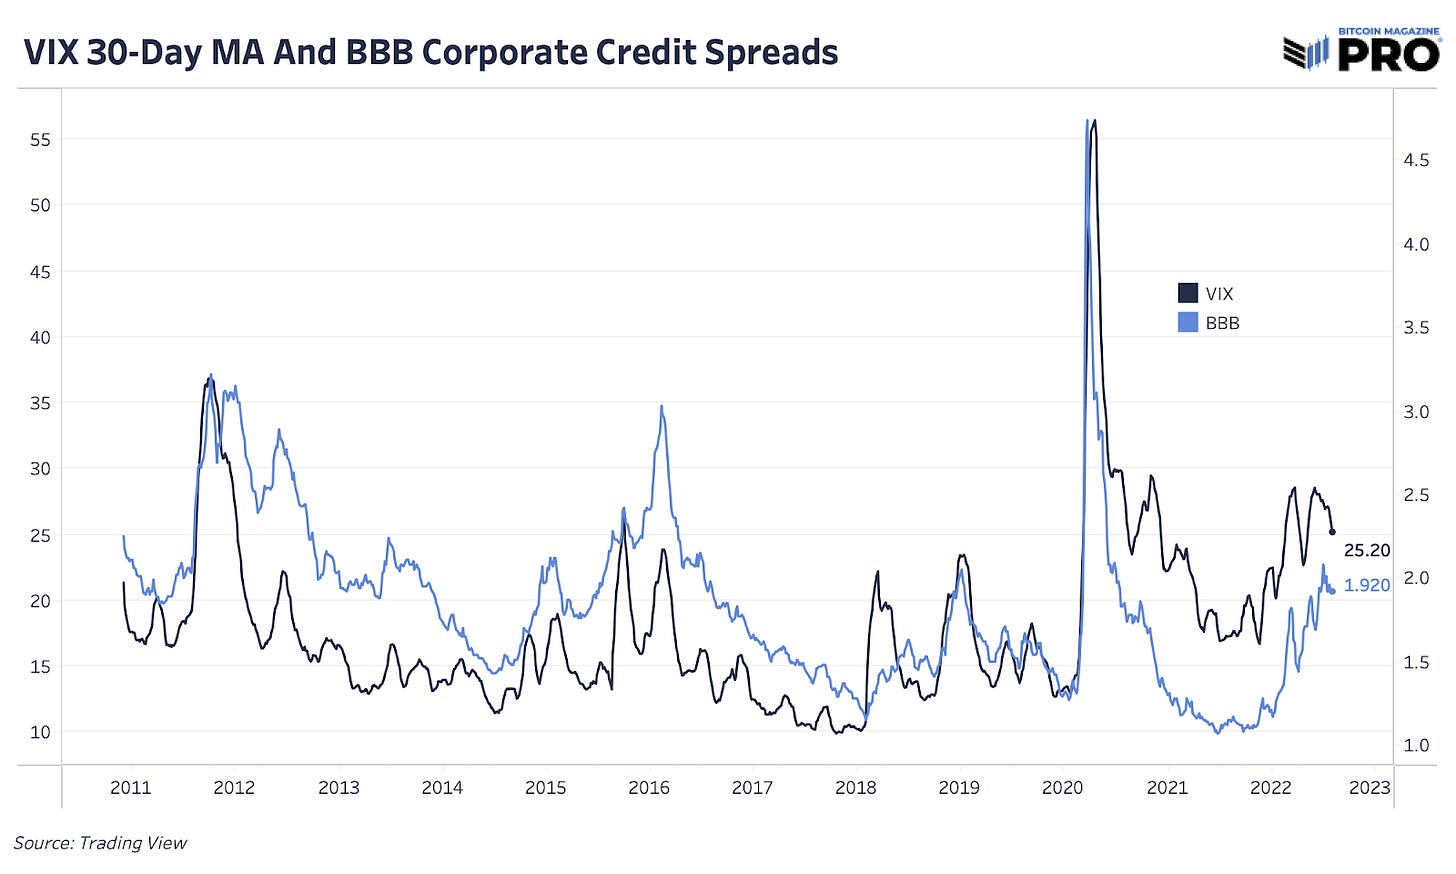
While the situation is not close to crisis levels of credit risk, corporate credit spreads (a measure of yield on top of the risk-free Treasury rate) have gradually been rising since 2021.
Additionally, a long-term chart of VIX (S&P 500 volatility index) and BBB-rated corporate credit spreads gently hints that credit risk could be underpriced at the current moment.
Illiquidity and Volatility
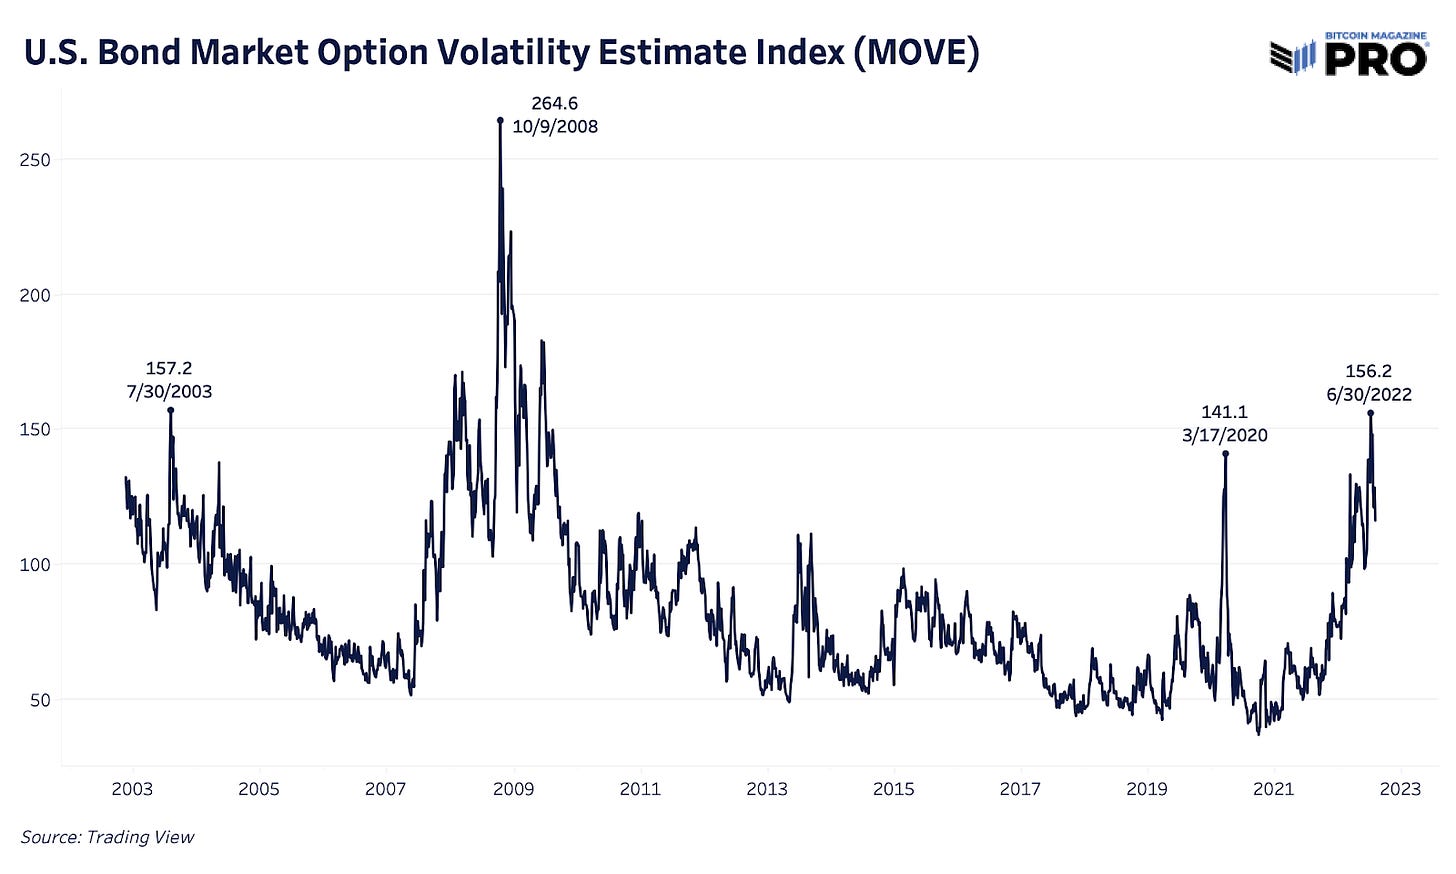
On the subject of volatility, it should be worrisome that the most liquid market (the U.S. bond market) in the world is as volatile as it was only during the peak of the 2020 market crash and the Great Financial Crisis. What breaks, how, and when, is anyone's guess, but what is known is that volatility breaks things in financial markets. Especially in markets with layers of leverage and opaque offshore derivatives.
It is entirely possible, probable even, that the bear market defining volatility event is still ahead. The cliche is “the Fed will hike until they break something.” Whatever that “something” is, expect volatility to accompany it.
The “Pivot”
The eventual pivot has been a rally cry for bulls for most of 2022, but when does it come, and what does it mean for the economy and risk assets?
As stated previously, the Fed (along with other global central banks) is currently embarking on one of the most aggressive tightening cycles in modern history. The effects are not able to be immediately priced into the market, as second/third order effects take time to fall into place.
Mentioned earlier in the piece and frequently by the officials at the Federal Reserve is the current tightness in the labor market. One of the biggest nightmares for a central bank is the thought of wage/price spiral, whereas workers with ample bargaining power can negotiate for higher wages which leads to a reflexive cycle of increasing prices and wages across the economic system, and once inflation expectations are anchored, they are extremely hard to break.
With this in mind, expect weakness in the labor market to develop, and whether explicitly stated by the Federal Reserve, this will be a welcome development.
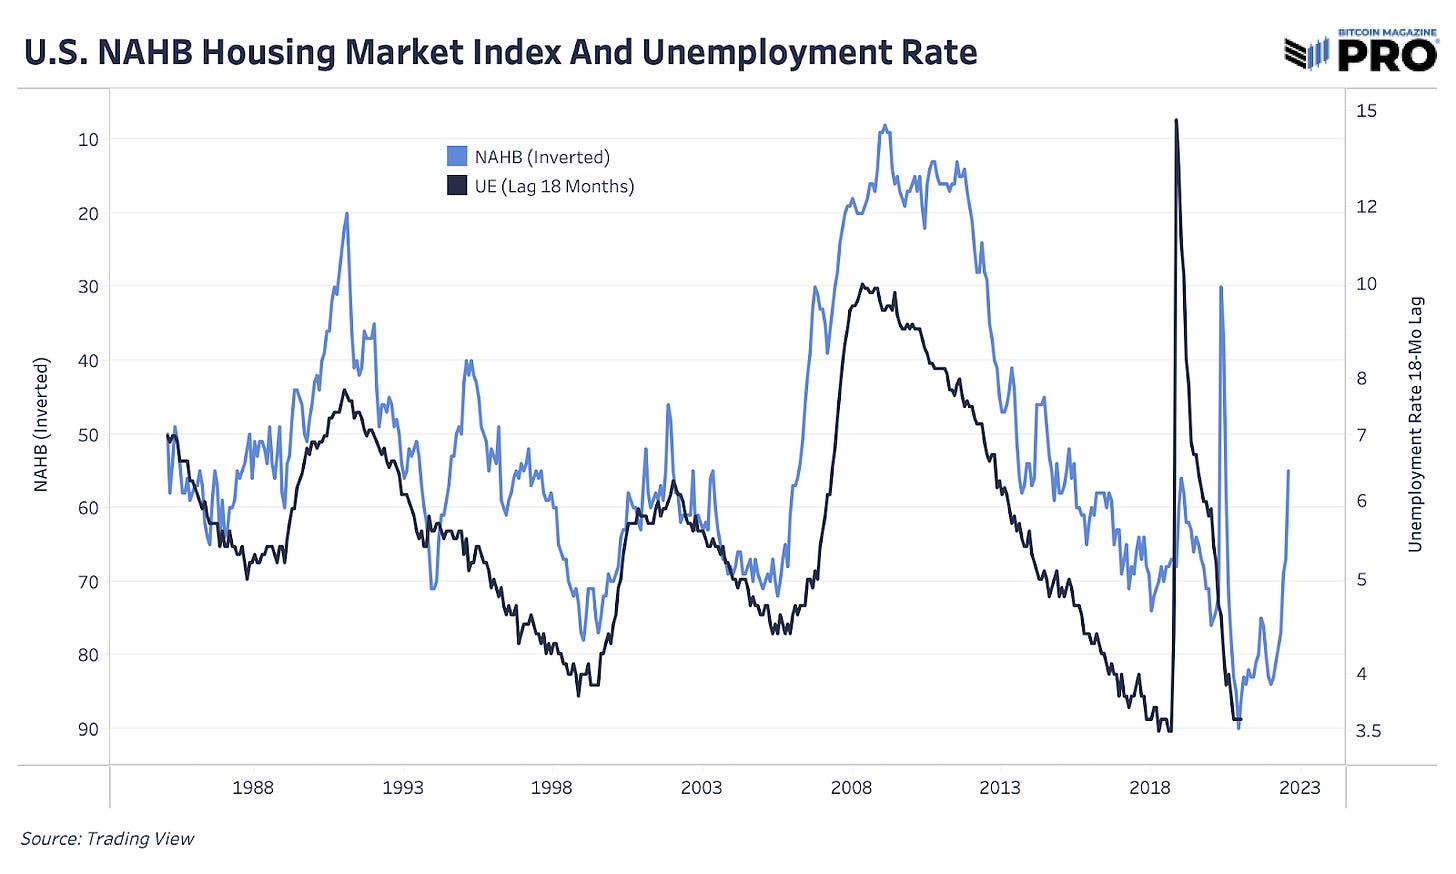
With this, it is reasonable to expect a cooling in a still very hot U.S. housing market. While it isn’t a direct cause and effect relationship between employment and housing prices, many variables of the business cycle are interlinked, and looking to historical relationships can be insightful for setting expectations for sector-specific strength and weaknesses. Traditionally, weakness in the housing market, which is just beginning to materialize, leads an unemployment cycle within approximately 18 months.
Turning back to the policy of central banks, with particular focus on the Fed, we once again would like to return to the big idea that this late into a long-term debt cycle, most assets are indeed all the same trade.
The scary realization being made by an increasing amount of global investors is that what once were extremely improbable tail risks for the global economic system are now looking like increasingly binary outcomes over the intermediate to long term.
While the graphic may seem hyperbolic, on a long enough time frame it is truly this simple from an investment framework. An objective way of playing the investing “game” in regards to the increasingly binary set of long-term outcomes would be to hold and accumulate dollars during periods of net monetary tightening, which are used to acquire quality long-term assets during volatility spikes and periods of market illiquidity.
A useful graphic for investors visualizing the central bank monetary policy cycle is shown below, displaying assets on the balance sheets of the Fed, People's Bank of China, The Bank of Japan and the European Central Bank in USD-adjusted terms.
Sell dollars when liquidity is being aggressively added to the system, and accumulate dollars when liquidity is being pulled out. And given historical precedent, there will be a brief period of time where markets are still relatively cheap after the announcement of such a pivot in policy where investors will be able to aggressively allocate in preparation for the re-injection of liquidity before the effects have begun to be felt by markets.
Similar to the pane of charts above, a fascinating observation is made when comparing the performance of the S&P 500 from Q4 2008 to today in nominal USD versus adjusting for central bank debasement:
SPX performance since Q4 2008:
In nominal USD terms: 211%
In (currency-adjusted) aggregate central bank balance sheet terms: -29%
What if the period post-Great Financial Crisis wasn’t the longest uninterrupted bull market in risk assets in modern history because economic prospects were so rosy, but rather because global central banks debased currencies against financial assets and were able to hide behind structural disinflationary forces while doing so?
Introducing: Bitcoin
While this report has thus far focused entirely on macroeconomic factors, there is ultimately a
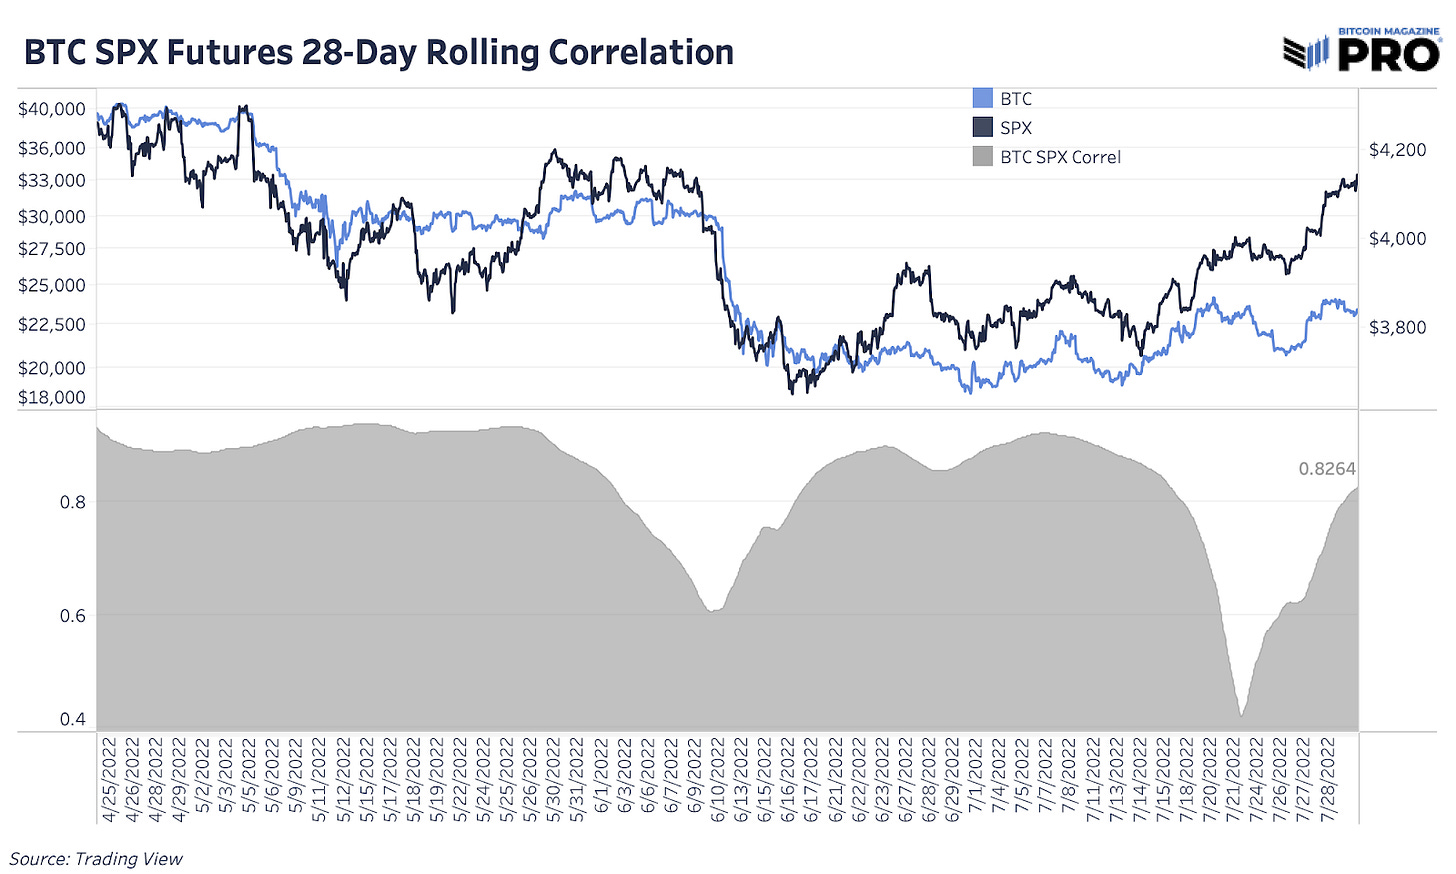
method to our madness. Bitcoin, which has maddingly traded like an SPX (S&P 500) derivative for much of 2022 (or said alternatively, a 24/7/365 inverse VIX) is the ultimate solution to the monetary monstrosities created, enabled and maintained by central bank largesse.
While bitcoin has been treated as a long-duration risk asset throughout much of 2021 and 2022, immediately reacting negatively to surprisingly high inflation readings, we believe that bitcoin stands to emerge out of this recession stronger, more resilient, and less susceptible to exogenous shocks than ever before.
Here’s why:
The bitcoin and broader cryptocurrency market just absorbed the largest amount of indiscriminate forced selling in bitcoin’s storied 13-year history. As a result of the forced selling from some of the industries largest market participants, bitcoin once again for the fourth macro cycle in a row fell below its realized price, by definition placing the average holder’s position underwater from acquisition of the original acquisition price. In bitcoin cycle terms, that is about as pure of a capitulation-type event as can occur.
However, given the nature of the strong correlation between bitcoin and broader risk assets, it would be shortsighted to call for a return to macro bull market conditions immediately. Rather, it is our belief that risk assets are in the middle of a long overdue mean reversion bounce, as speculators on the short side of the market for both equities and bitcoin aggressively hedged at the lows, and just by the nature of a small rotation into risk by those on the sideline caused markets to drift upwards in meaningful fashion.
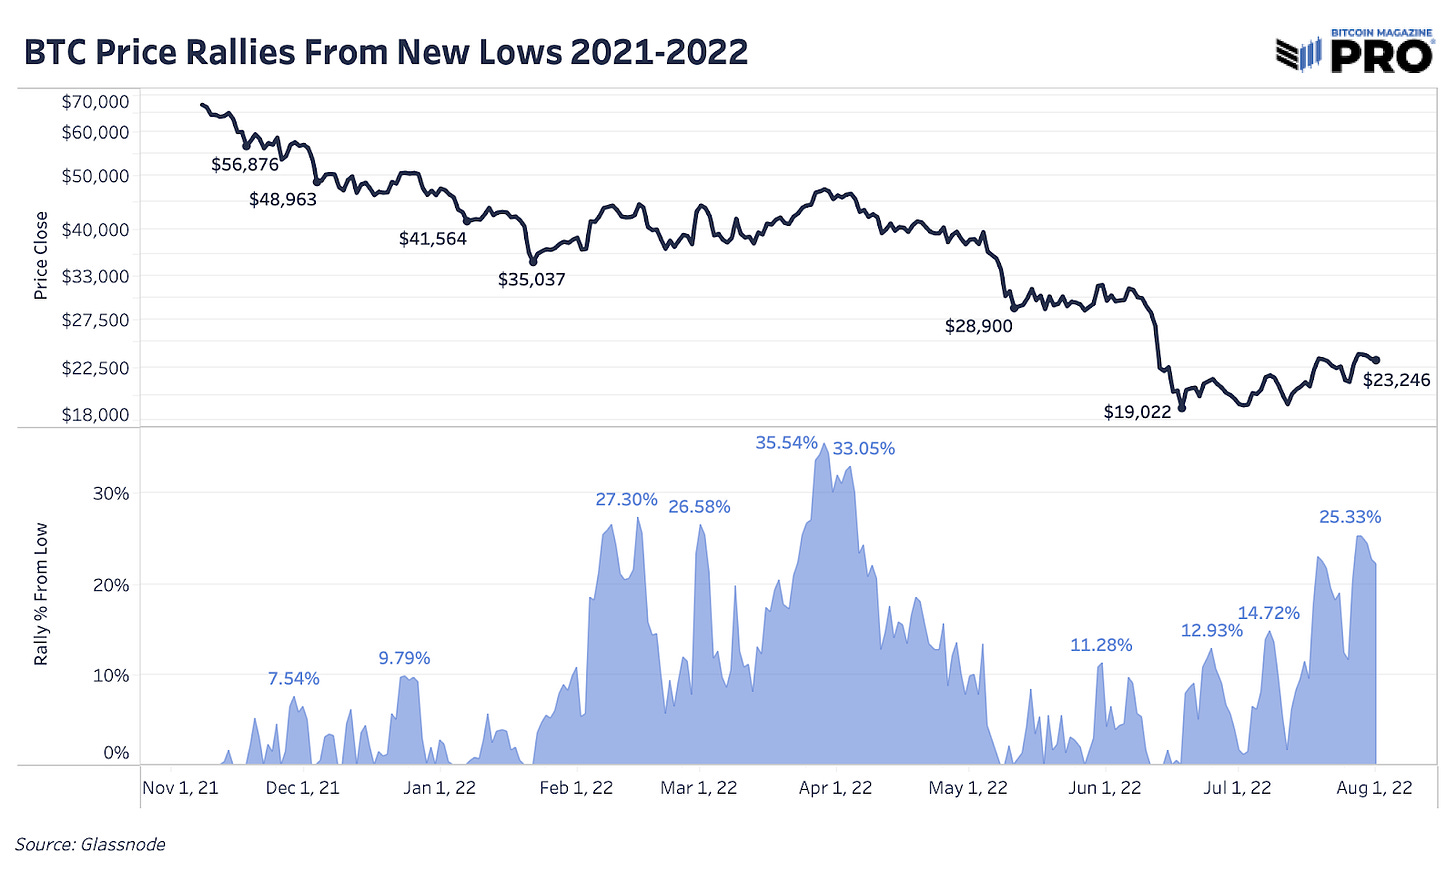
However, the technical rally in risk looks to be losing steam, and the harsh realities of the current macroeconomic environment are still front and center. We previously analyzed bear market rallies in bitcoin and equity market cycles to give readers historical context to the size and timeframe of bounces in bear markets. The latest price rally over the last few weeks reached 25.33% from the daily close bottom so far.
The sheer size and speed of the move often fools market participants into thinking the worst is over, just before markets roll over and sell off again.
For the market participants who believe that the slight change in tone during last week’s FOMC conference qualified as a pivot, we believe this to be false. The effect of the policy action is still new tightening, even if it was expected by the market, and the idea of an economic soft landing amidst all of the geopolitical and economic upheaval looks to be hopeful, at best. With volatility in equity markets recently becoming the most oversold since late March of this year, we think the next stage of risk-off in global markets could be soon approaching.
In our view, there will be another significant volatility event before the arrival of a long-awaited Fed pivot, and in that case, we advise readers to have a cash allocation ready to buy blood in risk assets if/when it arrives.
While the timeline cannot be known with any amount of certainty, we expect the current regime of monetary tightening to end in a landing that is anything but soft, and for the response from policymakers to once again be the only thing they know how to do.
Further debase the value of government currencies in an attempt to keep the global financial system “functioning properly.”
If, but most likely when, the moment of peak fear and volatility arrives, understand that the fastest horse on the other side of this debt cycle will likely once again be an immutable absolutely scarce monetary asset.
The separation of money and state was never going to be a smooth nor orderly transition.
Prepare your portfolio for an increasing amount of chaos and volatility, and understand that a contraction of economic activity and/or a short squeeze on an inflationary government currency changes nothing about the long-term inertia of the value of all fiat ‘backed’ money.
Seemingly every cycle, both to the upside and to the downside, the Federal Reserve, tasked with an impossible job of centrally coordinating monetary policy for a majority of the world’s wealth (if not directly then indirectly), is caught entirely off guard by some exogenous shock or previously unbeknownst factor.
The result is a firesale for global risk assets and an ensuing response that shocks and awes markets the other way. It is likely in our view that this time isn't different.
Thank you for reading Bitcoin Magazine Pro, we sincerely appreciate your support! If you enjoyed this monthly report please leave a like and let us know your thoughts in the comments section. We think this is some of our best work to date, and we would appreciate hearing any feedback our audience has!


