Global Liquidity or Halvings, Which Create Bitcoin Cycles?
Global liquidity is rising according to several analysts, but is it really? Unfortunately, that doesn’t match what we are seeing in safe haven assets.
Topics this week
Bitcoin and global liquidity
Price analysis into the end of the year
Liquidity Cycles and Bitcoin
In this post I’ll examine claims about the global liquidity cycle turning positive and offer a few counterpoints that hopefully can provide some deeper insight.
Liquidity can mean several different things. First, liquidity can refer to spreads and depth of markets. A market has high liquidity if the spread between asks and bids is small, as well as having enough depth to absorb typical market action without much movement in price. Second, liquidity can refer to the level of money in the economy, most often measured by global M2. The higher M2, or the greater the rate of growth of M2, the more smoothly economic activity can function. If M2 is shrinking, money will be tight and liquidity will be low. Lastly, liquidity can refer to the ease of money flow in the financial plumbing, like repo and the collateralized movement of money in the global financial system.
Understanding liquidity helps us understand where bitcoin price is headed. The standard view is that as global liquidity rises, “risk-on” assets like stocks and bitcoin should benefit relative to “risk-off” assets like cash and government securities. However, being the independent-thinking bitcoiner I am, I believe most of these measures of liquidity are actually backwards. More on that later.
Several macro shops and analysts have started talking about the reversal in global liquidity, from tightening to expanding. They tend to use proprietary composite formulas for liquidity, so we cannot evaluate them directly.
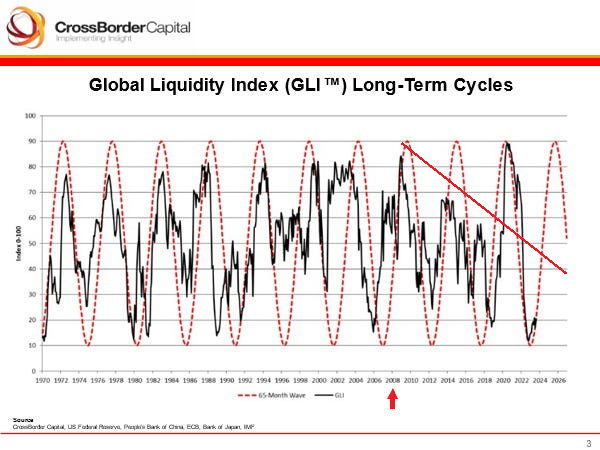
Source: CrossBorder Capital
Micheal Howell of CrossBorder Capital was recently on the Blockworks podcast and when asked what he means by liquidity he said, “global liquidity is the flow of money through global financial markets.” The main driver in their model is ease of funding and debt rollover enabled by balance sheet capacity. In their model, liquidity has bottomed and this should lift stocks and bitcoin to the point of perhaps even avoiding recession.
We don’t know what is in their liquidity formula, but I do want to point out, even by their measurements, something changed in the Great Financial Crisis (GFC). That is a critical period in the generational credit boom and bust. In the GFC, we entered the global bust. The only deviation in their chart was the extraordinary intervention during COVID, which was temporary and quickly reversed to new lows.
Source: CrossBorder Capital highlights added
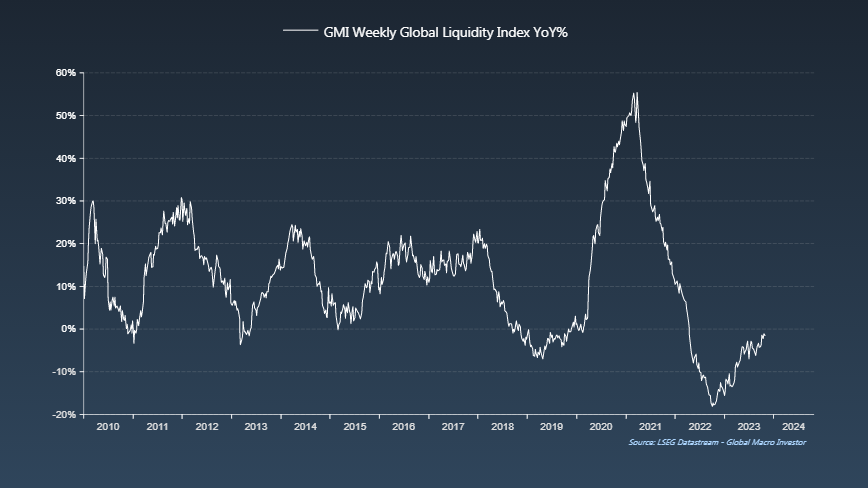
Next up, Raoul Pal of Real Vision and shitcoin fame, has the Weekly Global Liquidity Index also turning upward and positive. Again, he implies that when this rises, risk-on assets such as bitcoin should benefit.
Source: RaoulGMI
We can see a similar pattern to CrossBorder Capital: There is an obvious downward bias since the GFC of lower highs until COVID. After the extraordinary spike in liquidity, it fell again to new lows.
Tradingview provides two indicators of liquidity. Global Net Liquidity is composed of the balance sheets of central banks, namely the US, China, EU, Japan, and Great Britain, plus Fed Reverse Repo totals and the Treasury General Account. Global M2 consists of M2 supply of 21 currencies. The claim is that it is global liquidity that controls bitcoin’s cycles, and not the halving.
There is an obvious relationship of some sort here. There is a very tight correlation from 2017-2022. Prior to that, the relationship is less obvious and in 2023 “liquidity” is down while bitcoin is up. Also, 2020-2021 saw the largest rise in these global indicators, but the smallest bitcoin cycle. Lastly, liquidity rose prior to the halving in 2020, but bitcoin didn’t start its late-2020 rally until after the halving.
Liquidity or Halving
I do not deny the existence of global market liquidity or its massive effect on prices. However, I think these measures are capturing second order effects, not primarily liquidity. Therefore, the conclusion we are supposed to draw, that global liquidity is the reason for bitcoin cycles, as represented above, is directionally wrong.
To help illustrate what I mean, let’s think of Milton Friedman’s Interest Rate Fallacy. It says, yields fall because money HAS BEEN tight. Notice the direction: Past conditions create present conditions, and present conditions, not central planning, create future conditions. The above theories of liquidity have the formation process of global liquidity backwards. They imply that deficit spending and expanding central bank balance sheets create liquidity, when the fact is those things are byproducts of illiquid conditions. Consider the fact that fiscal and monetary interventions expand in response to recessions.
Larger central bank balance sheets do not mean higher liquidity, they mean lower growth and credit creation potential. As for M2, velocity is a much better proxy for liquidity. Below, we can plainly see that as M2 rises, velocity declines, because nominal GDP is relatively constant. In other words, as M2 is rising, liquidity is declining.
Source: FRED
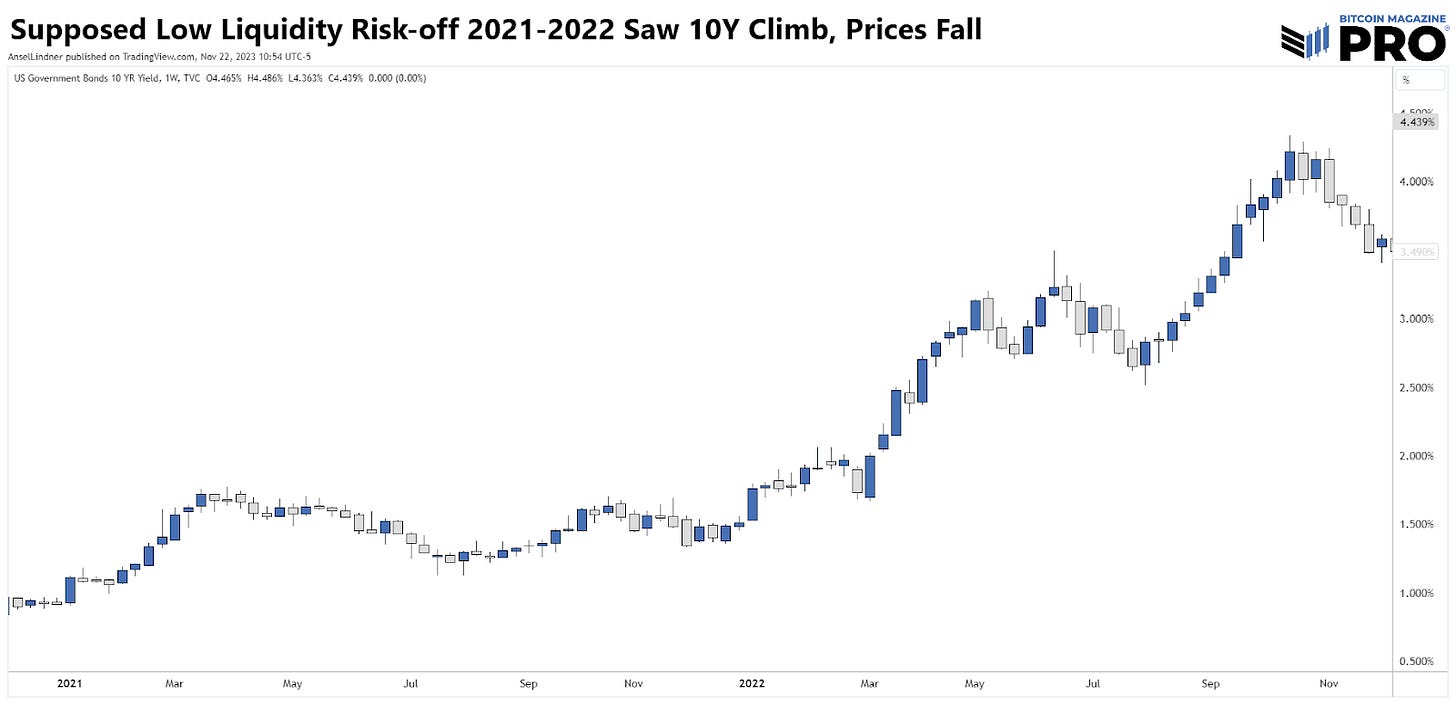
Last counterpoint: Using velocity instead of M2 for liquidity also matches with the risk-off asset side of the trade. If liquidity is rising, safe haven asset prices should decline as money moves from risk-off to risk-on, but we don’t see that. Not only was the 10-year Treasury yield rising (prices falling) during the time of supposed risk-off conditions in 2021-2022, but now the 10-year Treasury yield is falling (prices are rising), down 11% since October 23. Exactly the opposite of what we would expect.
Why is this clarification important? First, it disproves the call for rising liquidity being the primary mover of bitcoin. The halving remains the primary cycle catalyst. Second, it is part of a holistic Bitcoin thesis, and allows us to more accurately forecast broad market moves and understand bitcoin’s place in all of it.
Bitcoin Price
The short-term direction for price could be lower heading into the end of the month. The channel has been the dominant factor over the last 4 weeks, but now a textbook-perfect head and shoulders is forming. Price did close outside the channel, but has retaken that pattern. Once again, $35,440 is the important level to watch.
Bitcoin does have a history of selling off over holiday breaks. IF that is the case, there is a cluster of attention grabbing indicators consolidating around $32k, making it a great place to set bids.
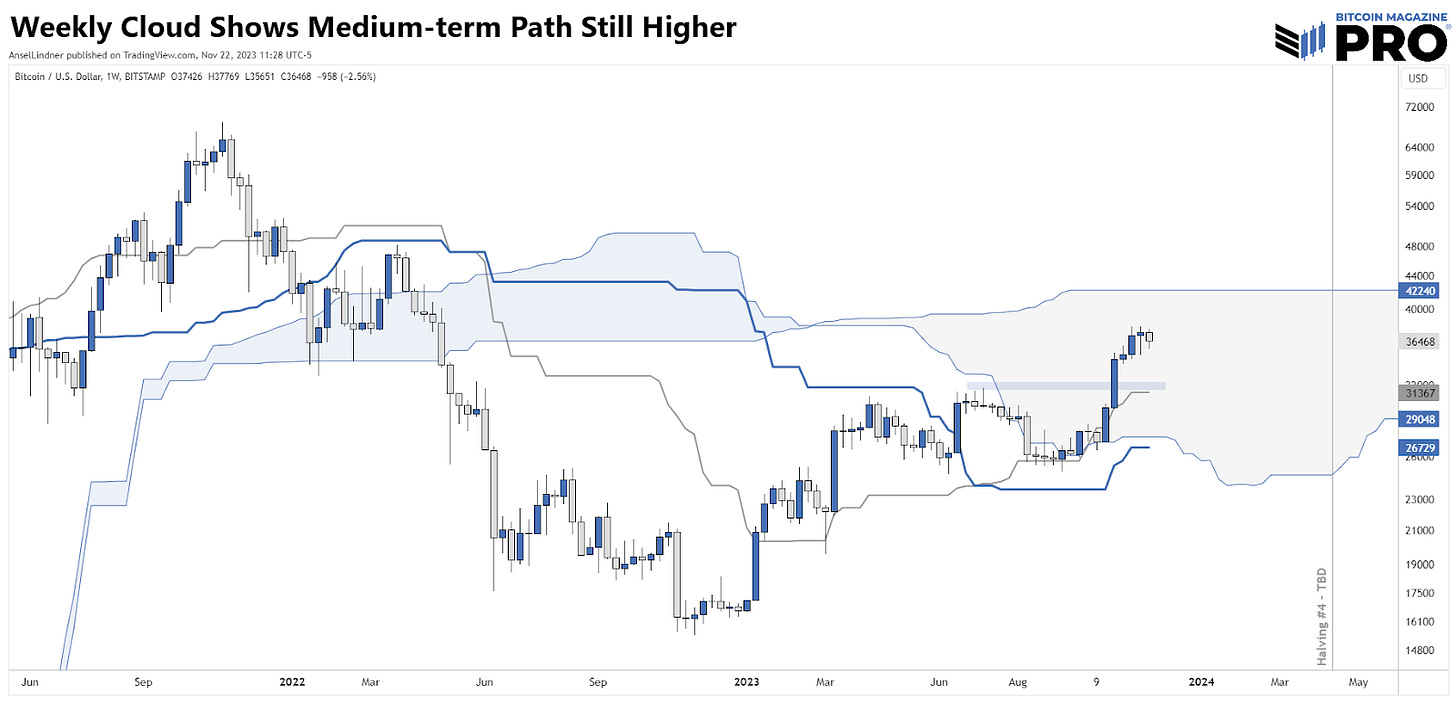
Zooming out to the weekly medium-term timeframe, we can see the progress price has made in the Cloud edge-to-edge trade (up to $42k). Any minor sell-off to $32k will not break the overall bullish trend. December is setting up to be quite the positive month, as ETF rumors will again pick up pace, while the deadline looms.


You provided your reasons for why you don’t think liquidity is the driver, but you did not provide the reasons for why the halving is - in your opinion - the driver. Can’t be supply driven as the new emissions are now so low that even when 100% are sold per day they have insignificant impact on price at 900 new bitcoin per day today and soon to be only 450 per day after the halving. The halving by itself does not drive price or necessarily even purchase/sale behavior. In your opinion is the belief that a pattern will be repeated that in itself via confirmation bias drives behavior? While there is correlation, I still do not think there is sufficient causation. So let’s see how this cycle plays out and maybe we will both get some deeper insights in =to what drives the price of bitcoin :-)
How does a halving create scarcity? There are already 19.5 million bitcoin in circulation, and emissions will continue until we reach 21 million. The halving does not create more scarcity, it simply decreases (minimally) new supply issuance, which going from 900 bitcoin per day to 450 bitcoin per day has little if any impact on actual liquid supply. The risk with FOMO is that reality sets in and most bitcoin investors have now been through a few of these cycles. I think we have transitioned to an institutional cycle, which will be very different than prior cycles and likely break the halving to bitcoin price cycle correlation for ever.