BM Pro Charts Update
Today, we want to try out a new format of posting many of our updated custom market charts with no writing or commentary. Below are the charts and some explanations for each. All charts are updated as of today, including the most recent daily value for April 12. This is a format and premium subscription feature we’re looking to deliver every week on Wednesdays if subscribers find it valuable.
For these updates, let us know if there are other charts you would like to see included on a regular basis.
If you have any issues viewing this post through e-mail or mobile, you can view the full post on Substack here.
On-Chain/Cyclical Indicators
Mayer Multiple
The Mayer Multiple, named after bitcoin pioneer Trace Mayer, is an oscillator that calculates the ratio between current price and the 200-day moving average. While one of the most simple cyclical indicators, it is one of the most effective at displaying how cheap/expensive bitcoin is relatively.
Reserve Risk
When Reserve Risk is high, confidence is low (HODLers dumping) and price is high, risk/reward is skewed to downside. When Reserve Risk is low, confidence is high (HODLers not selling) and price is low — risk/reward is very attractive.
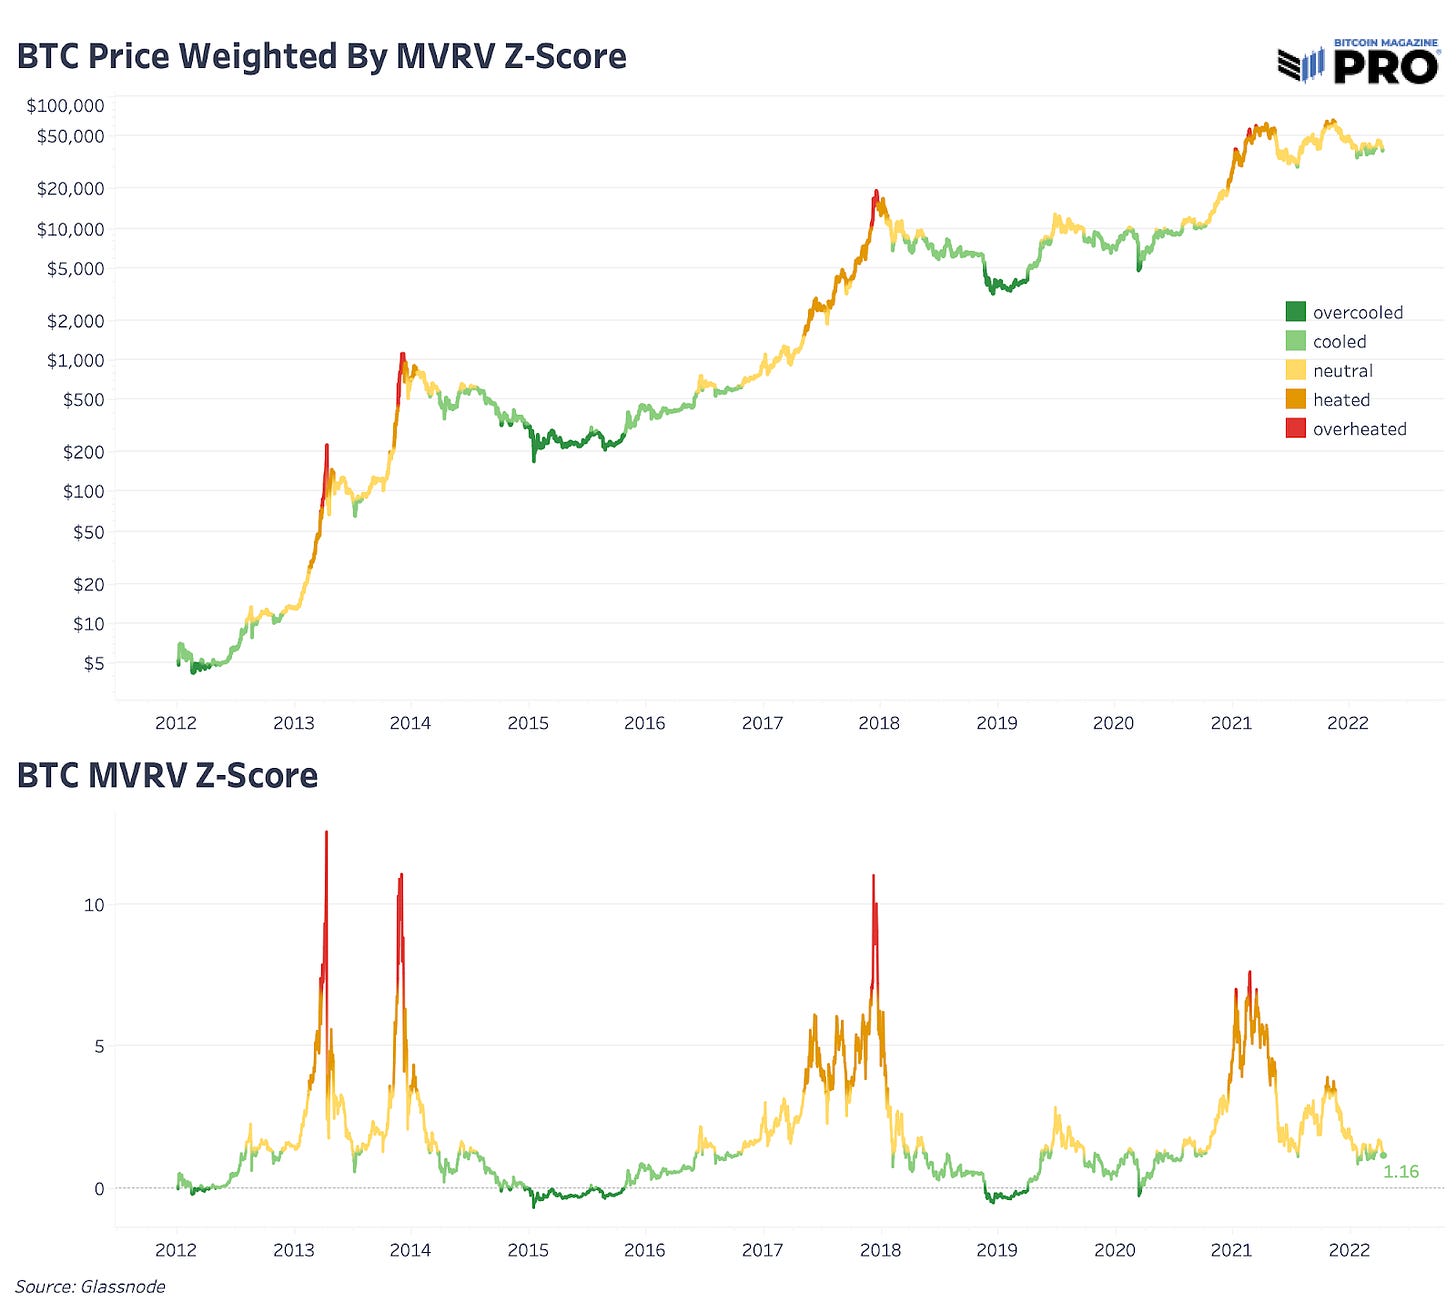
Market Value Realized Value (MVRV) Ratio
The MVRV Ratio is a ratio between the price of bitcoin and the average cost basis of all coins on-chain, called the realized price. MVRV Z-Score calculates the standard deviation of this metric for a cleaner signal.
R-HODL Ratio
The R-HODL Ratio (short for Realized HODL Ratio), takes the ratio between the 1-week and 1-2 year Realized HODL bands. In layman’s terms, it takes a ratio of the market cap of coins that have moved within the last week against those that haven’t moved in over one year but less than two. While this may seem like somewhat of an arbitrary indicator, during market tops, many old coins change hands at a very inflated price, vastly skewing the metric to the upside.
90-Day CDD
Coin days destroyed (CDD) is calculated by taking the number of coins in a given transaction and multiplying it by the number of days it has been since those coins were last spent. By aggregating CDD over a daily time period, we can see how old the coins being spent were. By applying a moving average or rolling sum to the figure, you can display whether bitcoin is in a relative accumulation or distribution phase.
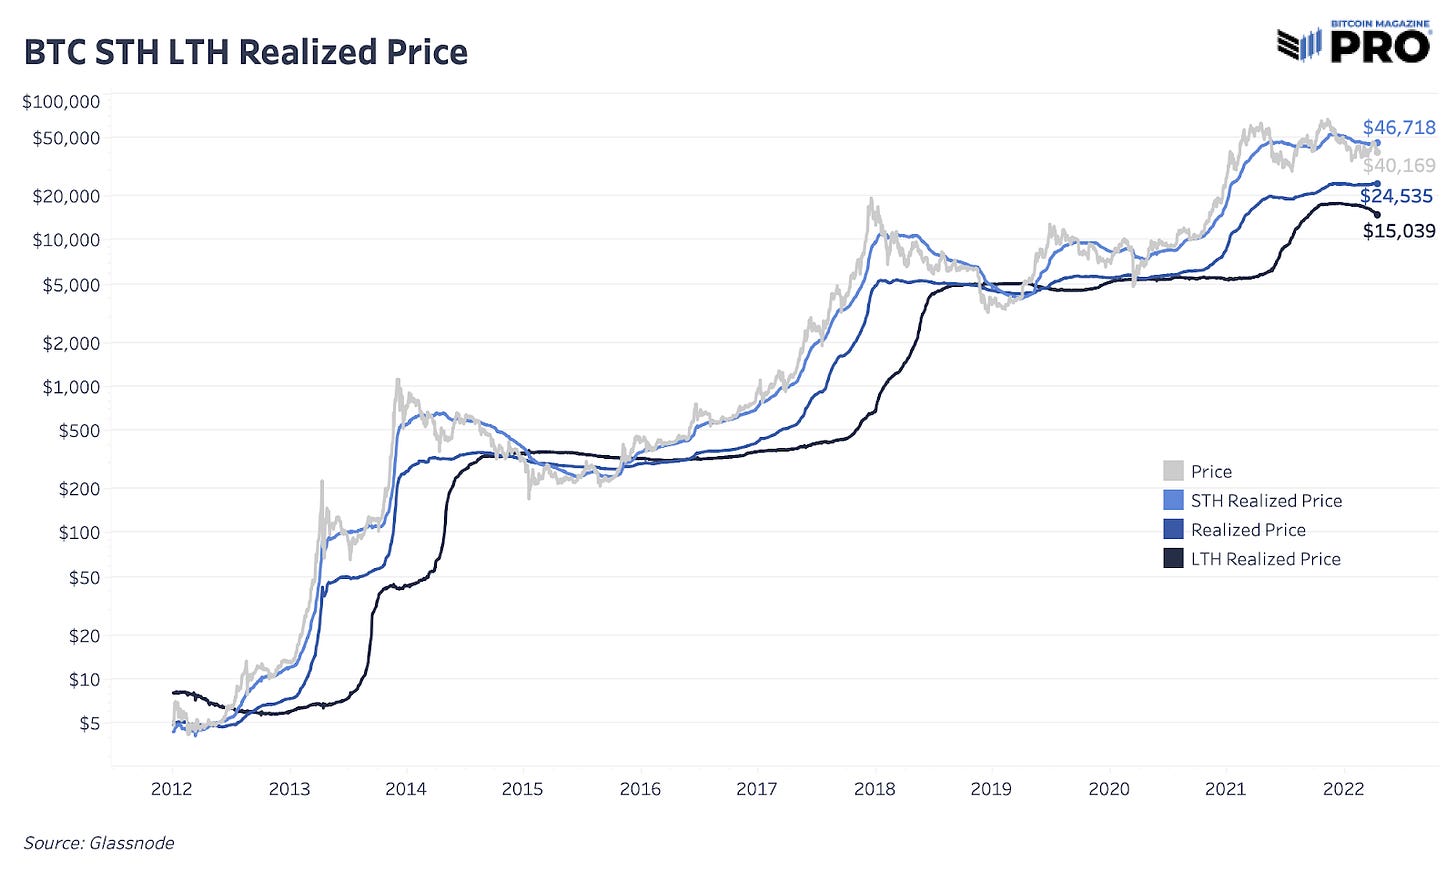
STH LTH Ratio
Ratio of the cost basis of short-term holders (STHs) vs long-term holders (LTHs). When trending upwards, the cost basis of STHs is appreciating relative to that of LTHs, a bullish market dynamic. When trending downwards, the cost basis of STHs is falling relative to that of LTHs, a bearish market dynamic. The STH LTH Ratio is historically one of the most accurate signals in a bitcoin market cycle.
STH MVRV
Short-term market value to realized value. A key dynamic of a bull/bear market is whether short-term holders are above/below their average cost basis. When above, new money has to competitively bid up price to secure an allocation; when below, underwater positions capitulate and redistribute.
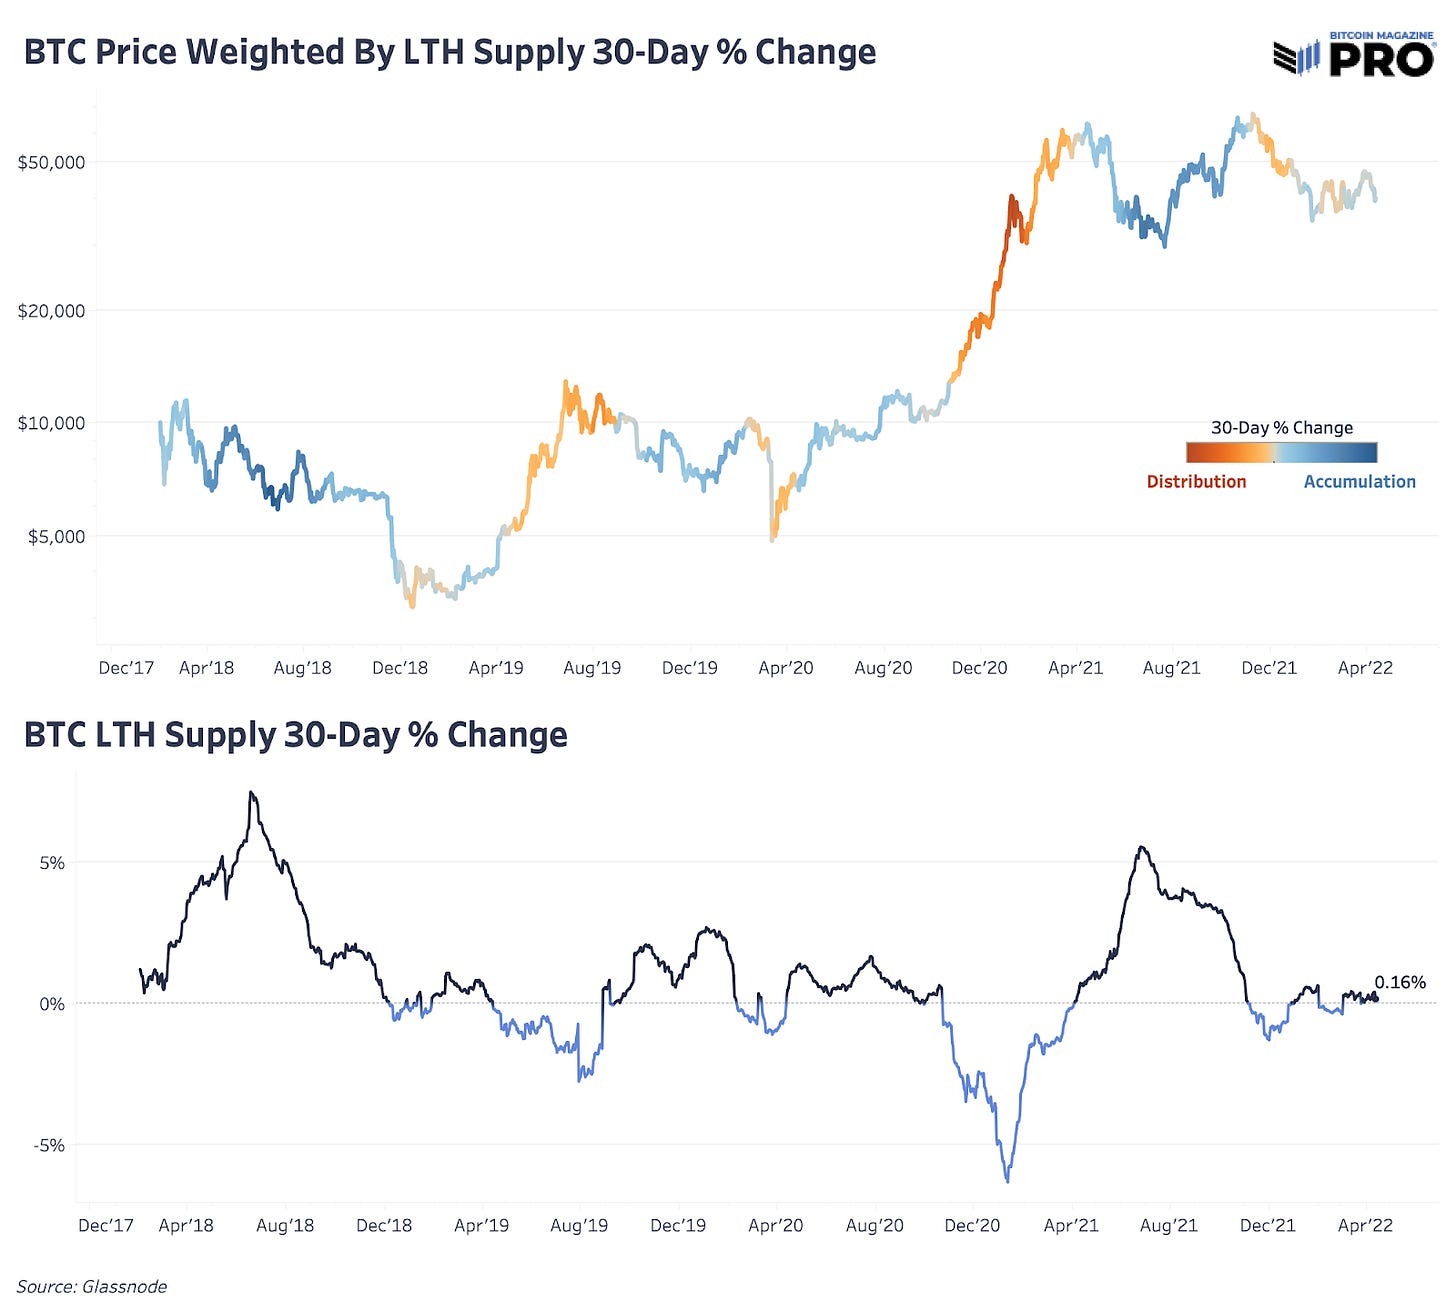
30-Day Percentage Change of Long-Term Holder Supply
30-Day Percentage Change of Supply Held by Whale and Retail Entities
Derivatives Markets
Perpetual Swaps
A futures contract that never expires but just rolls over every eight hours. Created by Arthur Hayes, founder of BitMex. The perpetual swaps funding rate is a periodic rate that is paid between longs and shorts based on the relative positioning of the perpetual swap market relative to a spot index price. Positive funding rates mean longs pay shorts, and vice versa. Funding payments are paid every eight hours.
Open Interest
The amount of bitcoin in contracts outstanding (always an equal amount of longs and shorts).
Percent Futures Open Interest Crypto-Margined
The collateral makeup of the bitcoin derivatives market. Mostly collateralized with bitcoin and stablecoins, though some derivatives exchanges allow for the use of less liquid altcoins as collateral, but increasingly stablecoins are the most dominant use of collateral in derivatives open interest, followed by bitcoin.
Exchange Flows
Rolling 30-Day Sum of Exchange Inflows/Outflows
Bitcoin Mining
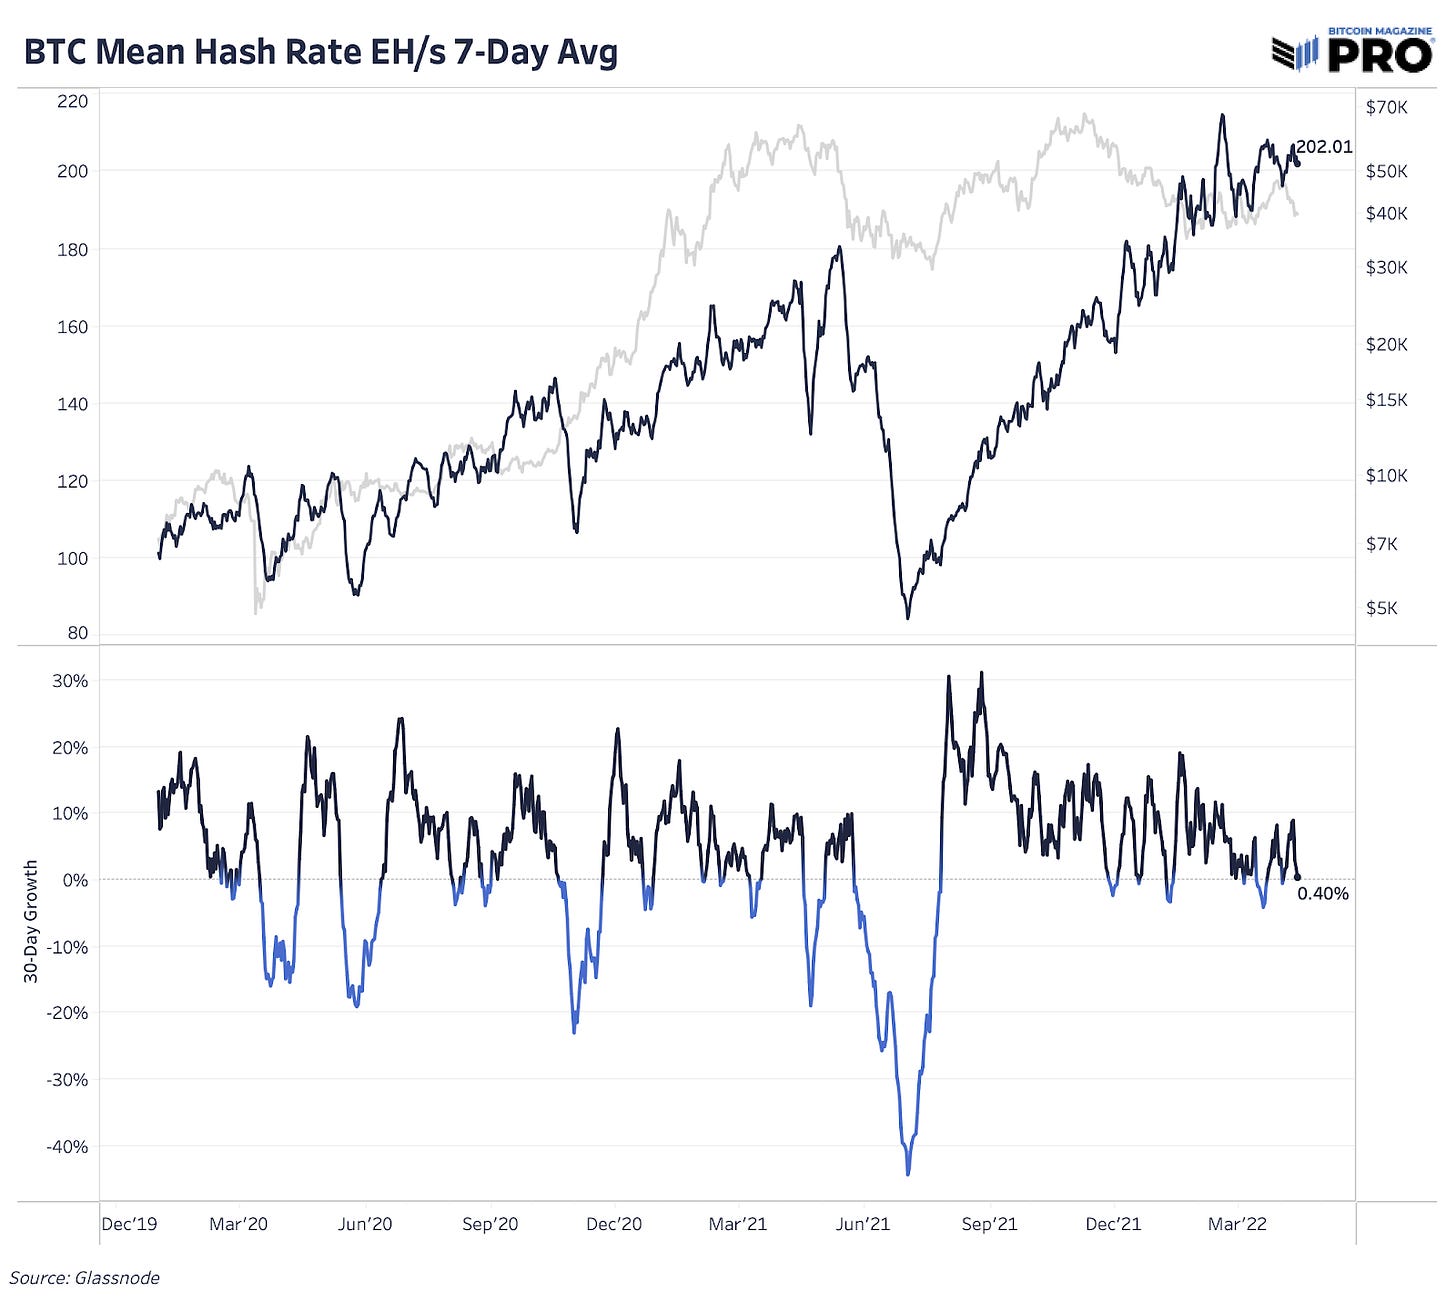
Hash Rate
Mining Difficulty
Hash Price
Calculated as miner revenue over hash rate, a key measure of relative miner profitability. Hash price is in a long-term downtrend as mining continues to become increasingly competitive.
Puell Multiple
The daily issuance value of bitcoin (in USD) divided by the 365-day moving average of daily issuance value.


these are great - and the quick background reminder to each is appreciated as well
this is exactly what we needed. definitely please keep sending it. thank you.