Bitcoin Flows Fuel Breakout as Recession Process Continues
Bitcoin ETF Inflows Stabilize, Price About to Breakout, and SLOOS Report on Credit
The bitcoin price has been miraculously stable since the beginning of December. In today’s post, I will update you on the ETF flows and bitcoin price. Then I will use the recent Senior Loan Officer Opinion Survey from the Fed to discuss where the macro environment is going, and how it will affect Bitcoin.
Bitcoin is now firmly part of the global economy. It is currently a $850 billion force, and if this bull market results in a conservative 5x in price, bitcoin will be a $4 trillion force. Every nation on the planet must have a Bitcoin strategy. El Salvador and Argentina are leading the way with very friendly policies. It seems the EU is trying to offer a draconian alternative in the form of a CBDC in a desperate attempt to maintain control. The US has its anti-bitcoin forces but the Federal Reserve is blocking the CBDC objective, while Wall Street is embracing bitcoin.
The US is taking a market approach for the most part. The strategy is coming from behemoths like BlackRock and Fidelity, whose ETFs have now acquired a combined $5.8 billion in bitcoin (140,000 btc) in less than one month of trading. I highlighted the last 8 trading days that have all been positive net inflows.
Last week, I estimated that for early estimates for total 2024 inflows of $10 billion made by Galaxy Digital and Bloomberg analysts to be hit, the ETFs would need to have $40.8 million/day. Through 18 trading days, that average is $86.6 million including GBTC’s outflows. Important to remember however, that as price goes up, demand goes up. When price eventually succumbs to the constant buying pressure of the ETFs, this will only cause more buying pressure.
Below, I overlaid the price on the flows chart. You can see on January 29 and 30, when price looked like it might break out, the inflow increased, supporting the idea that higher price will drive yet higher demand. It’s a feedback loop which you want to be in front of.
Bitcoin is currently stuck in the $42-43,000 range, however, a breakout might be in progress at the time of writing. Below, I included both the 50-day exponential moving average (EMA), along with my normal 50-day simple moving average (SMA). The SMA is the more commonly used Schelling point, and the EMA is typically used for identifying trend changes more quickly, since it gives more recent prices more weight.
As you can see, price has weaved above and below the 50 SMA while finding support from the 50 EMA. Not counting today, the price has closed 6 days above and 3 days below the 50 SMA in the last 9 days. This favors a bullish outcome of this consolidation. There is also a tightening of a triangle pattern that we are currently moving above.
Senior Loan Officer Opinion Survey
The Senior Loan Officer Opinion Survey (SLOOS), published quarterly by the Federal Reserve, is one of the most important sources of data we have in the modern financial system. Contrary to conventional wisdom, money printing happens in the private sector and the shadow banking system of rehypothecation. Apart from market interest rates, the SLOOS is one of the only windows into this world of money creation.
SLOOS data comes via tightening or loosening lending standards and rising or declining demand for loans. The categories of loans covered are commercial and industrial loans, commercial real estate, residential real estate, and consumer loans. Across the board, lending standards are tightening and demand is falling. This means NET credit creation (new loan amounts relative to amounts being repaid) in the private sector –– the real source of money printing –– is pointing toward radically slower economic activity headed our way.
Let’s take a look at several of their charts. The first is the most commonly seen in macro circles: commercial and industrial loans. At first glance, it might look like standards are loosening because the slope of the line is down. However, it is still in tightening territory. In other words, 14% more banks have tightened lending standards since the last survey.
Source: Federal Reserve
While banks are tightening standards, demand also continues to fall as market participants tighten their belts and don’t pursue new business opportunities.
Source: Federal Reserve
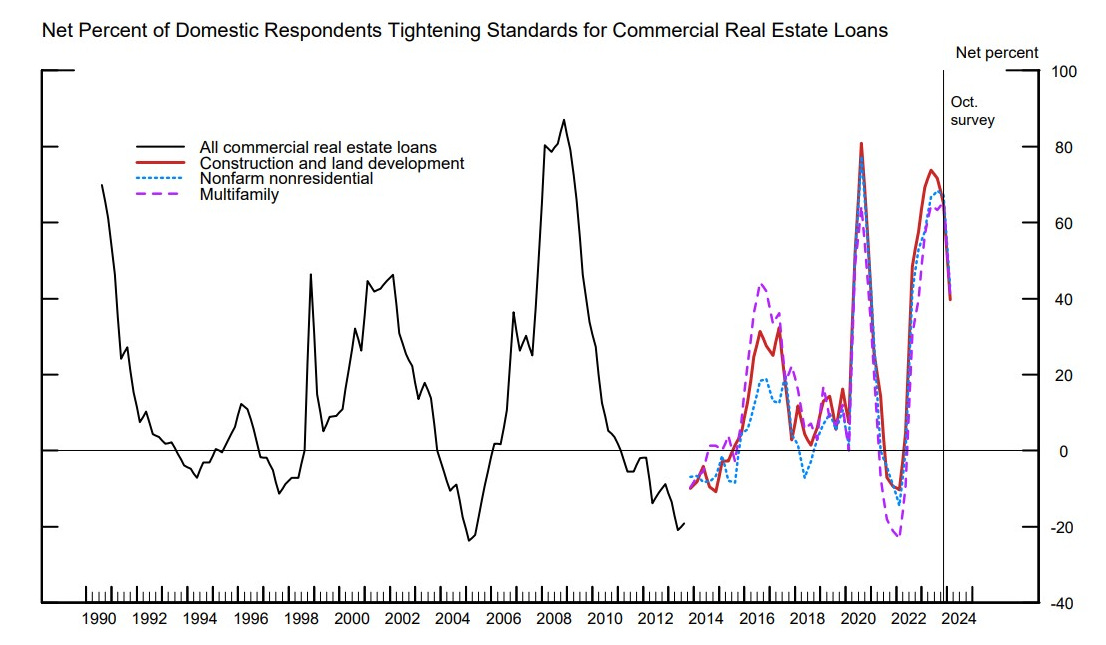
A similar story appears in the commercial real estate (CRE) loans, as well.
Source: Federal Reserve
Interesting for CRE is that demand is not bouncing back as much as standards are. Also, these numbers are much worse than the C&I loans above.
Source: Federal Reserve
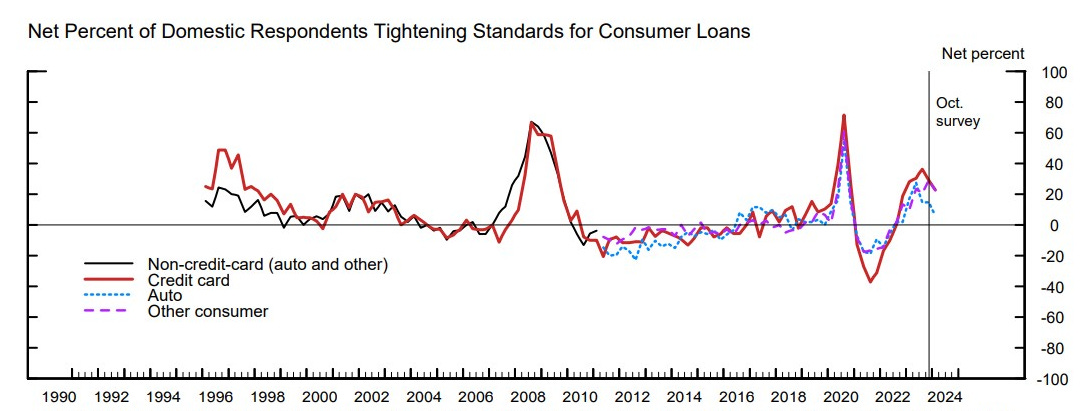
Lastly, we will look at consumer loans. This segment did not get nearly as bad as the others, however, they are still in tightening mode. Overall, the variability for consumer loans is less than other types of loans.
Source: Federal Reserve
As far as demand for consumer loans, there was some volatility due to effects of COVID restrictions on consumer patterns, but it is relatively stable in a downward trend since 2012.
Source: Federal Reserve
From this data we learn that the credit creation (money printing) engine of the economy is still in contraction. We are lucky that we haven’t entered a recession already, but loan data suggests we are headed for one.
We can apply SLOOS data to projections of CPI. During the height of the COVID disruptions, lending standards loosened dramatically along with demand turning positive. That is what fueled the CPI increases. We could also tell almost immediately that high CPI would be transitory, because lending standards tightened and demand fell. With standards and demand still on the tightening territory, we should expect CPI to continue to fall, but more slowly. If the economy deteriorates through 2024, the SLOOS should reverse again as we get closer and closer to recession.
Recession in 2024?
Our Pre-Recession trade is still working beautifully. This covers the process the market will take as it approaches recession. Contrary to what post people believe, recessions do not start with a stock market crash. They are the result of economic deterioration which we can track. I’ve written at length about this process: The lead-up to recession is positive for stocks where money doesn’t get used elsewhere in the economy and is plowed into investments. Bond prices should go up along with other safe havens like bitcoin and gold. Lastly, the oil price should be flat to down.
The S&P 500 rally has most macro analysts stumped. Not us, the arrow you see on the chart first appeared back on our October 11 2023 post.
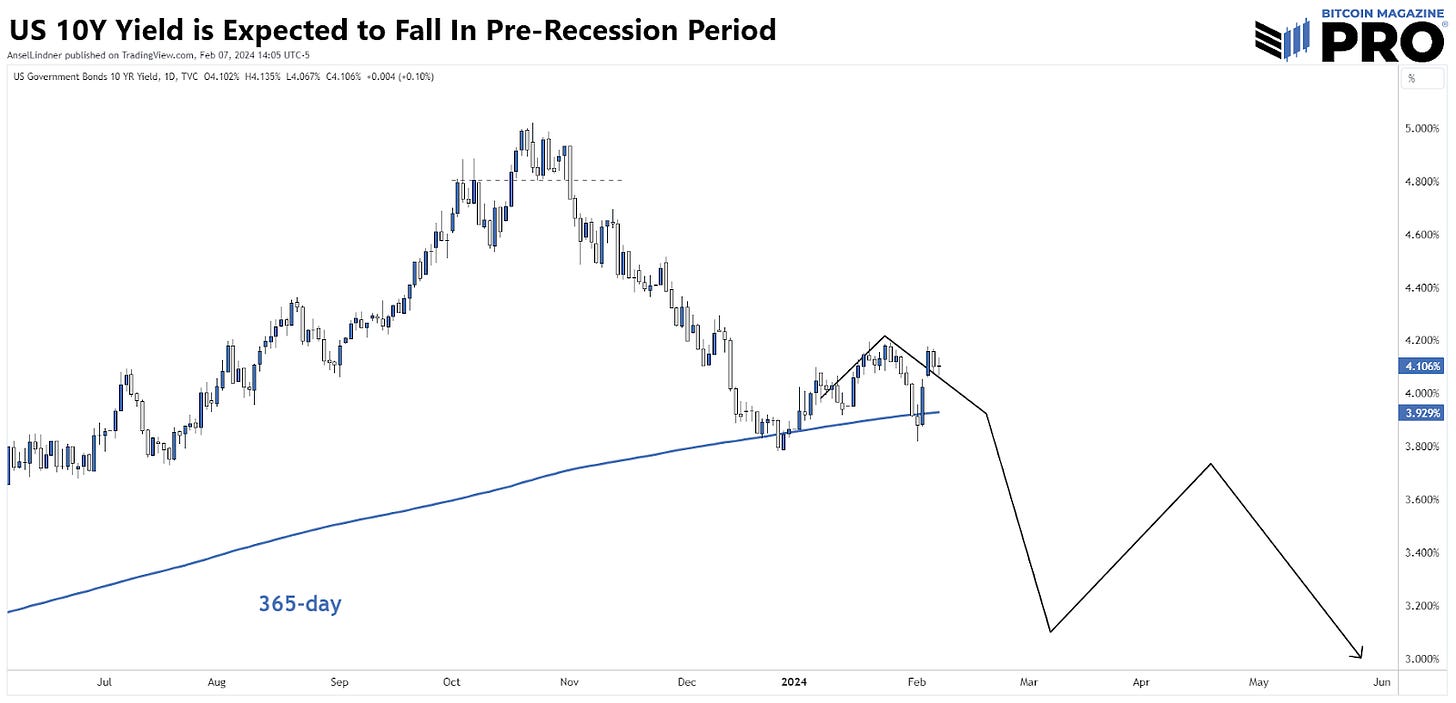
The US 10Y yield has been supported on the 1-year MA, and is generally in-line with predictions. This arrow first appeared on our 2024 prediction post on January 2.
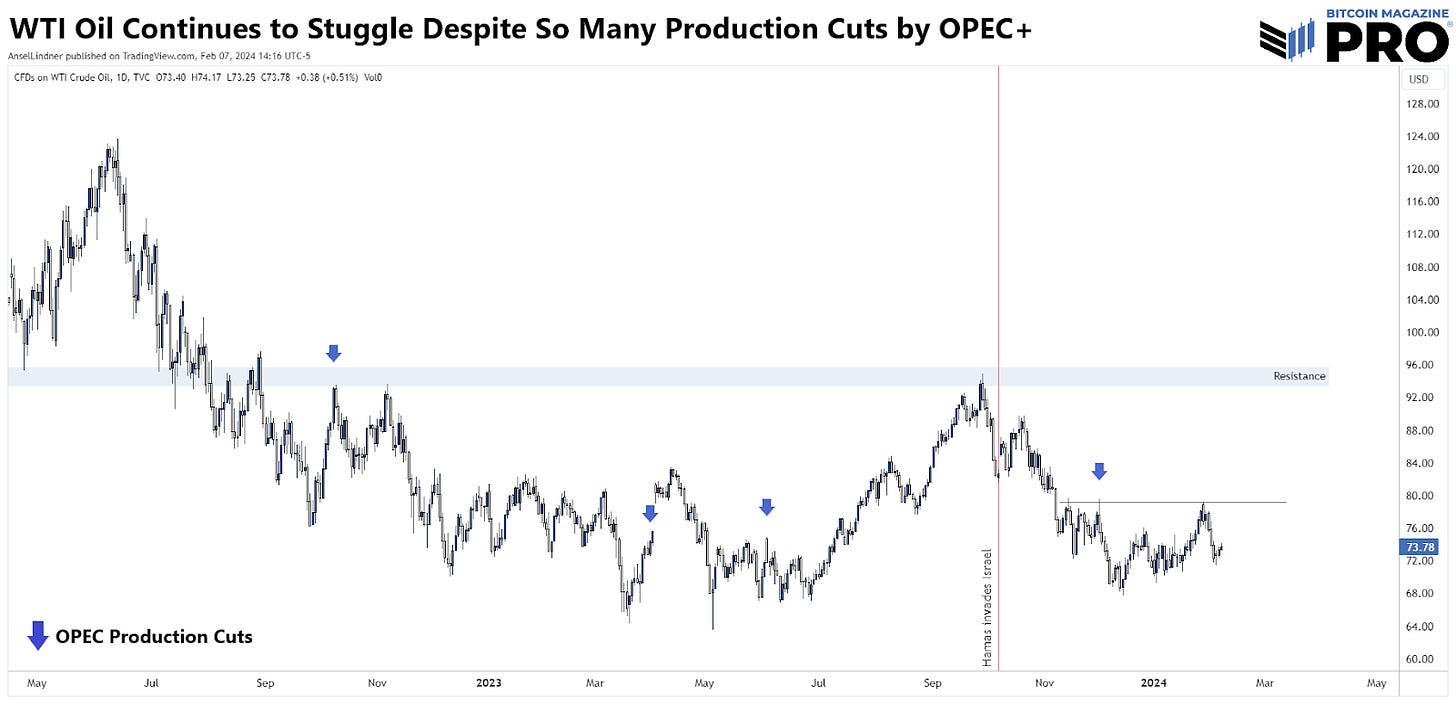
Oil has not shown any signs of life in the global economy. As expected, production cuts from OPEC have had little effect due to demand being so low. There is now 5-6 million bpd of excess capacity in OPEC alone. That doesn’t include any other sources of production growth like US shale, Canada or Venezuela.
As you can see the pre-recession trade is shaping up very nicely. SLOOS data and these charts show a convincing story for recession later this year. The lead up should be quite positive for bitcoin price, especially in context of ETFs demand and the halving.
If you found value in this post, please like and share! Thank you!


Predicting the S&P 500 run 🚀🔥