Weekly Newsletter: Bitcoin pullback to $58,000
Bitcoin Settles at $58K Amid Market Volatility and ETF Inflows
GM. Today’s headlines:
After a strong performance last week, $BTC pulls back to $58,000.
US spot Bitcoin ETF’s log highest daily inflows in nearly two months.
Sam Bankman Fried files appeal to overturn fraud conviction.
Bitcoin climbed +10% last week shaking off fears driven by wider macro-economic concerns. Over the weekend, price has pulled back to the $58,000 area.
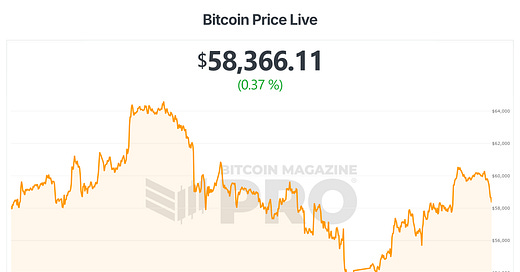
Despite all the volatility, Bitcoin price is now in the same place, +0.37%, as it was a month ago.
Figure 1: Bitcoin past month price performance.
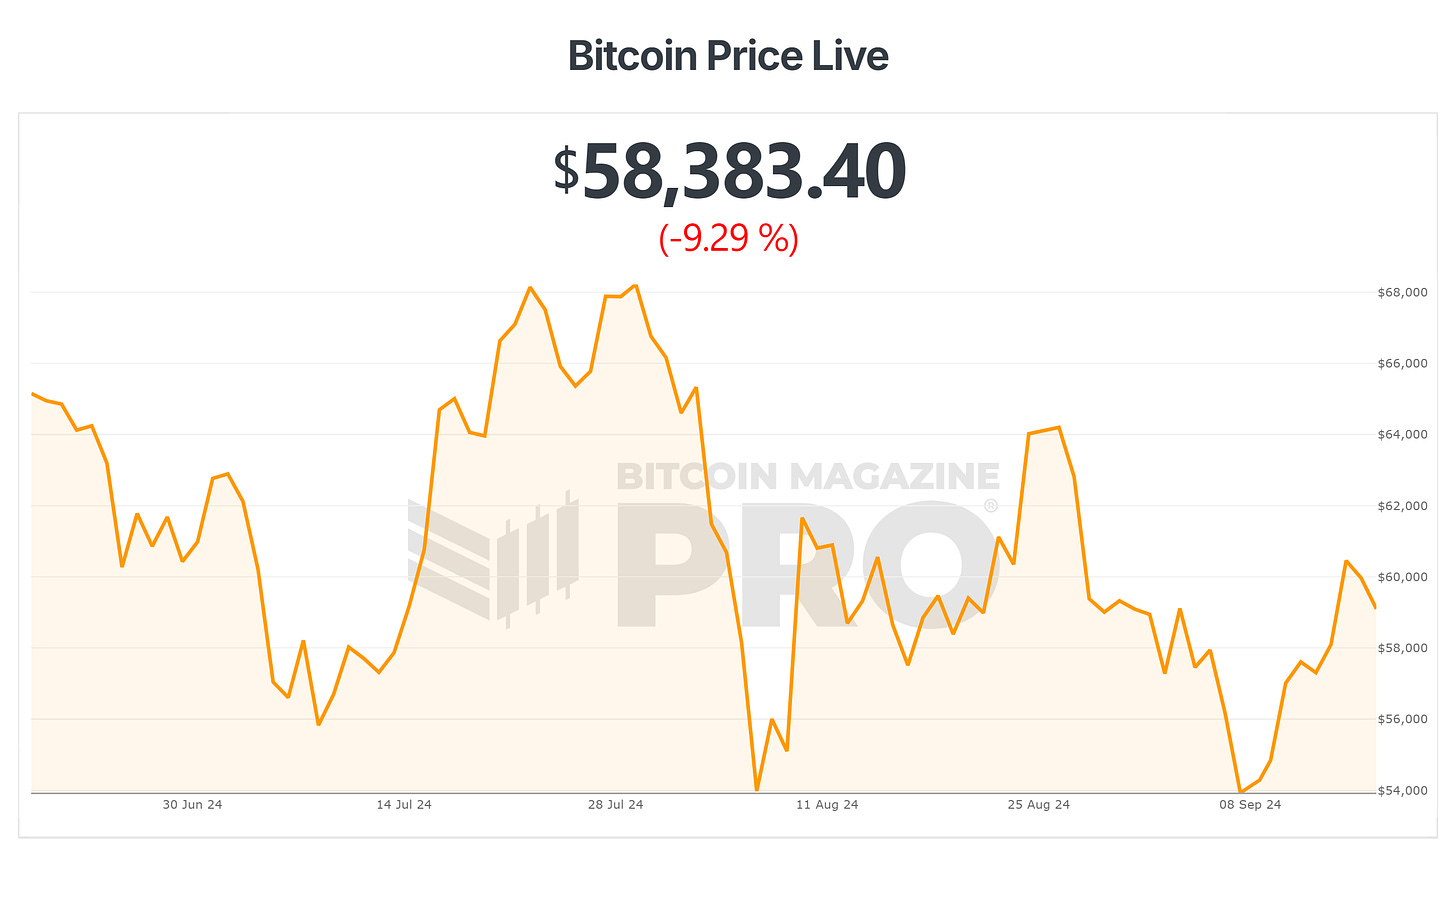
Despite all the doom and gloom that has circled the market over the summer, Bitcoin is down less than 10% over the past 3 months, -9.29%.
Figure 2: Bitcoin's past 3-month performance.
News You Need to Know
After a strong performance last week, $BTC pulls back to $58,000.
US spot Bitcoin ETF’s log highest daily inflows in nearly two months.
Sam Bankman Fried files appeal to overturn fraud conviction.
CleanSpark to boost mining with Tennessee facility acquisitions
BlackRock: Bitcoin is “A hedge against global disorder”.
The Big Story
US Spot Bitcoin ETF’s highest inflows in nearly two months
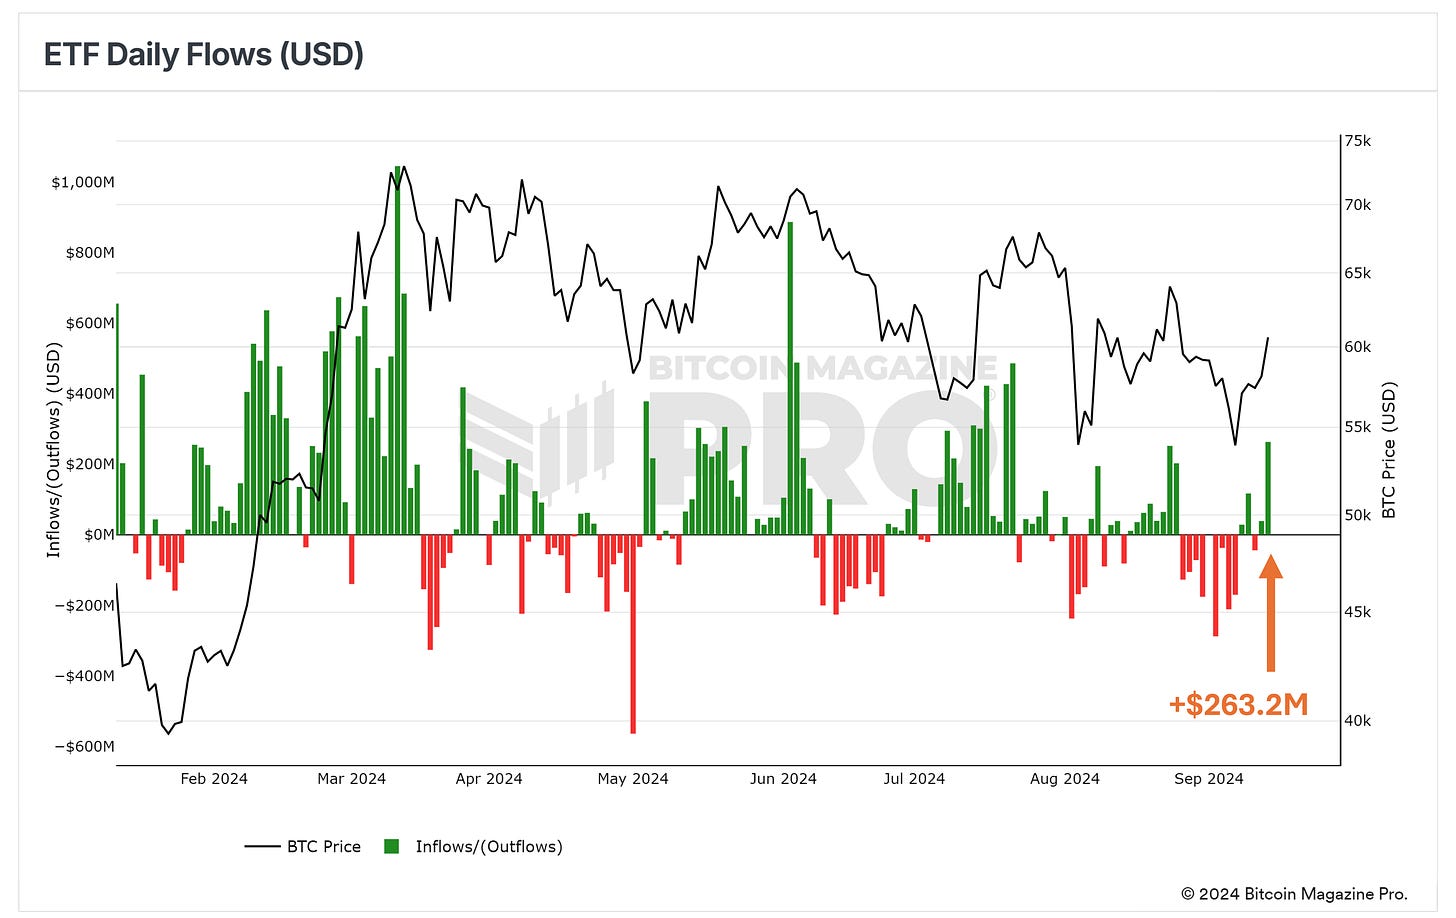
Bitcoin ETF inflows have been lacking in recent weeks. As fear rippled through the markets, the knock effect was seen in poor daily inflows/outflows.
However, after a week of positive price action last week, Friday bucked that negative flows trend for spot Bitcoin ETF’s and recorded a solid +$263.2M of inflows.
Figure 3: Positive Bitcoin ETF inflows on Friday last week.
This was primarily driven by the strong performance of Fidelity which had inflows of $102M. Clawing back some of the heavy outflows it had experienced at the previous weeks price lows as $BTC dropped down to $53,000.
Figure 4: Fidelity (FBTC) leading Friday’s positive inflows.
Ark (ARKB) were close behind with $99.3 million worth of inflows.
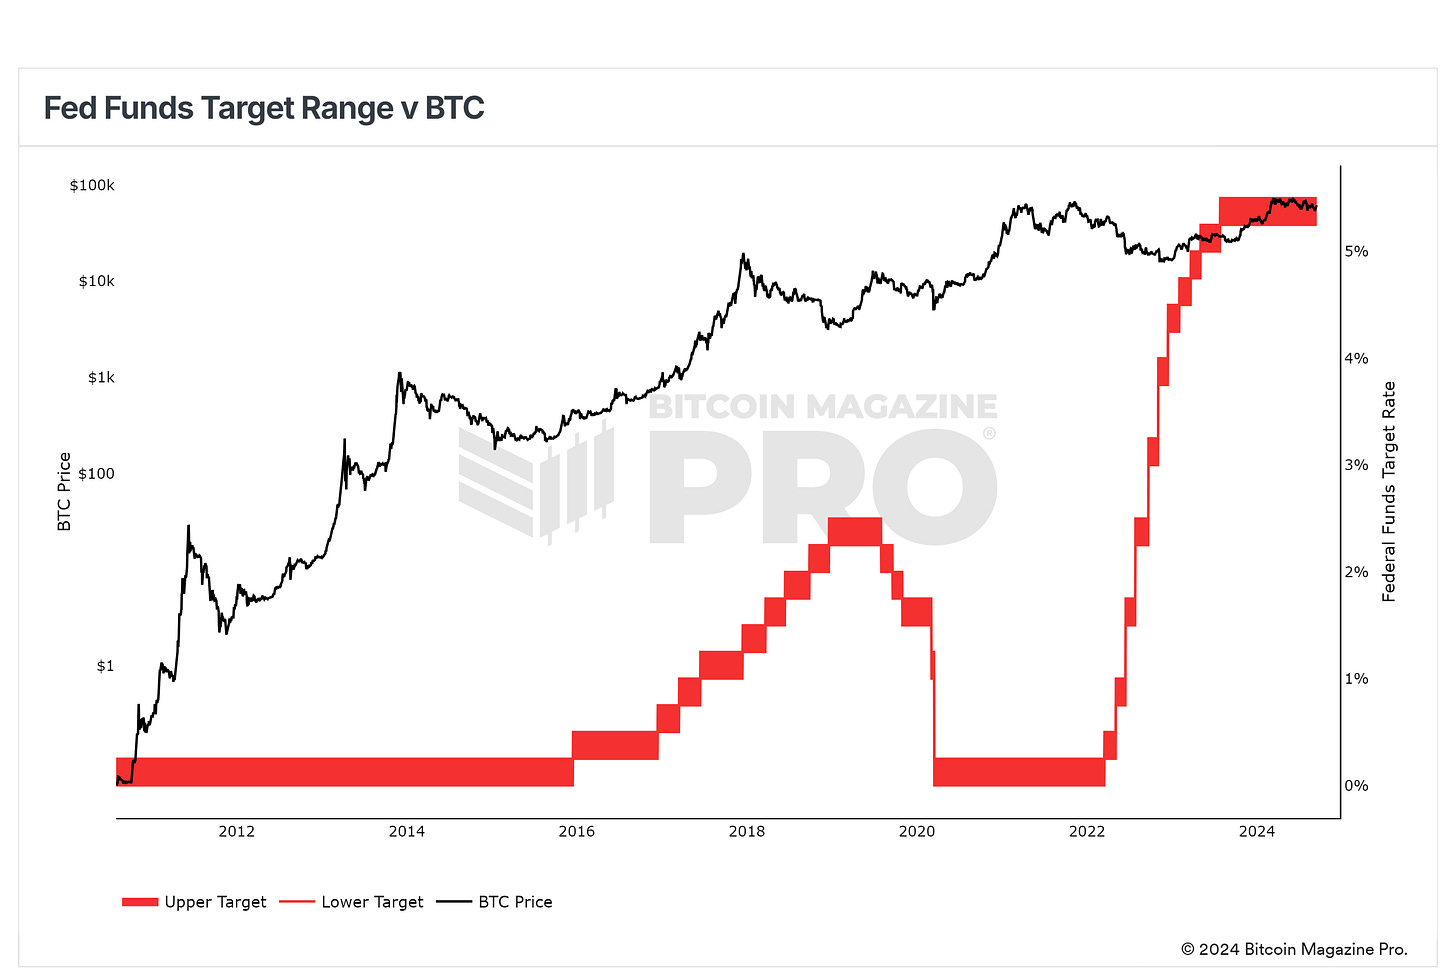
Despite the weekend’s price pullback, traders and investors appear to be becoming more confident in anticipation of an interest rate cut from the Federal Reserve on Wednesday this week.
A cut in the interest rate this week would mark the first rate cut since the covid crisis in March 2020.
Figure 5: Federal Reserve rates over Bitcoin’s lifetime.
Should a rate cut be deeper than the market expects, the price of risk assets such as Bitcoin would likely rally upwards.
Key Chart
Each week, our BM Pro Analysts hand-pick a must-see chart for you. This week:
The Bitcoin Investor Tool.
Figure 6: The Bitcoin Investor Tool: 2-Year MA Multiplier
What it is
The Bitcoin Investor Tool uses two key lines: the 2-year moving average (2Y MA) and a line that is 5 times the 2-year moving average (5x 2Y MA).
It is designed to identify periods when Bitcoin is overbought (above the 5x 2Y MA) or undervalued (below the 2Y MA), based on historical price trends.
The tool aims to help long-term investors assess buying and selling opportunities by showing when Bitcoin's price deviates significantly from its long-term average.
Why this matters
By smoothing out short-term price fluctuations with the 2-year moving average, this tool helps investors view macro trends in Bitcoin's price.
Buy Zone: Historically, when Bitcoin's price has fallen below the 2Y MA, it has been considered an undervalued buy opportunity, indicating potential long-term gains.
Similarly, when the price approaches the 5x 2Y MA, it signals a period of overvaluation, where taking profits might be prudent due to a potential price correction.
What's happening now
Bitcoin ($BTC) is trading above the 2-year moving average, but not near the overbought zone (5x 2Y MA), indicating it is in a more neutral or slightly bullish phase.
In recent months, $BTC price movement has stayed within the historical bounds of the tool, suggesting that the market is not yet in a speculative bubble.
We are currently in a period of consolidation. As new money enters the ecosystem, we will see $BTC trend up towards the overvaluation area of the 5x 2Y MA, which is currently well above $100,000.
This tool is useful for long-term holders who want to avoid short-term noise and focus on broader market cycles when making investment decisions.
You can track this metric for free here.
Bitcoin Magazine Pro
For more detailed Bitcoin analysis and to access advanced features like live chats, personalized indicator alerts, and in-depth industry reports, check out Bitcoin Magazine Pro.
Make Smarter Decisions About Bitcoin. Join millions of investors who get clarity about Bitcoin using data analytics you can't get anywhere else.
We don't just provide data for data's sake, we provide the metrics and tools that really matter. So you get to supercharge your insights, not your workload.
Don’t forget to like this post, share it with your network, and leave your thoughts in the comments below.
Take the next step in your investing journey:
Follow us on X for the latest chart updates and analysis.
Subscribe to the YouTube channel for regular video updates and expert insights.
Follow our LinkedIn page for comprehensive Bitcoin data, analysis, and insights.
Explore Bitcoin Magazine Pro to access powerful tools and analytics that can help you stay ahead of the curve.
Invest wisely, stay informed, and let data drive your decisions. Thank you for reading, and here’s to your future success in the Bitcoin market!
🎁 Special Offer: Use Code: BMPRO For 10% OFF All Bitcoin Conference Tickets
Disclaimer: This newsletter is for informational purposes only and should not be considered financial advice. Always do your own research before making any investment decisions.


