

Weekly Alpha: Bitcoin Breaks 200 Week Moving Average
As Bitcoin tests the 200-week moving average, Strategy, Saylor, and MSTR face growing scrutiny. Here's what the data says about market risk.

At Bitcoin Magazine Pro, our goal is to help you cut through the noise and understand what the data is really saying. This week, we’ll cover Bitcoin’s key levels as it came back down to the 200 week moving average. Let’s go.
What’s Happening
Bitcoin Key Levels to Watch
Bitcoin has continued to weaken over the past week after it had previously failed to reclaim the 200 day moving average. In recent editions of Weekly Alpha, we have warned that the 200DMA was likely to act as tough resistance and noted that BTC had already struggled to break above it.
That failure has now played out, with price moving lower and testing one of the most important long-term support levels in Bitcoin’s history.
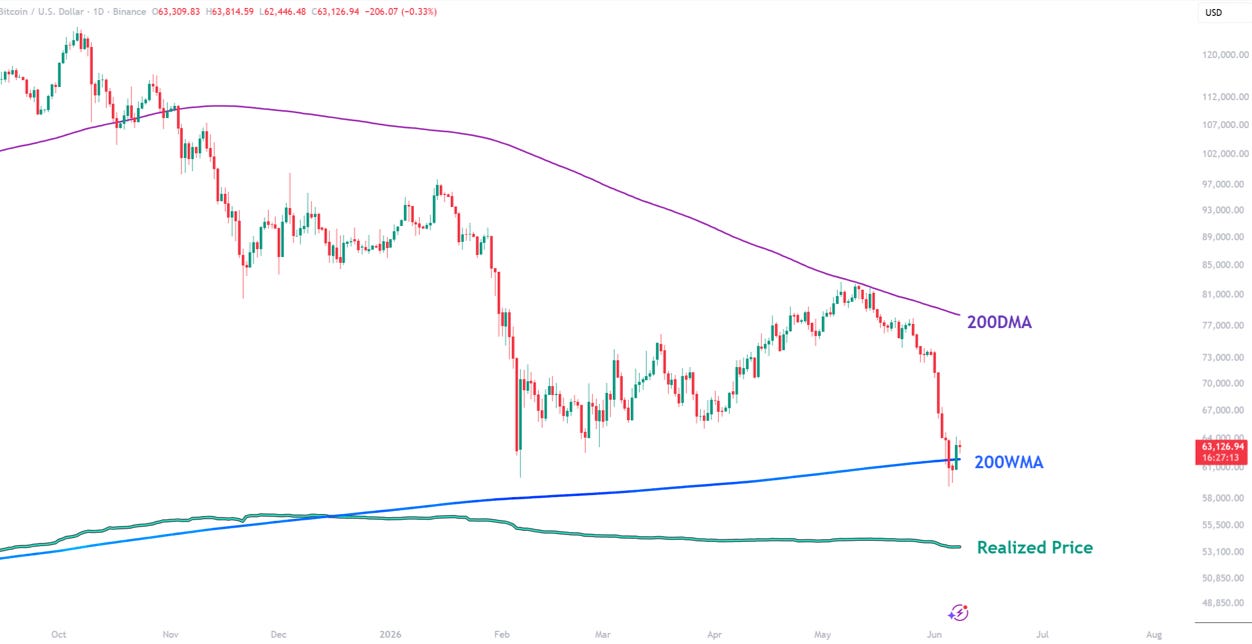
Figure 1: BTC price action against the 200DMA, 200WMA and realized price.
For several months, we have also highlighted the 200 week moving average as a key level to watch in this bear market. This week BTC finally tumbled down to that area, briefly breaking below $60,000 and setting a new low for the current cycle before attempting to recover back above the 200WMA.
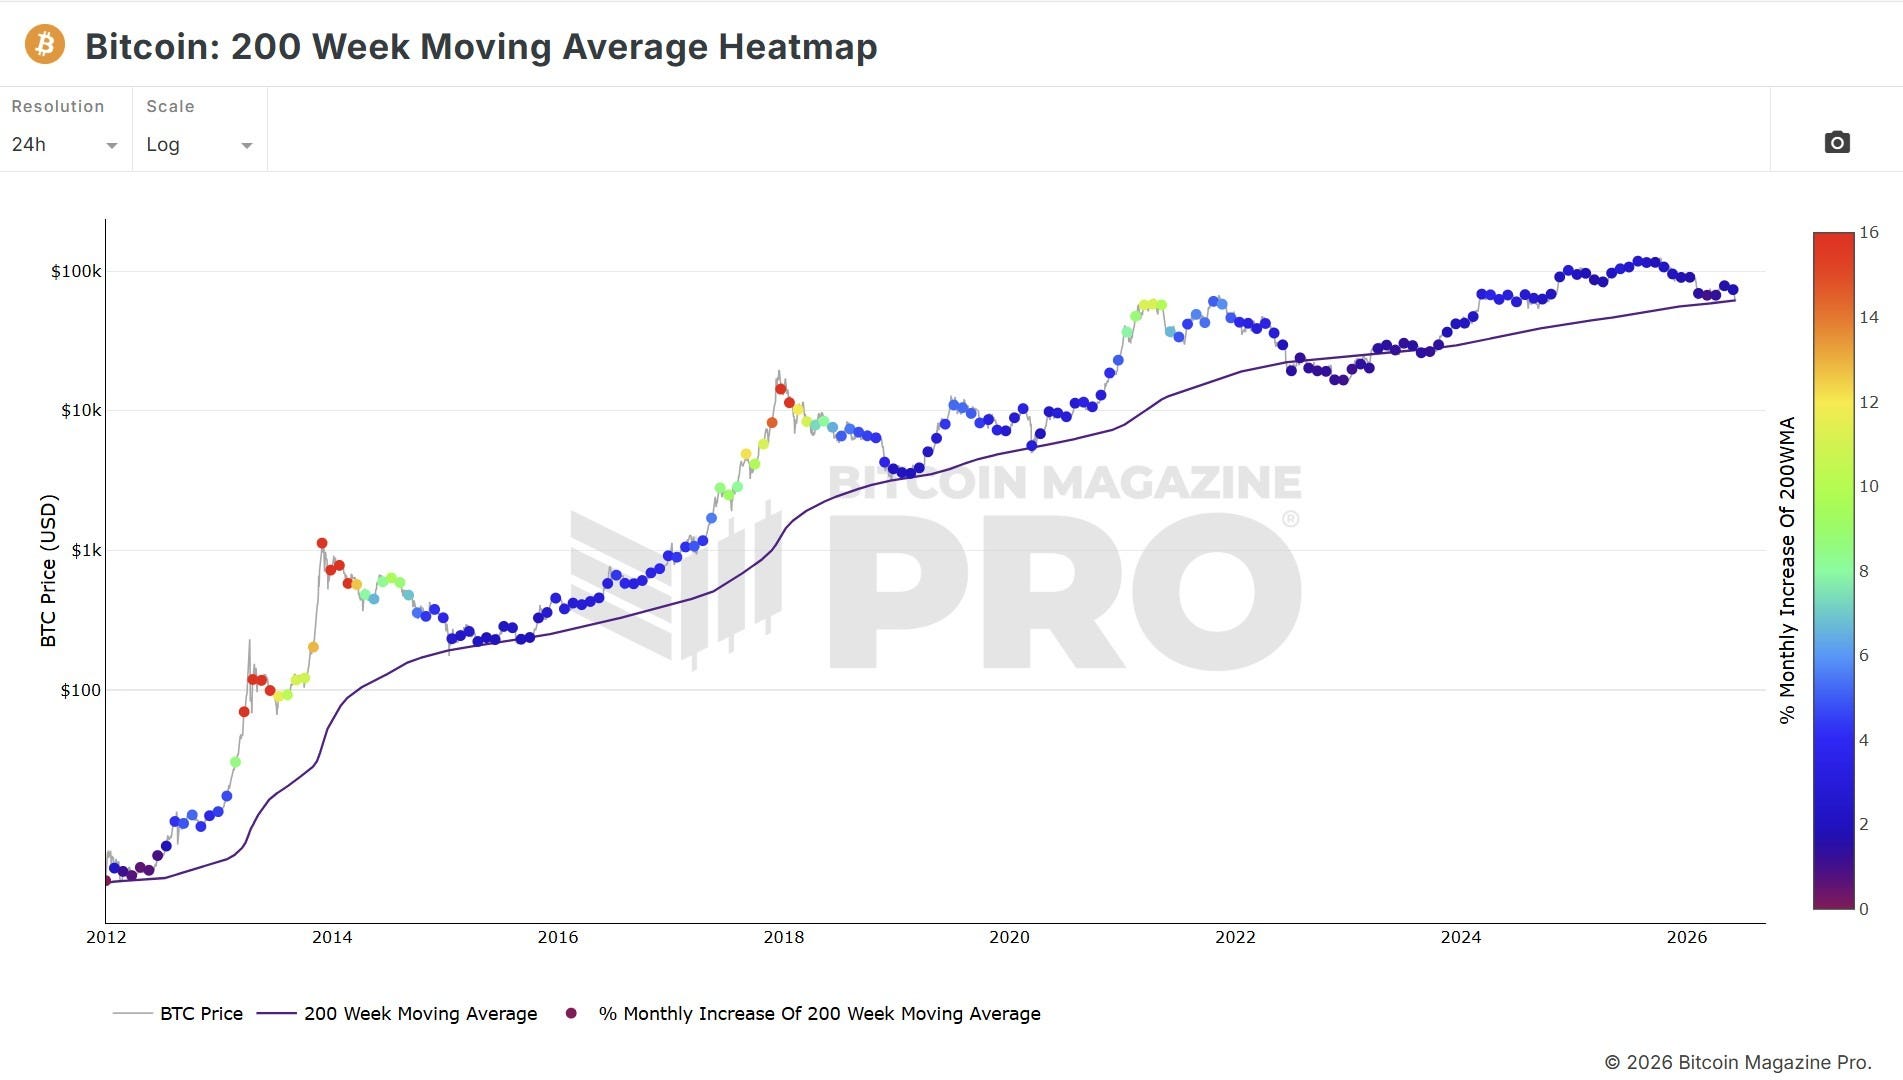
Figure 2: Bitcoin 200 Week Moving Average Heatmap
This is now the key line in the sand. If BTC can reclaim and hold the 200WMA, it would suggest buyers are beginning to step in at historically important support. If it fails, then the next major level to watch is realized price, currently around $53,600 (see figure 1).
We believe it is worth remembering that historically, Bitcoin has only traded down to the 200WMA during the depths of bear markets. For long-term investors, these periods have often felt uncomfortable in real time, but they have also historically represented rare accumulation opportunities over the long term.
Look at figure 2, how infrequently BTC price has been around the 200WMA throughout its entire history.
Strategy, Saylor and the MSTR Pressure Point
Strategy remains at the center of market attention as investors debate whether Michael Saylor’s company will continue acting as a major source of Bitcoin demand or whether market stress could force a more defensive approach following their recent selling of 32 BTC.
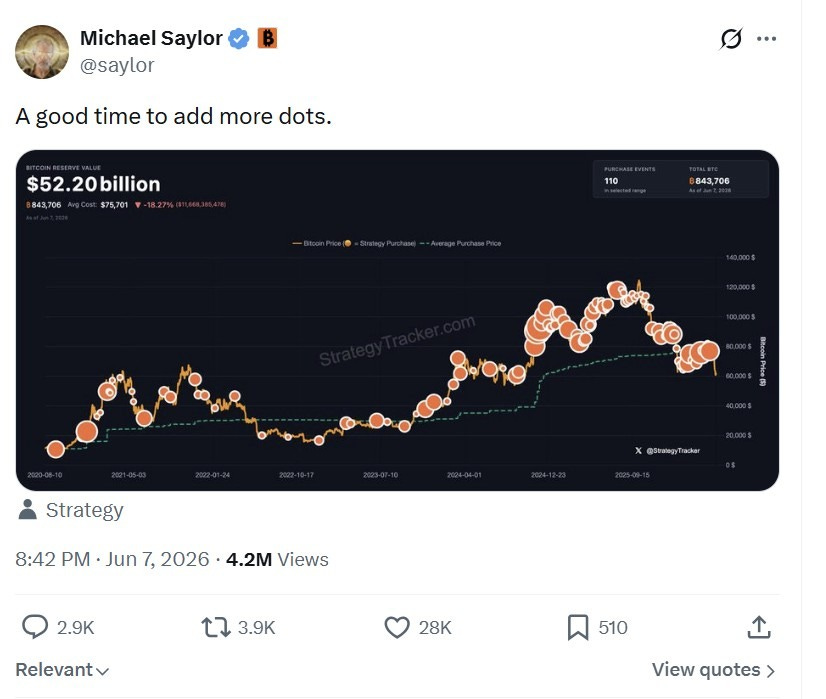
Figure 3: Saylor’s latest post
That message is important because uncertainty around Strategy has become a key part of the current market narrative. MSTR is now trading below its Bitcoin NAV, weakening the accretive logic that powered much of the bull market. When the stock trades at a premium, issuing equity to buy BTC can increase Bitcoin per share. When it trades at a discount, the market becomes far less forgiving.
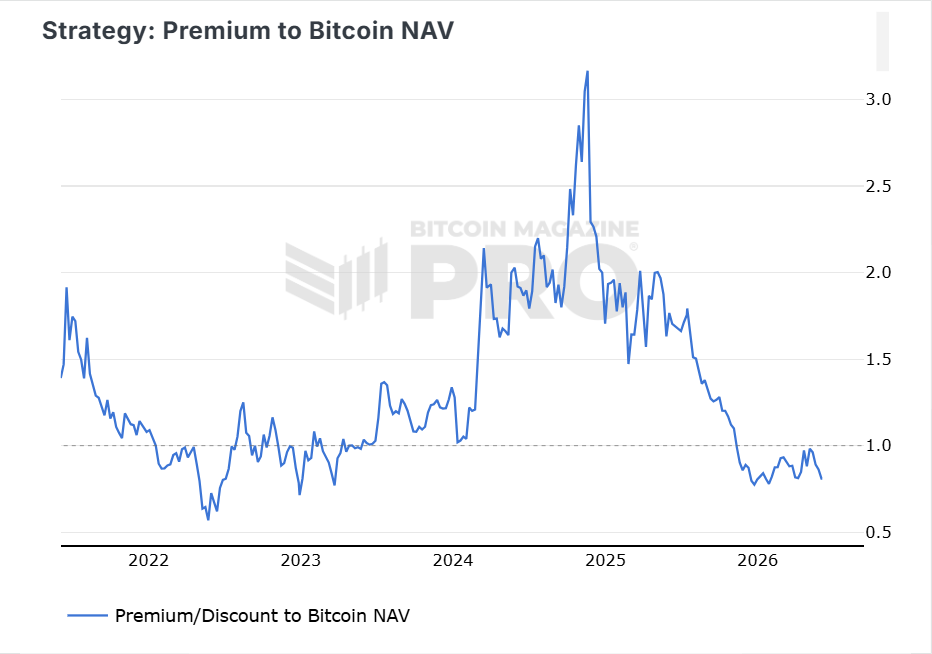
Figure 4: Strategy premium to Bitcoin NAV, showing the sharp compression from the 2024 highs.
At the same time, BTC has fallen back toward Strategy’s average cost basis, which is why traders are watching closely for any sign that the company’s buying engine is slowing.
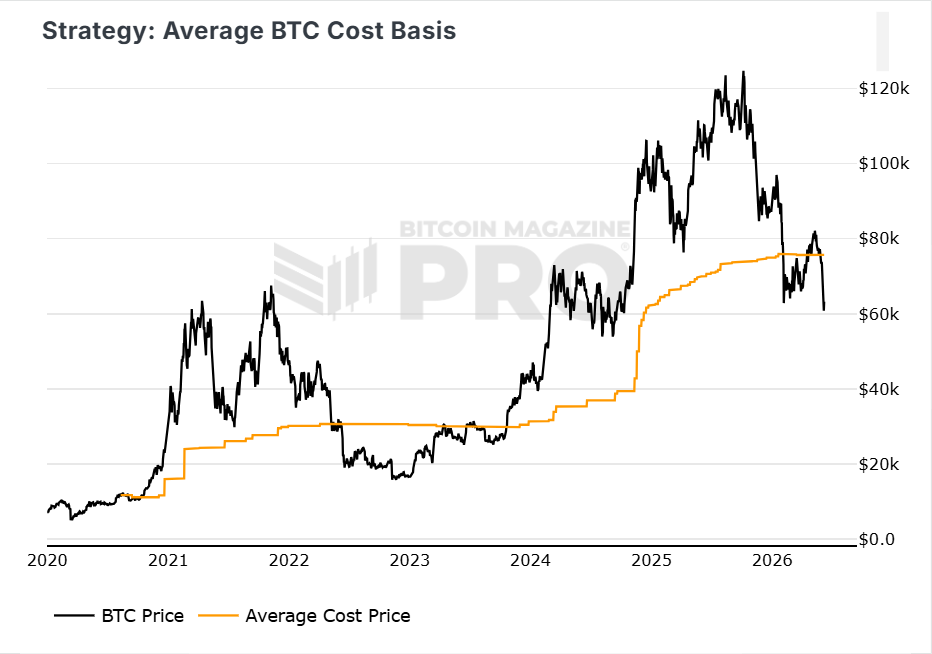
Figure 5: Strategy average BTC cost basis, with BTC now approaching a key level for market psychology.
Capital has also rotated aggressively back toward AI stocks. The performance chart shows Nvidia (+1,746%) now far ahead of both MSTR (874%) and BTC (433%) since Strategy first adopted Bitcoin back in 2020.
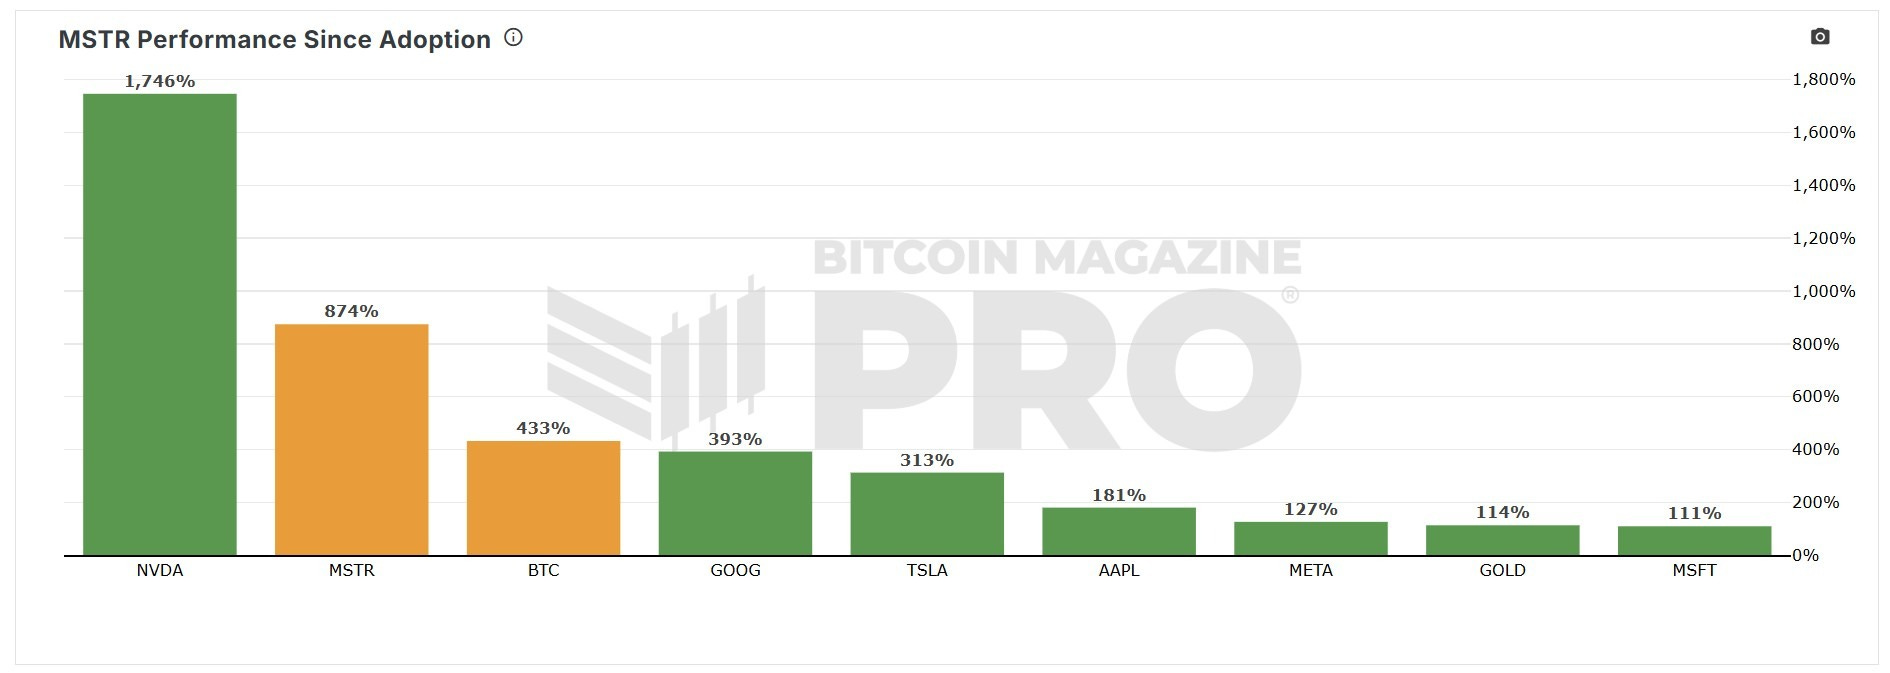
Figure 6: MSTR performance since Bitcoin adoption compared with BTC, Nvidia and other major assets.
That does not mean the Strategy thesis is broken, but the market now wants proof that Strategy can remain a net buyer over the long term. The market will be watching Saylor’s actions as well as his X posts very closely over the coming weeks.
To get clarity about Bitcoin, access the Bitcoin Magazine Pro platform here.
Use this code at checkout to get 30% off: 30BULL
The Bitcoin Magazine Pro Team.
Bitcoin Magazine Pro

For more detailed Bitcoin analysis and to access advanced features like live charts, personalized indicator alerts, and in-depth industry reports, check out Bitcoin Magazine Pro.
Make Smarter Decisions About Bitcoin. Join millions of investors who get clarity about Bitcoin using data analytics you can’t get anywhere else.
We don’t just provide data for data’s sake, we provide the metrics and tools that really matter. So you get to supercharge your insights, not your workload.
Take the next step in your Bitcoin investing journey:
Follow us on X for the latest chart updates and analysis.
Subscribe to our YouTube channel for regular video updates and expert insights.
Follow our LinkedIn page for comprehensive Bitcoin data, analysis, and insights.
Explore Bitcoin Magazine Pro to access powerful tools and analytics that can help you stay ahead of the curve.
Invest wisely, stay informed, and let data drive your decisions. Thank you for reading, and here’s to your future success in the Bitcoin market!
Disclaimer: This newsletter is for informational purposes only and should not be considered financial advice. Always do your own research before making any investment decisions.