

The Simple Bitcoin Strategy That Beats Blind DCA

Wouldn’t it be great if you could just buy the exact lows of every Bitcoin bear market and sell the exact peaks? Pull up a cycle chart, wait for price to touch a bottoming zone, go all in, then reverse it at the top. The problem is that sometimes the market never reaches those lines. So this week, following on from the mathematical modeling work we’ve covered recently, we turned the framework into something fully actionable: a simple, rules-based accumulation strategy, tested across the whole of Bitcoin’s history.
At a glance:
Relying on one indicator to go all in or all out is unreliable.
The strategy uses the MVRV quantile bands, with no buying in the top 30% of valuations, standard DCA below that, and linearly more aggressive buying in the bottom 15%.
Adding a sell mode, scaling out gradually in the top 15% of valuations, produced a 5.71x outperformance versus blind DCA since 2014.
Picking any random start date in Bitcoin’s history, the approach beat blind dollar cost averaging 88% of the time.
The same logic extends to other metrics such as the Mayer Multiple and production cost.
There Is No Holy Grail Indicator
Metrics like the Bitcoin Cycle Master have worked well historically, with clearly defined undervalued and overvalued zones that lined up with cycle turning points. However, in the last cycle, price simply never reached the upper band. Anyone waiting for that perfect sell signal never got it. The same risk applies on the way down; there is no guarantee this bear market reaches the lower band either.
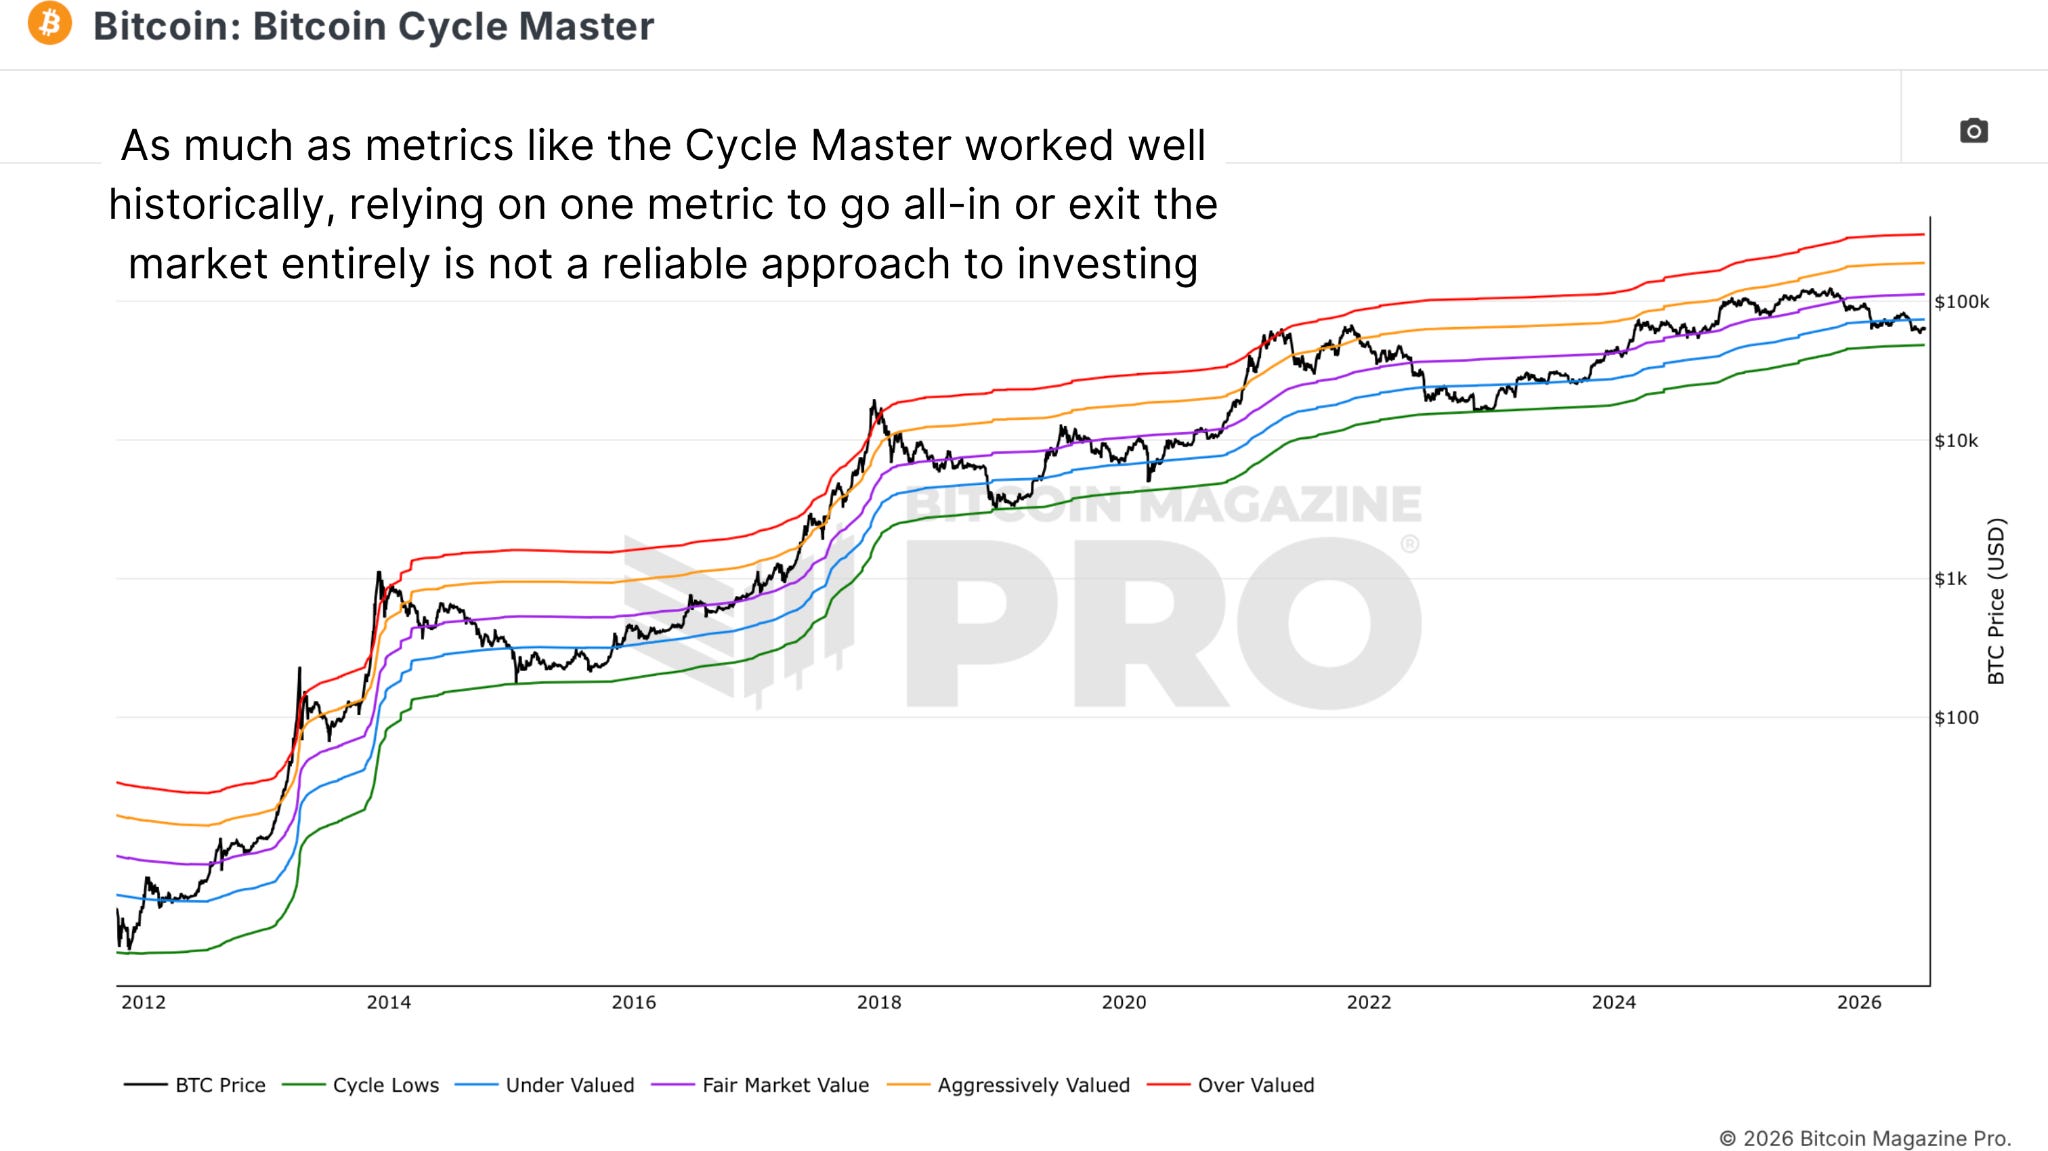
Figure 1: The Bitcoin Cycle Master has worked well historically, but the last cycle never reached the outer bands.
That’s the core problem with all-in, all-out thinking built around a single line. It works until the market doesn’t cooperate. The better approach is one that performs well whether or not the extremes are ever reached.
The Quantile Framework
The foundation is the MVRV quantile model we built recently, which takes the ratio between price and the Realized Price and accounts for the consistent contraction in its peaks and troughs across Bitcoin’s history, splitting the result into twenty bands of five percent each. The bands adapt as the market matures instead of sitting at fixed levels that can go stale, and at any moment they show where Bitcoin sits relative to where the model expects it to be.
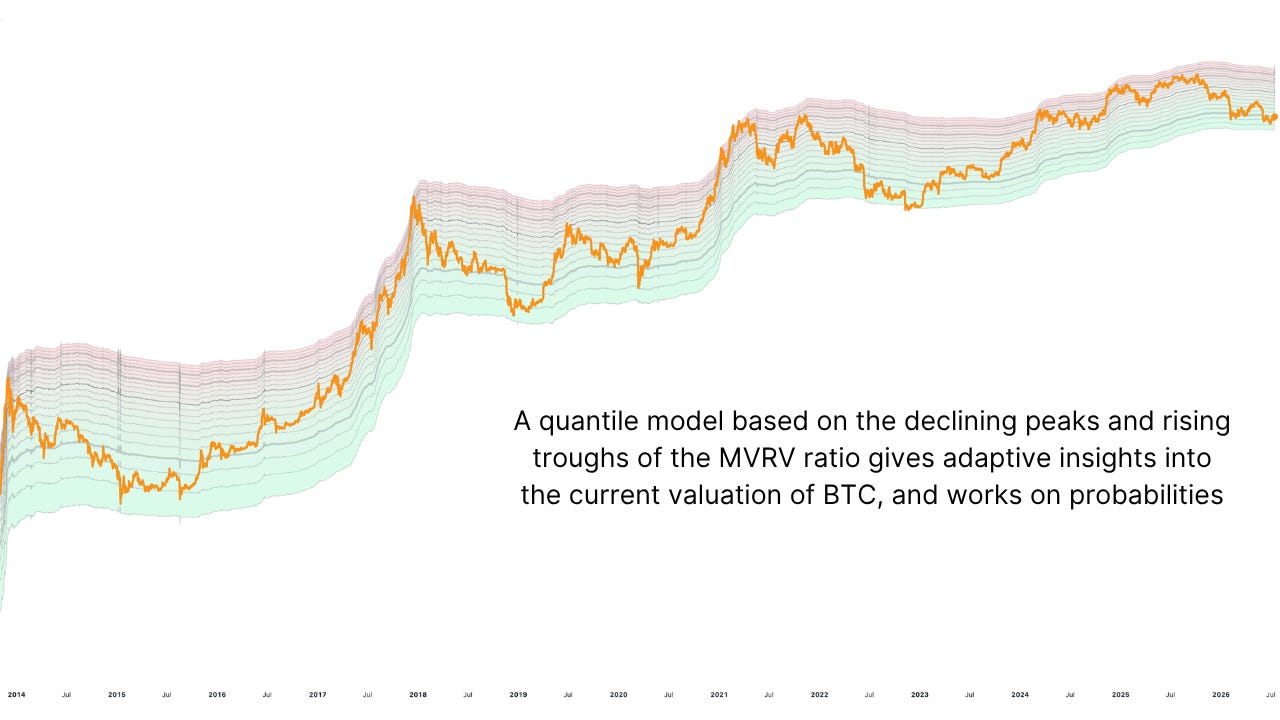
Figure 2: Unlike fixed valuation levels, the MVRV quantile bands adapt as the market matures.
The Rules
The logic is simple. When Bitcoin sits in the top 30% of the valuation bands, you don’t buy at all. Roughly a third of all Bitcoin’s price action happens up there, and that’s clearly not where you want to be deploying capital. Your regular deposits pile up in a cash reserve instead. Below that threshold, you dollar cost average as normal, every day or every week, no stress.
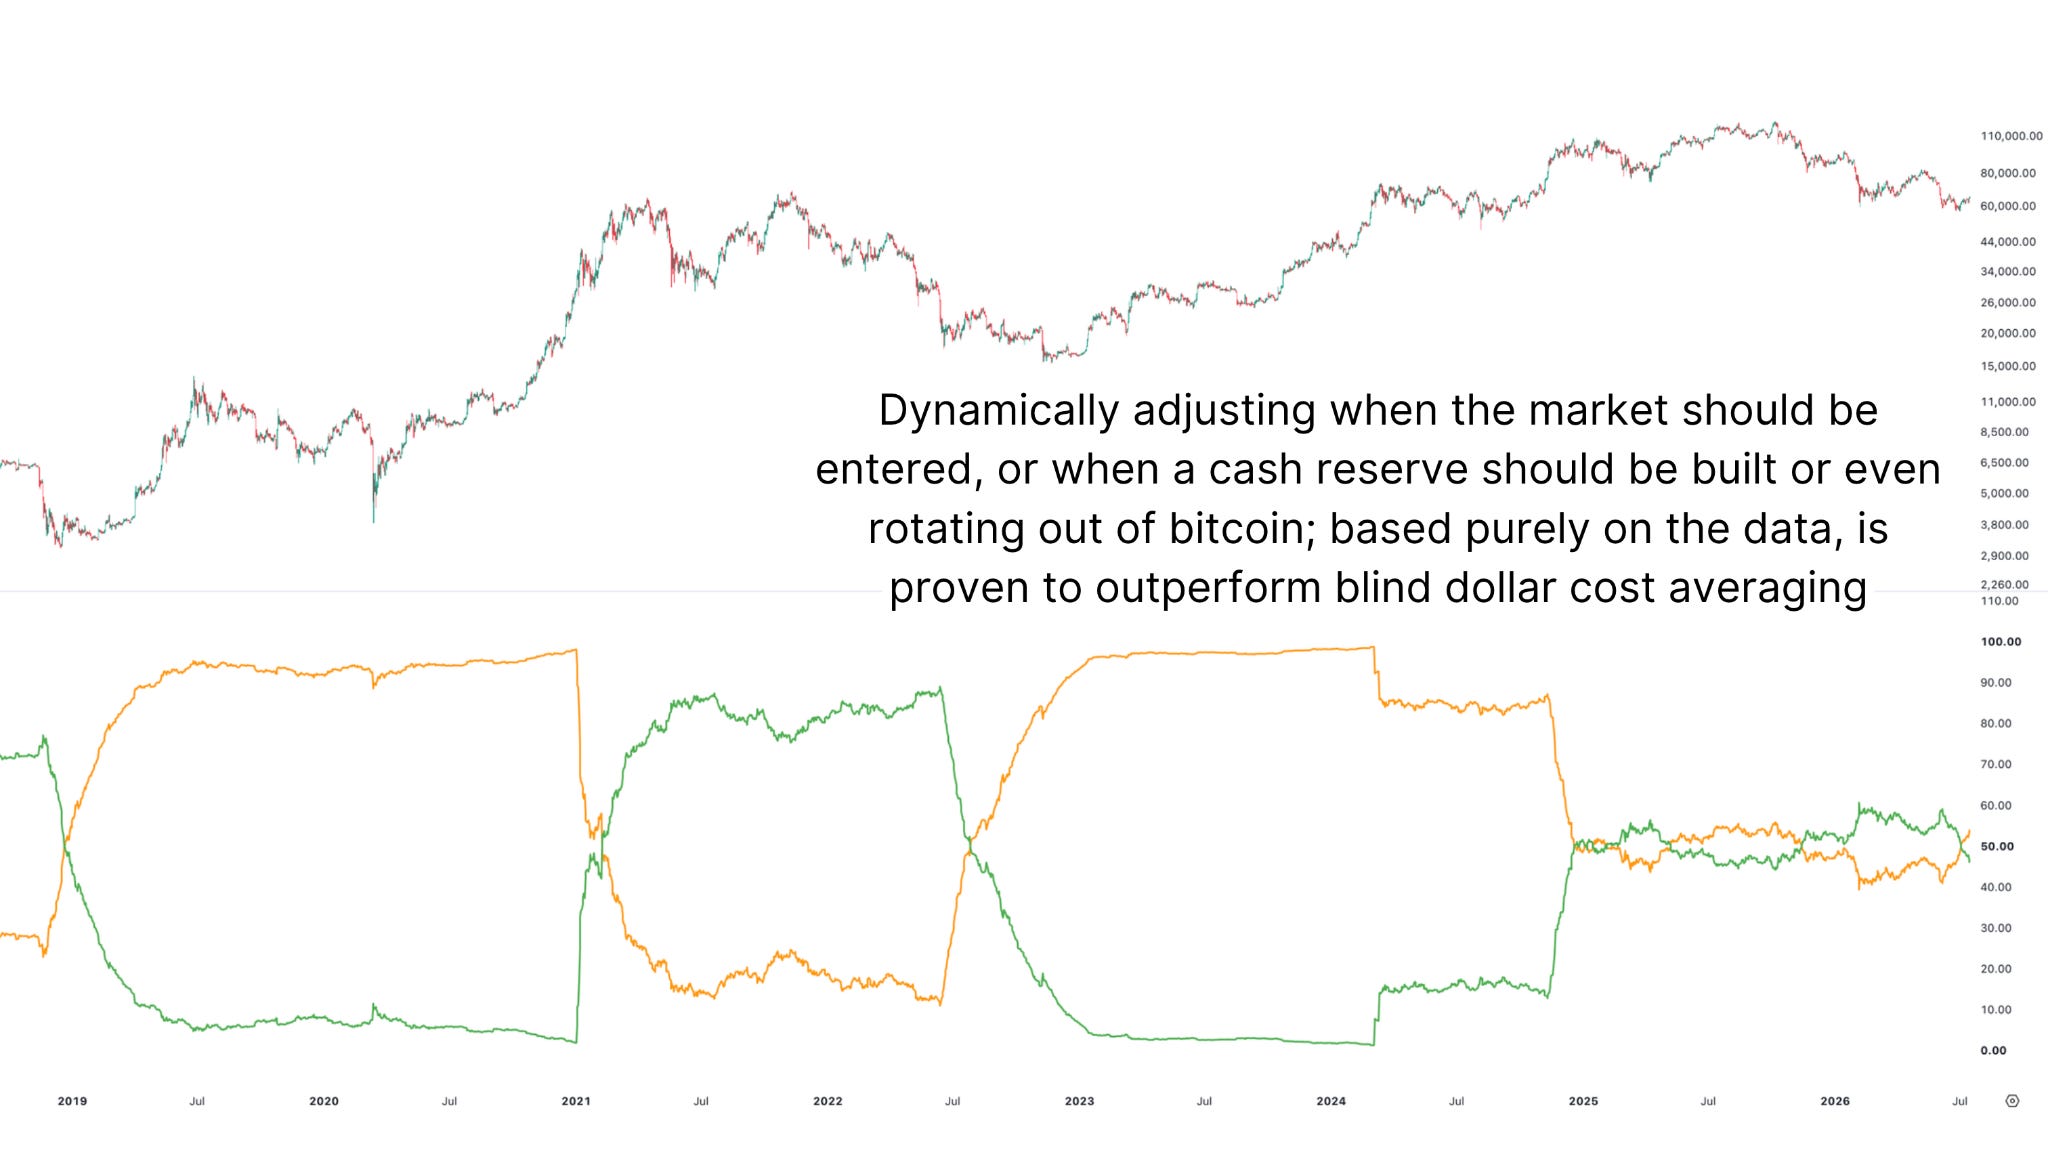
Figure 3: The allocation switches between buying and holding cash as valuation bands shift.
The aggression kicks in at the bottom 15%. That’s where you start deploying the reserve, and with every band lower, the buy size scales up. At the rarest, deepest levels of undervaluation, you’re buying as aggressively as the model ever gets. The sell side mirrors it: in the top 15% of valuations, you can consider scaling out a couple of percent a day, growing the closer price gets to the top. And if you never want to fully exit, you can set a holding floor so the model always keeps, say, at least 50% of the portfolio in bitcoin.
The Results
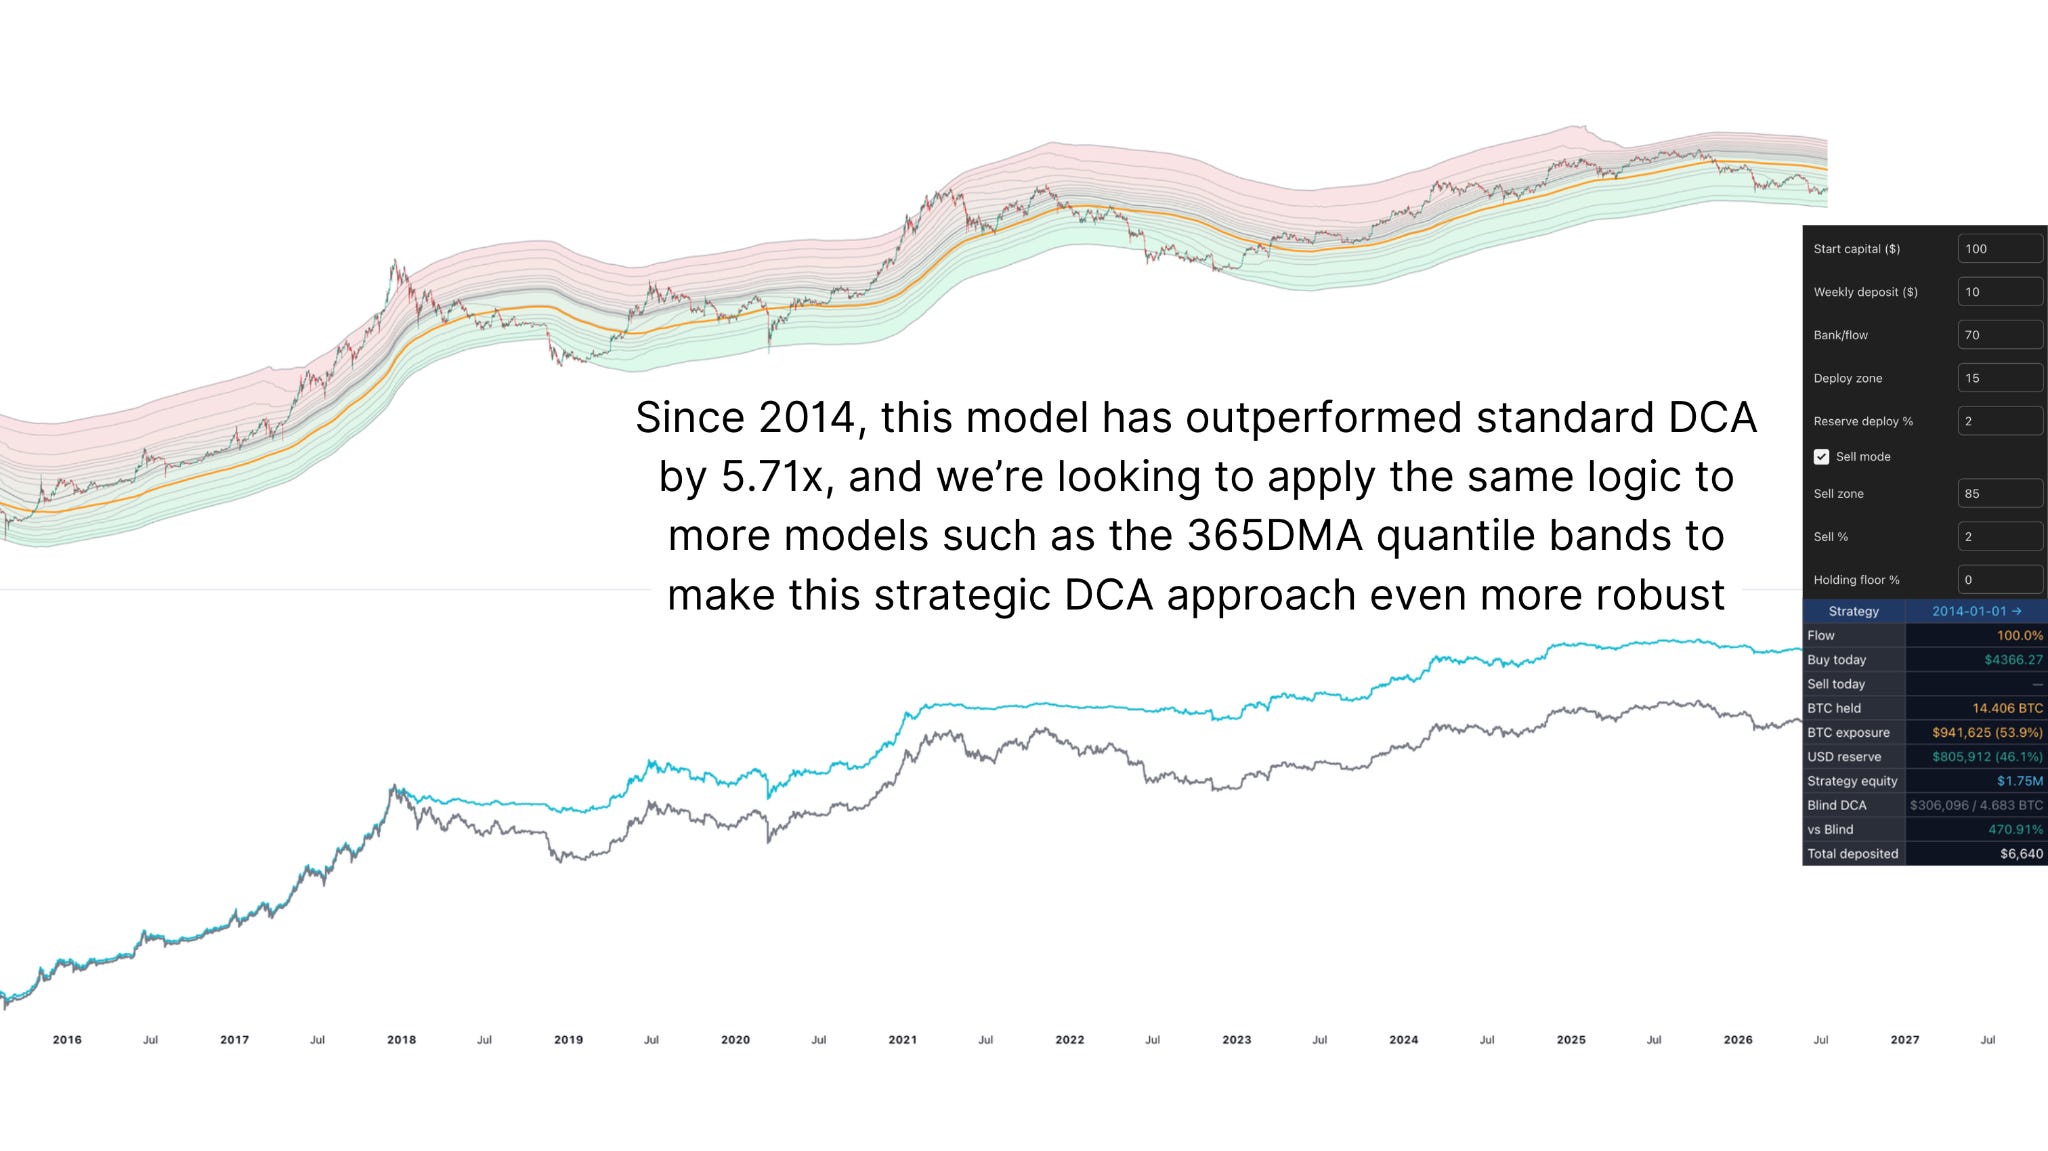
Buy-side discipline alone, simply refusing to buy in the top 30% and leaning in at the bottom, beat blind DCA by a modest margin. Worth having, but not transformative. Adding the sell mode changed everything. From 2015 onward, the full strategy outperformed blind dollar cost averaging by well over 450%, and measured from 2014, the outperformance sits at 5.71x.
Figure 4: The backtest data shows this model tracking above blind dollar cost averaging.
Robustness was the priority because backtests are easy to overfit. Pick any random day in Bitcoin’s history as a start date, and this approach beat blind DCA 88% of the time. Just as important as the returns, the drawdowns are far smaller, because you’re holding real cash through the periods when Bitcoin bleeds most. Everyone thinks they can stomach a 50%+ drawdown until they’re actually living inside one. Higher returns with a fraction of the pain is the real win here.
Extending The Framework
The same quantile methodology applies to practically any mean-reverting metric. Running it on the Mayer Multiple, the ratio between price and the one-year moving average on a rolling four-year basis, produces the same pattern of aggressive accumulation at the lows and scaling out toward the peaks, purely from one moving average. Layering in a fundamental anchor such as the electrical production cost, buying most aggressively as price approaches what it actually costs to mine a bitcoin, only strengthens the confluence.
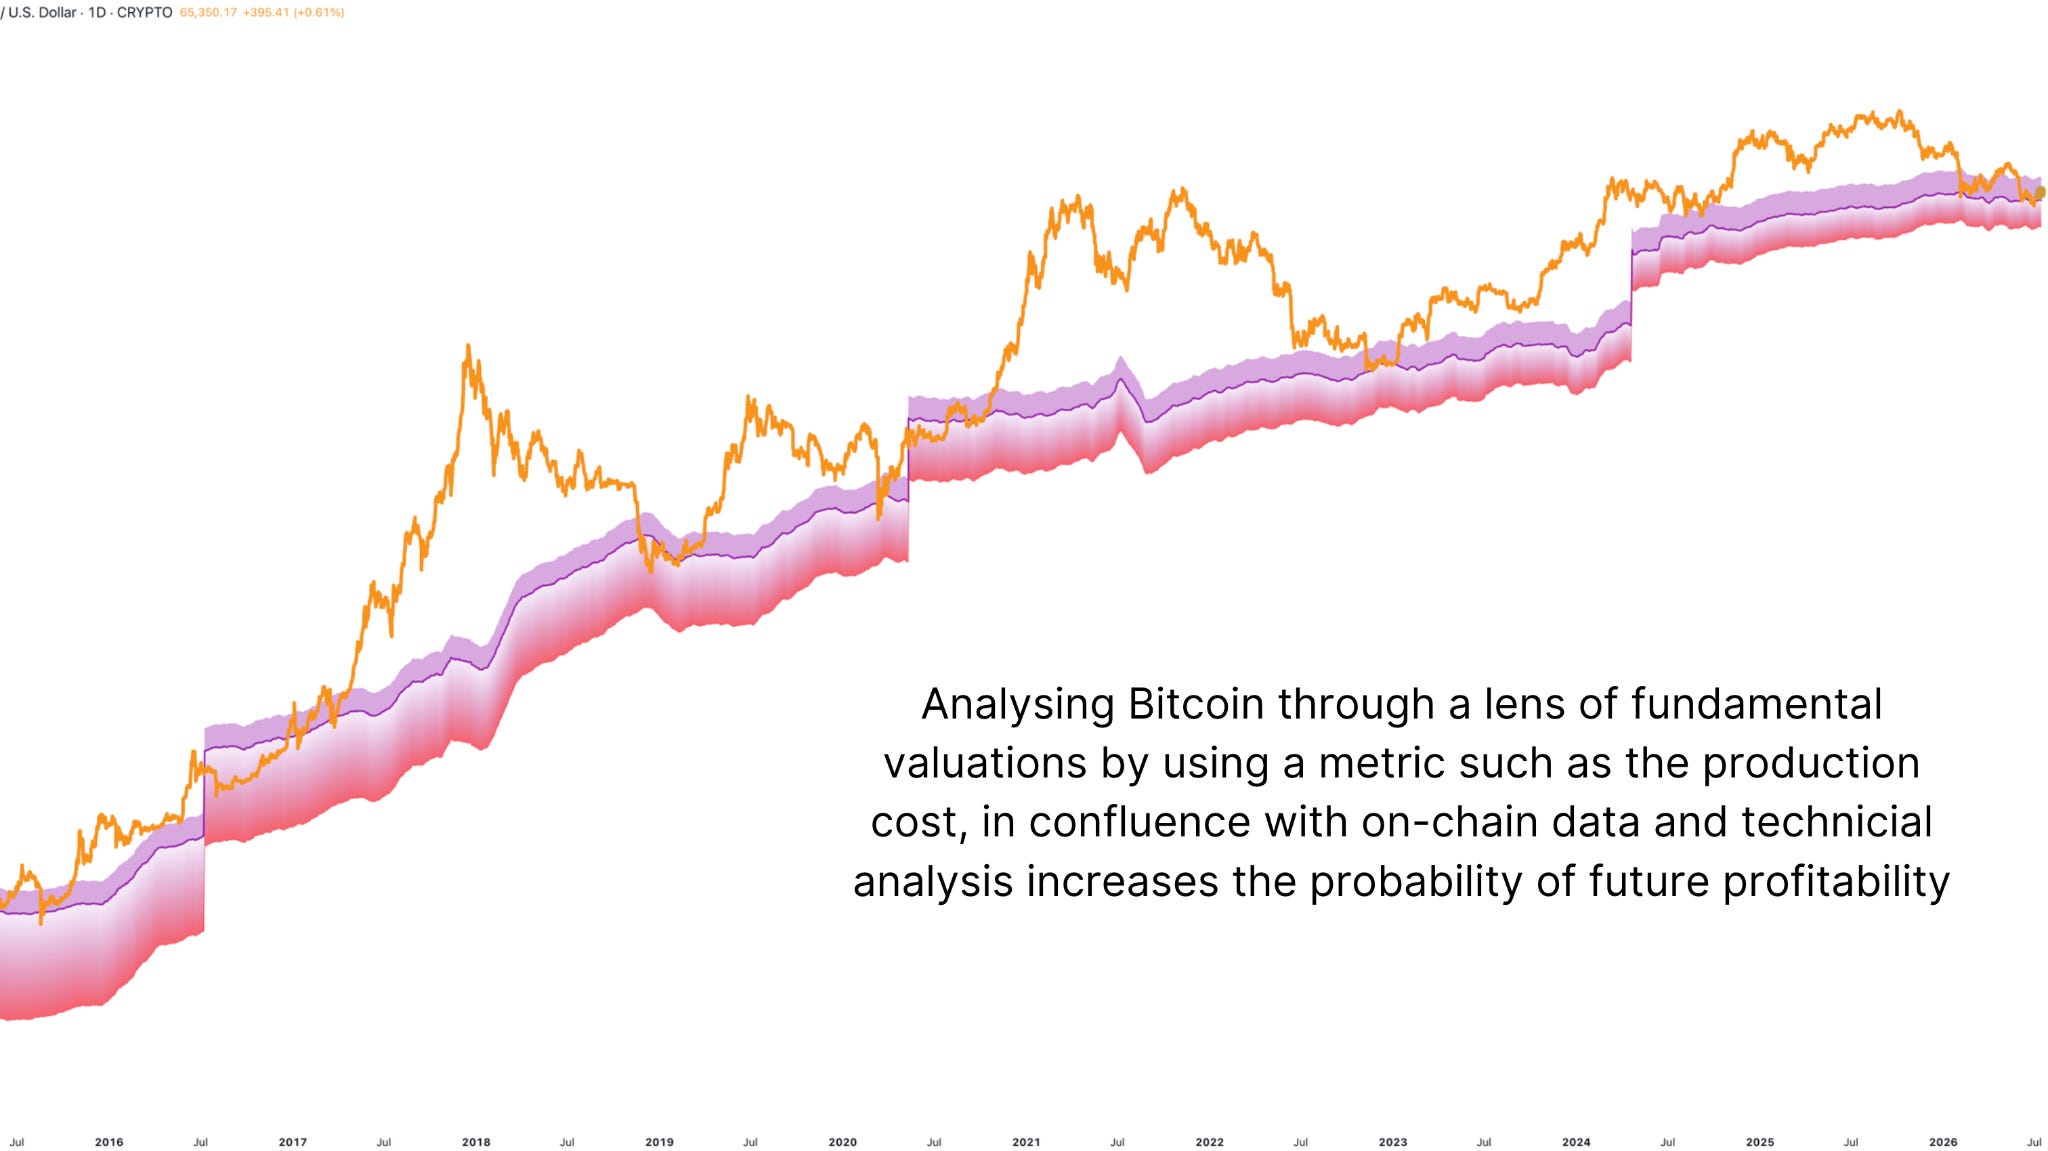
Figure 5: The same model can run on other metrics and still generate profitable trading signals.
To Sum It Up
The chances of going all in at the exact bottom and all out at the exact top are close to zero, and the stress of attempting it is enormous. What the data shows is that you don’t need to. A simple, rules-based framework, buying nothing when the market is expensive, steadily when it’s fair, and aggressively when it’s historically cheap, beats blind dollar cost averaging almost all of the time, with smaller drawdowns and far less second-guessing along the way.
Watch our most recent YouTube video here: The Data PROVES This Strategic Bitcoin DCA Method (471% Better)
Matt Crosby (@MattCrosbyPro)
Director of Research & Analytics
Bitcoin Magazine Pro

For more detailed Bitcoin analysis and to access advanced features like live charts, personalized indicator alerts, and in-depth industry reports, check out Bitcoin Magazine Pro.
Make Smarter Decisions About Bitcoin. Join millions of investors who get clarity about Bitcoin using data analytics you can’t get anywhere else.
We don’t just provide data for data’s sake, we provide the metrics and tools that really matter. So you get to supercharge your insights, not your workload.
Take the next step in your Bitcoin investing journey:
Follow us on X for the latest chart updates and analysis.
Subscribe to our YouTube channel for regular video updates and expert insights.
Follow our LinkedIn page for comprehensive Bitcoin data, analysis, and insights.
Explore Bitcoin Magazine Pro to access powerful tools and analytics that can help you stay ahead of the curve.
Invest wisely, stay informed, and let data drive your decisions. Thank you for reading, and here’s to your future success in the Bitcoin market!
Disclaimer: This newsletter is for informational purposes only and should not be considered financial advice. Always do your own research before making any investment decisions.
Also, does the model adjust for trading fees?
How do I get access to this tool? Does advanced level subscriber get it? or only pro?