The Deep Dive Weekly Recap, 6/19/21-6/25/21
Largest Difficulty Adjustment In Bitcoin’s History Incoming (?)
At the time of writing, Bitcoin is expected to have a -20.8% difficulty adjustment, with 651 blocks to go. Listed below are the largest difficulty adjustments in Bitcoin’s history, making the impending difficulty adjustment the largest downward adjustment in history if blocks continue to be mined at the same pace.
As covered in previous Daily Dives, hash rate has declined at a historic rate following the mining bans in China. The Bitcoin network is extremely resilient to such disruptions due to simple economic incentives, but the hash rate migration is having a short/medium term impact on the market.
Miner revenues have decreased by 64.5% from the all-time high of $67,434,000 per day (seven-day moving average) made on May 10. The pressure this has placed on the remaining miners on the network has led to further downside in the bitcoin price.
Another factor at play with the mass migration of miners from the East is that many of these firms and operations kept nearly all of their reserves and liquid cash balances in bitcoin, and as a result, these entities have had to sell to cover the high cost of moving operations.
Bitcoin The Commodity
“The price of any commodity tends to gravitate toward the production cost. If the price is below cost, then production slows down. If the price is above cost, profit can be made by generating and selling more. At the same time, the increased production would increase the difficulty, pushing the cost of generating towards the price.” - Satoshi Nakamoto
An important thing to understand is that bitcoin in the most simple sense is a commodity, with a production cost.
However, what makes bitcoin different from every commodity before it is the fact that unlike every other commodity before it, the supply issuance of bitcoin is inelastic. When the price of bitcoin rises, and more miners attempt to compete in the “production” of bitcoin, difficulty adjusts upwards, making the mining process more difficulty on a relative basis.
This is what makes bitcoin the world's best monetary asset. With every form of commodity money before it, producers had an incentive and the ability to flood the market with new supply, to siphon value from existing holders. With bitcoin, miners sell as little as possible and HODL the difference.
Thus, when the value of bitcoin drops significantly, and producers stop “producing” (read: mining) the commodity, difficulty adjusts downwards to ease margins and make it easier for miners.
Charles Edwards has put forth a metric called Bitcoin Energy Value, which takes various inputs into account to come up with an approximate “intrinsic value” of bitcoin.
The key thing to watch for is what the production cost of bitcoin is, relative to the market price. Over time, the market price of bitcoin has been mean reverting to the energy value. The energy value indicator of bitcoin should see a significant rise as ASICs leaving China are deployed across the world over the coming weeks and months.
Bitcoin Futures Volume
Historically, when futures volume tends to spike, it usually indicates some sort of local top or bottom. As you can see below, the last two spikes in futures volume have occurred while bitcoin was temporarily trading under $30,000. In the past, we saw a large futures volume spike during the January local top of $40,000.
Much of this increase in futures volume is due to forced liquidations. Meaning there are forced buyers and sellers in the market that otherwise would not be there, all because the price is moving against their long or short positions. These forced buyers and sellers add to previous price movement and over exaggerate local tops and bottoms.
HODL Waves
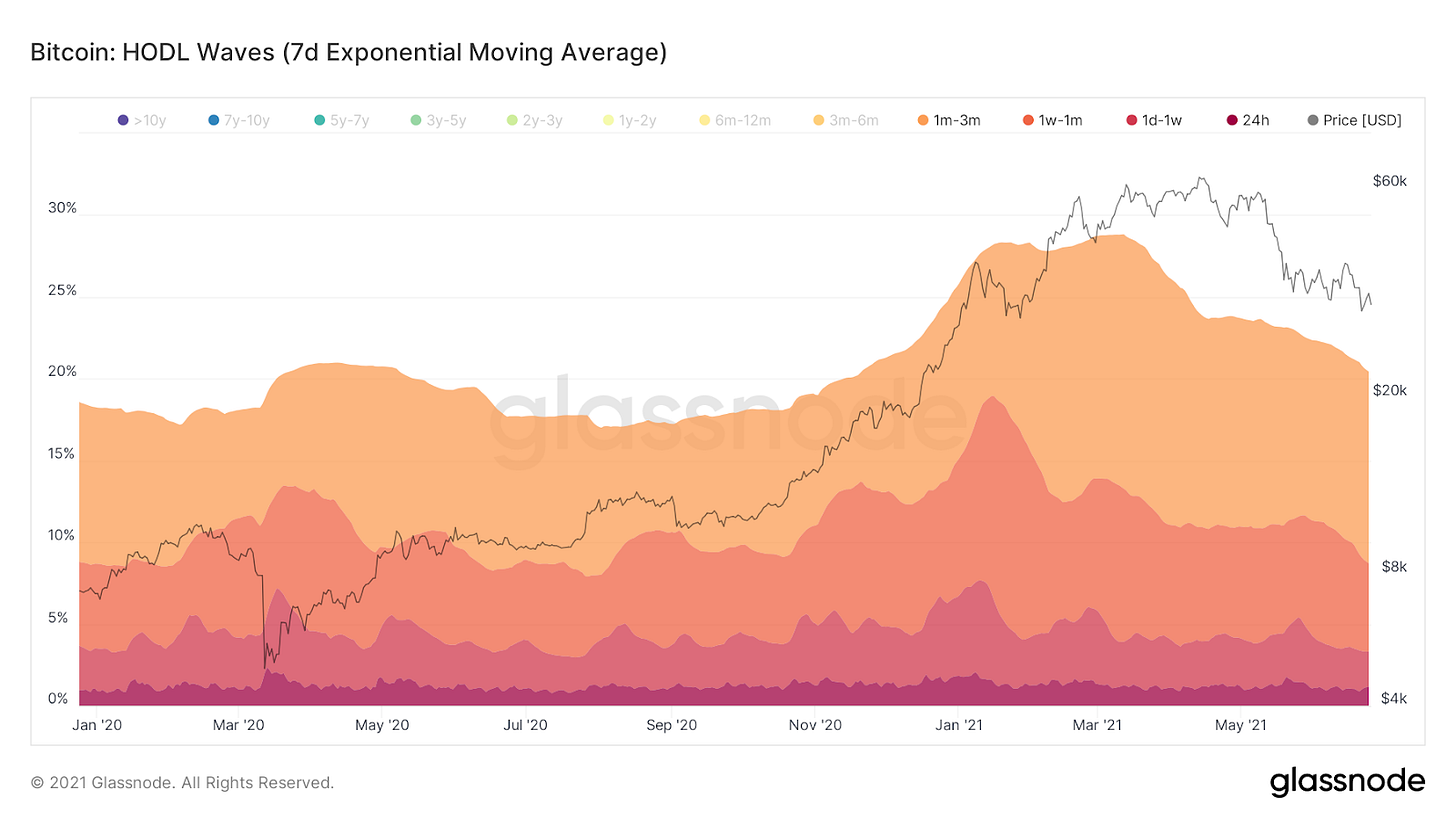
The HODL waves below bundle what percentage of the bitcoin supply was active in the past three months. It's notable that during the peak of this current bull run, this supply bundle failed to go over 30% unlike all other previous bull cycles. This indicates that the 2021 cycle has seen stronger HODLers (on a percentage basis) compared to previous cycles.
Furthermore, both 2013 and 2017 bull cycles had double tops in the HODL supply bands. 2013 was more noticeable and more severe than 2017, but it seems reasonable that we could experience similar activity this cycle.
Most recently, throughout the month of June, we’ve seen a sharp decline in the percentage of coins in the one week to one month HODL supply band. This indicates that throughout the drop in price bitcoiners have continued to converge on HODLing bitcoin as a natural monetary Schelling point at a rapid pace.
Spent Output Age Bands
The last week saw a distinct jump in UTXOs last move in January to March. With the drop to $29,000 earlier in the week, many investors seemed to have capitulated at a loss, further exacerbating selling pressure on the market.
Spent Output Profit Ratio
SOPR, the spent output profit/loss ratio, dipped further this week amidst the price plunge to $29,000.
This further confirms the view that much of the selling is taking place by investors who just recently entered the market, as anyone who invested before 2021 is deep “in the money” compared to their initial investment.
Throughout the history of bitcoin, SOPR breaches of 1.0 are meant for buying, and over the last two months there have been multiple.
Balance on Exchanges
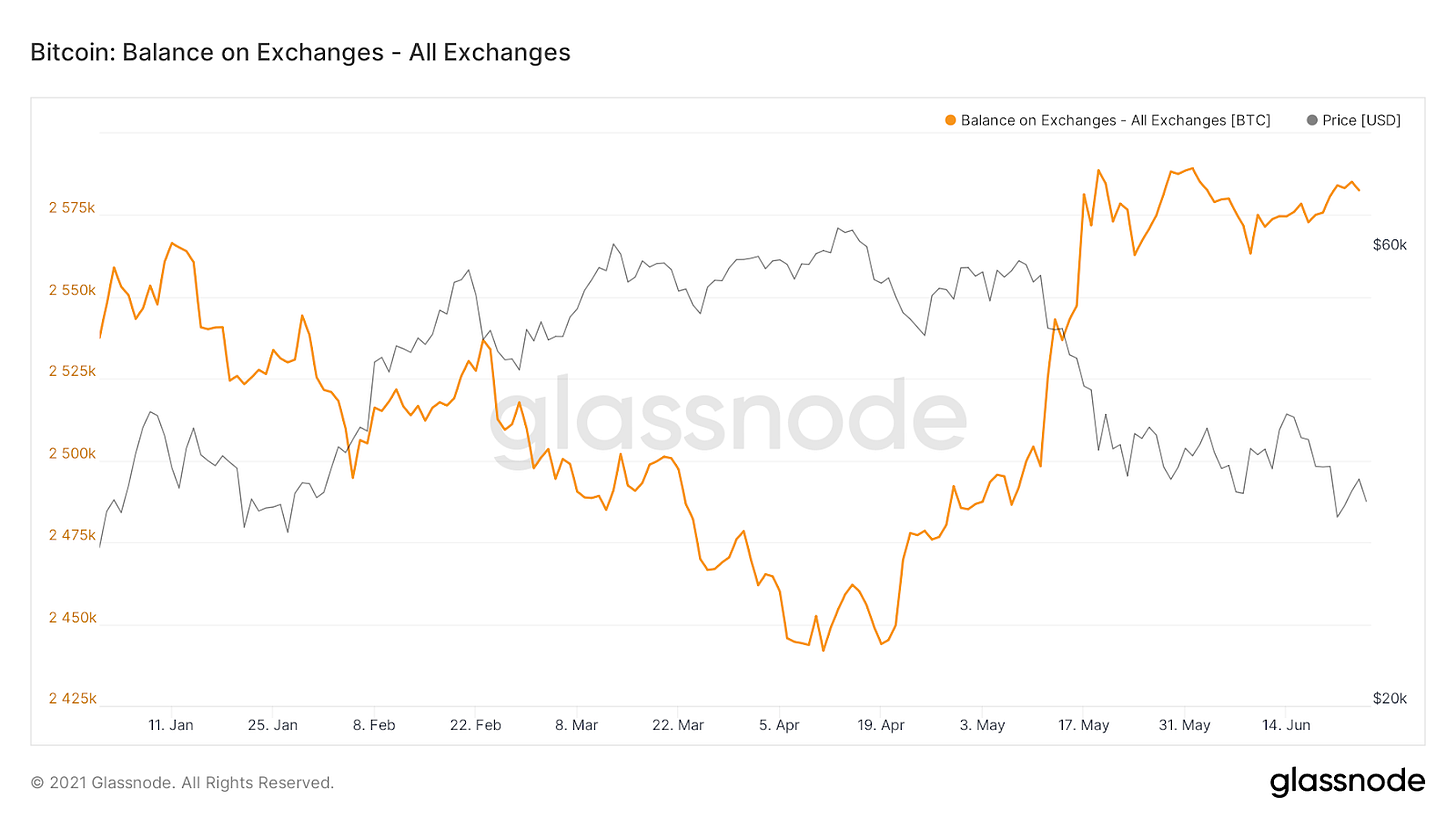
Much on-chain analysis recently has avoided talking about exchange balances. To catch up on this topic, this week we saw an uneventful continuation of the most recent trend, sideways. This isn’t particularly interesting per se, but it is interesting to see that exchange balances stopped increasing on the exact same day the bitcoin price first touched $30,000, on May 19th.
However, each exchange has seen its own series of inflows and outflows. In particular, Binance has continued to see a growth in their balance more than any other exchange. The most recent surge in the past week could partially be due to Chinese miners and holders trying to get their coins out of China because of the most recent serious crackdown on mining.
It is also interesting to note the dichotomy between bitcoin balances on Coinbase versus Binance as this market cycle takes place.
The trend is clear. Bitcoin is being withdrawn from Coinbase in almost a step-like function following the breach of the previous all time high of $20,000. Binance on the other hand has seen a sharp increase in bitcoin on the platform throughout the course of 2021, with many factors potentially contributing to this development. The recent mining ban in China definitely could be playing a role, but also the existence of derivative products on the Binanace exchange, while Coinbase remains entirely spot, is definitely a large factor.
NYDIG Fiserv Partnership
On Wednesday June 23rd, NYDIG announced a partnership with Fiserv, a leading global provider of payments and financial services technology solutions. With this future integration, financial institutions of all sizes can enable customers to buy, sell, and hold bitcoin directly within their bank accounts.
This is an extremely interesting development as a NYDIG report “Bitcoin + Banking,” published in January 2021, indicated that 51% of non-bitcoin holders are interested in accessing bitcoin through their existing bank account.
Since over $13 trillionT of deposits exist in US bank accounts [St. Louis Fed], this partnership could open the flood gates of a whole new pool of capital. If U.S. consumers and companies are comfortable storing this amount of capital in Dollars earning practically 0% interest, they will likely store orders of magnitudes of additional capital in the hardest soundest monetary goods known to man.
Closing Note
The bitcoin market is in the midst of a large accumulation phase. The thesis is as strong as ever, and the relentless selling of late by miners, weak hands, and over-leveraged traders paints a wildly bullish outlook for the rest of 2021.
Only the strong hands will remain.
Bull runs are fueled by the transfer of bitcoin from weak to strong hands.


