The Deep Dive Monthly Report, March 2022 Preview
Become a premium subscriber to The Deep Dive to get access to this monthly report and all of The Deep Dive research. We will release the full monthly report to free subscribers next Friday, April 8.
Sign up with the button below to get 25% off a premium subscription and access to the full report.
PREPARED BY:
Dylan LeClair, Head of Market Research
Sam Rule, Lead Analyst
Summary:
On-Chain Market Dynamics
Last Active Supply, Illiquid Supply
Market Momentum, STH LTH Ratio
Delta Gradient, Exchange Balances
Top BTC Treasuries
Bitcoin Derivatives
Perpetual Swaps Market
Futures Annualized Rolling Basis
Risk-Free Rate, Crypto-Margined Open Interest
Bitcoin Mining
Hash Rate Growth YTD
Hash Price, Monthly Revenue
Transfer Volume Miners To Exchange
Macro Landscape
U.S. Treasury Yields
Bitcoin VIX Relationship
10-2 Spread, High Yield Index Less CPI
Market Outlook, Concluding Thoughts
Executive Summary
Bitcoin began trading the month at $44,000, with a monthly low of $37,000 before rebounding along with a basket of risk assets, reaching as high as $48,000, reclaiming critical technical support levels along the way. The rally in bitcoin in particular was additionally fueled by short covering by defensive derivative traders who went entirely risk-off, as shown by funding rates in the perpetual swap market. While macroeconomic uncertainty remains despite the strong rebound in risk assets, bitcoin remains uniquely positioned to outperform due to its extremely strong supply side dynamics and lack of long-biased derivative market positioning.
On-Chain Market Dynamics
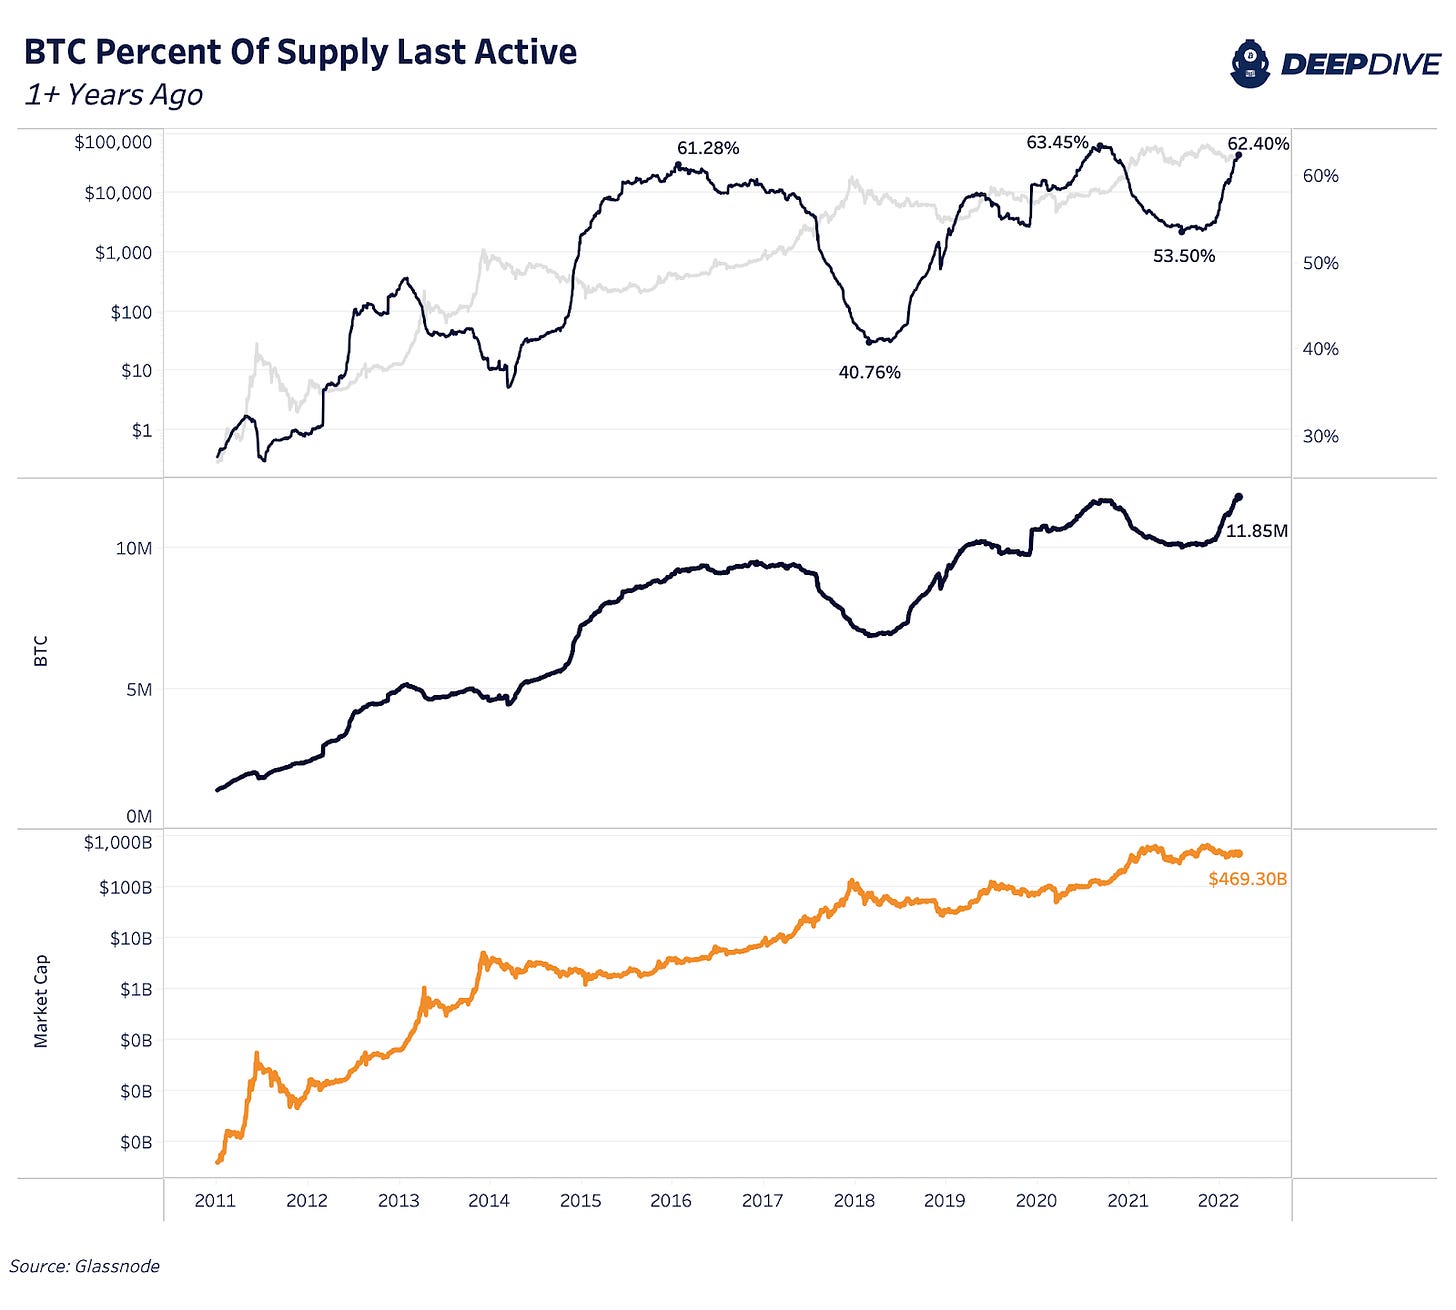
As mentioned in the executive summary, the bitcoin market so far in 2022 has been pricing in two separate realities. The first being a deteriorating global economics picture and a risk-off sentiment, with the second being bitcoin supply side dynamics that haven’t looked as strong since before the market went parabolic in early 2020. We have a few ways of quantifying the supply side dynamics for bitcoin, and we can start with the most intuitive: the percentage of circulating supply that has been held for over one year.
The price of bitcoin (as well as any other asset) rises when the marginal seller is exhausted, and thus the larger the percentage of circulating supply that is being held and not traded on the market, the easier it becomes for buyers to absorb sell pressure, and the more likely that supply-and-demand imbalance is resolved by higher prices.
It is no coincidence that the prior periods where 60%+ of the circulating supply of bitcoin were held for over one year was right before price went parabolic. While it is certainly no guarantee that price goes parabolic in short order, what we do know is that there is only one other time in history where coins have been this tightly held over a one-year time frame.
In aggregate terms, because there are more outstanding bitcoin today than in September 2020, there has never been a period where more bitcoin hasn’t moved over a one-year time frame: 62.40% of held bitcoin supply equates to 11.85 million bitcoin with an approximate market capitalization value of $469 billion.
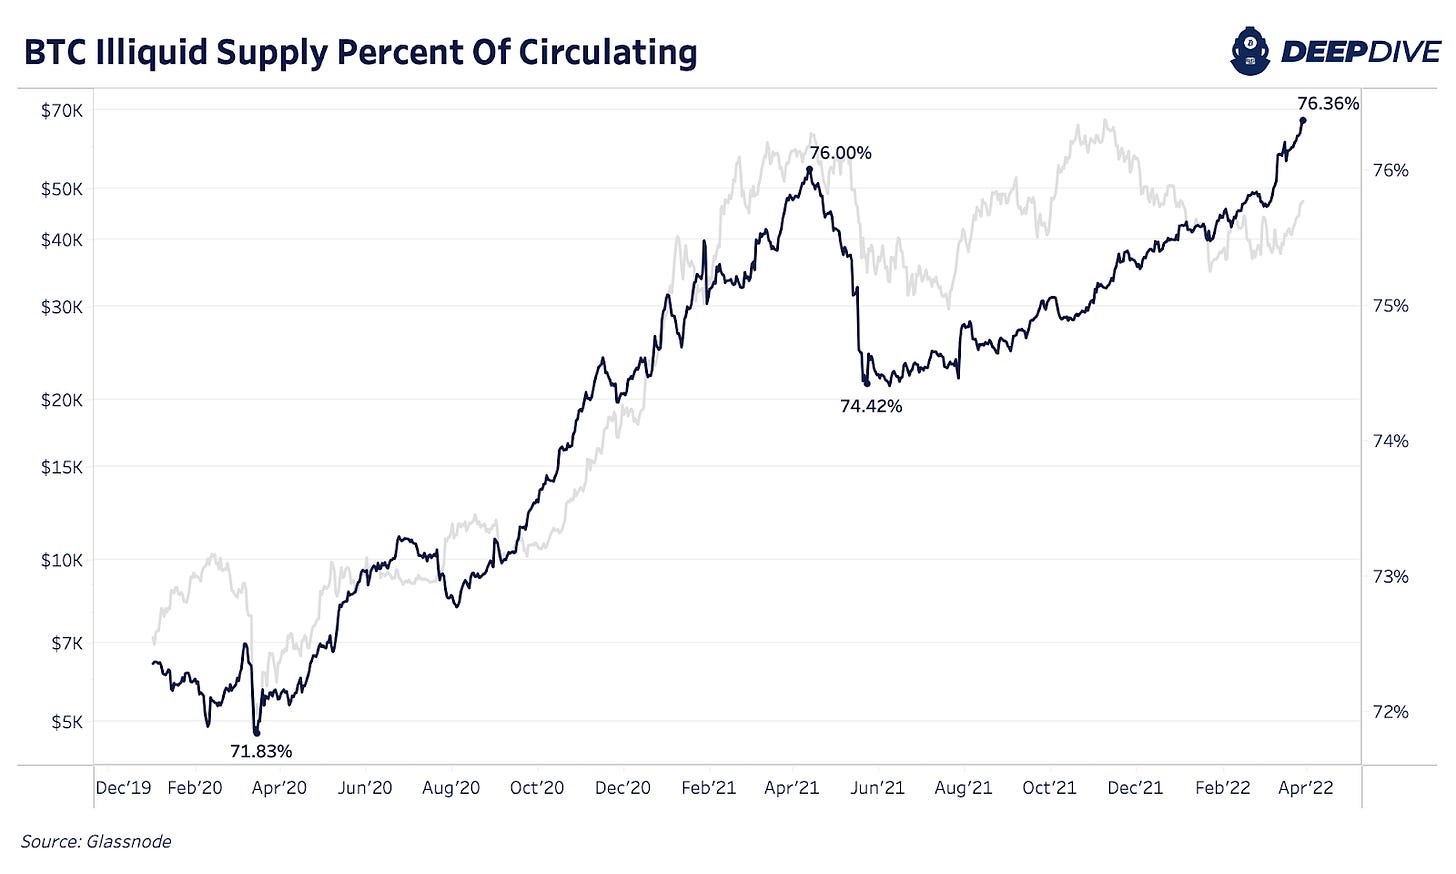
Similarly, we can look at illiquid supply as a metric for quantifying bitcoin’s supply side dynamics. Illiquid supply essentially is defined as the cohort that is the statistically least likely to move/spend their coins once they have been acquired.
To read more about the quantification of supply liquidity, read here.
Illiquid supply continues bending upwards, as a relentless accumulation by HODLers continues, with over 76% of circulating supply now being quantified as illiquid, a four-year high.
While one may look at the chart above and come to the conclusion that price is directly correlated to the percentage of illiquid supply, a look at the all-time chart quickly disproves that, but why?
The most important change in the supply side dynamics, and the reason for the distinct trend shift in 2020 is the bitcoin halving. Since the third halving on May 11, 2020, where the block subsidy halved from 12.5 BTC per block to 6.25 BTC, an additional 623,343 BTC were added to the bitcoin circulating supply. In that same period, illiquid supply increased by 1,170,404 BTC.
Essentially, what we can take from these numbers is that with the third bitcoin halving event, organic reservation demand for bitcoin as a reserve asset for the first time began to severely outpace new additional supply issuance, which continues to restrict the bitcoin supply as time goes on.
A look at the 30-day rate of change of illiquid supply also displays the powerful trend that has emerged, with relentless accumulation occurring since the start of 2020. The only exception to this trend is the reaction to the Chinese mining ban, in which a large amount of previously strongly held coins hit the market in short order.
Market Momentum
Historically, one of the best ways to gauge the status of the bitcoin market was to look whether price was trading below the cost basis of short-term holders. In the world of on-chain analytics, we refer to this cost basis as realized price, and the history of the realized price of short-term holders and the bitcoin market is significant. When price is trading above the cost basis of short-term holders, the bull market feeds on itself, as most market participants are in the money and unwilling to sell. Any additional market actor competes on the bid side to secure an allocation. Bitcoin, due to its absolute scarcity, trades unlike many other assets on the planet, with positive market momentum oftentimes feeding on itself. Shown below is a history of the bitcoin market and its position relative to short-term holder cost basis.
We have covered this dynamic extensively in previous issues, but it is of particular importance because price just recently reclaimed this pivotal level.
Similarly, a look at the ratio of the cost basis of short-term holders and long-term holders, which is eloquently named the “STH LTH Ratio,” yields quite the significant historical backtest.
While we have explained this ratio in depth in previous issues, a summarized version is as follows: the price of bitcoin rises when the marginal seller is exhausted, which forces new money to competitively bid to acquire a position (as described above for the cost basis of short-term holders).


