The Deep Dive Monthly Report, October 2021
If you have any issues viewing this report through e-mail or mobile, you can view the full report on Substack here.
PREPARED BY:
Dylan LeClair, Head of Market Research
Sam Rule, Lead Analyst
Summary:
On-Chain Accumulation Trends
LTH Supply Peak, Supply Shock, SOPR
Exchange Balances Decline, Active Addresses
Supply in Profit, Coin Days Destroyed, URPD
Derivatives
Bitcoin Futures ETF & CME
Stablecoin-Margined Futures
Perpetual Futures Funding
Bitcoin Mining
United States Growth And Hash Rate Share
Public Miner Growth, Hash Rate Recovery
Miner Revenue Per Hash, Difficulty Adjustment
Executive Summary
October was an exciting month for bitcoin’s bullish cycle momentum and can be summarized in a few key trends.
Exchange balances are at three-year lows while the long-term holder supply hits all-time highs. The monetization of bitcoin continues with realized price reaching new all-time highs as convicted holders stack and set new price floors. Bitcoin miner profitability is the highest it’s been in the last 2.5 years while hash rate is up 84% from July lows. All of this is happening while the derivatives market is now only 45% bitcoin-margined, down from 70% in April, which dampens the impact of leveraged long liquidations affecting market price drawdowns.
We’re witnessing some of the most bullish cycle market indicators observed in bitcoin’s history and now we wait to see the pending show and fireworks play out over the next few months.
On-Chain Accumulation Trends
The transparency of the bitcoin public ledger shows us insights on human behavior and supply and demand market dynamics that we’ve never been able to witness before. This month, the on-chain activity continues to point to rising accumulation trends in the market that look close to reaching a possible peak, as we await to see how the current bull market will unfold.
One of the most important trends in on-chain analytics this year has been the growth in long-term holder accumulation. This accumulation has occurred at a rate that we have never seen before during a bull market. Long-term holders are known as the “smart money” and their behavior drives changes in bear and bull cycle markets since they own a majority of circulating supply, now over 70%.
The long-term holder supply continued to climb to new all-time highs this month, but it now looks to be reaching a potential peak and cooling-off point since October 18. This can be seen with the month over month change in long-term holder supply (otherwise known as long-term holder net position change) flattening.


What comes after the potential peak of long-term holder supply is the exciting part of the market. The catalyst for major price moves upwards is simply a lack of available supply on the market, which causes new money looking to secure allocations to have to competitively bid the price. The rising price unlocks previously-held supply by long-term holders, which is why in previous parabolic bull markets that long-term holder supply draws down. This dynamic is covered extensively in The Daily Dive #081 - HODLer-Engineered Supply Squeeze.

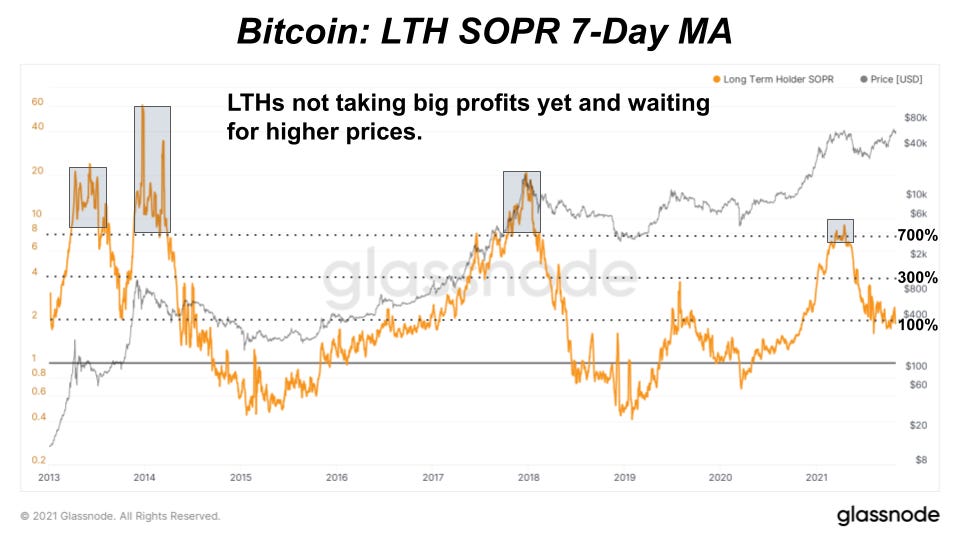
As long-term holders start selling more to new market entrants at higher prices, we will see increased profit taking which is reflected in the SOPR (spent output profit ratio) or simply put, price sold over price paid. We haven’t seen the level of profit taking yet to signal that the cycle is over. During the previous all-time high, long-term holders realized profits over 700% during a seven-day average. The highest peak level of profit taking on one specific day over the last few weeks was 300%. Long-term holders took profit at the previous all-time high and are now waiting for even higher prices.

An additional reason for this trend has been the increase in cost basis (technically, the realized price) for long-term holders over the coming months. This should be viewed as a welcomed development for bulls, as a rising cost basis for long-term holders relative to market price is a sign that the market is nowhere near overheated levels. This is covered in further detail in The Daily Dive #086.

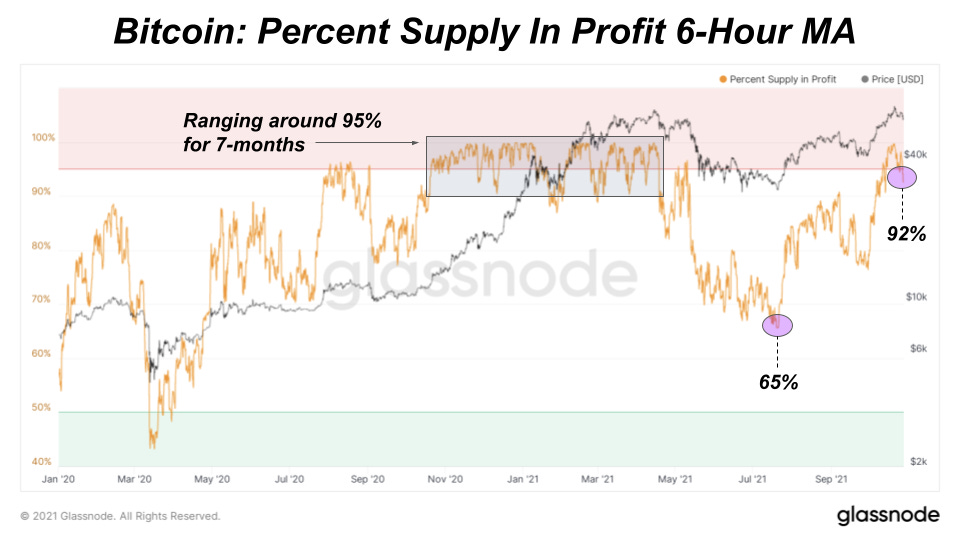
Long-term holders and the rest of the market have experienced watching their bitcoin holdings go from 65% of supply in profit, to 92% in just a matter of months. As the percentage of circulating supply in profit climbs higher, this typically marks a new bullish leg up with the percentage of supply in profit ranging over 95% for months before cooling off.

The long-term holder supply as a ratio to short-term holder supply is a “supply shock” type of indicator that indicates higher prices are on their way as this ratio reaches a peak in this green upper bound. We saw yet another major peak start to unfold this month:

We can also see long-term holders waiting for higher prices looking at CDD (coin days destroyed) as a 90-day rolling sum. Coin days destroyed is calculated by multiplying the number of coins in a transaction by the number of days it has been since said coins were last moved. It’s a useful indicator to best understand what is happening with “older” coins and the holders of those coins. This is an accumulation dynamic that we pointed out in August in the Daily Dive #050:
“We have covered the heavy bitcoin accumulation extensively in The Deep Dive previously, but the significance of these accumulation trends in regards to the bitcoin price action is real. If we continue to witness aggressive accumulation by new and incumbent participants alike without a bounce in coin days destroyed, the market will be fighting for a small free float of bitcoin available for sale, in which parabolic price action should be expected.”
That’s exactly what is still happening today as the free-float supply gets pushed to new lows ready to spring forward amidst a parabolic price move.

The circulating supply of the market can be broken down into long-term holders, short-term holders and balances on exchanges. As mentioned above long-term holder supply has flattened out. At the same time short-term holder supply has slightly increased over the last couple of weeks, which leaves balances on exchanges continuing their secular decline hitting new three-year lows. These lows were further driven by July and September outflow months, some of the largest in bitcoin’s history.
As bitcoin starts to change hands to new short-term holders, we expect to see a rise in balances on exchanges when more selling begins. After the dynamics have played out, balances on exchanges will likely continue the secular decline as a growing cohort of HODLers are not taking profits, with the majority of their supply rising.


Another bullish cycle signal still playing out is the rising active addresses which coincides with higher prices as new activity on the network ramps up. All of the previous price moves are accompanied by substantial growth in active addresses which are mostly driven by growth in new addresses or new market participants.

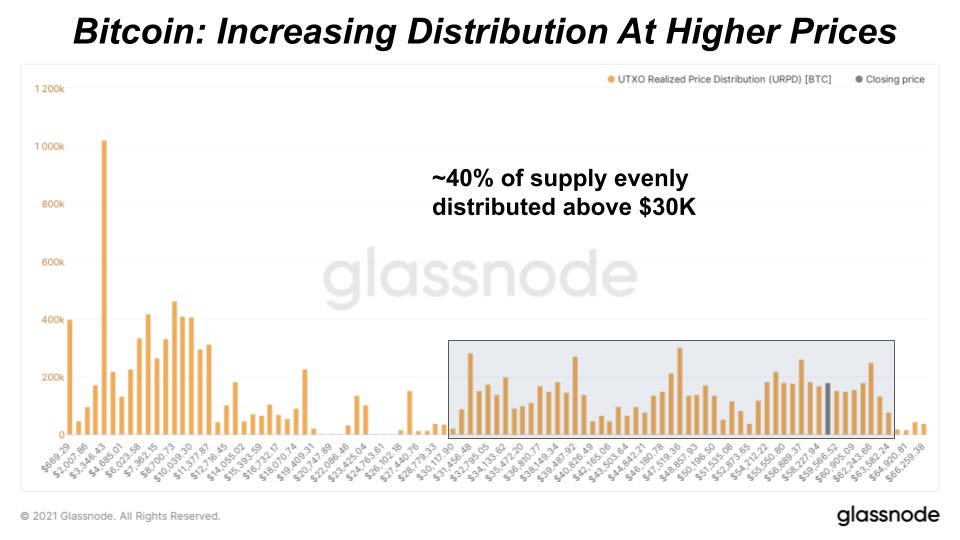
As bitcoin breached its new all-time high this month, the market has been primed for a new wave of price discovery with very little resistance, sitting above $65,000. As it stands, the bitcoin supply is fairly distributed above the $30,000 threshold which makes up almost 40% of supply. 5.69% of supply has last changed hands in the $60,000 to $70,000 range. As for now, we look to continue consolidation below the all-time high before a retest takes place into November, which is historically one of the best months for price appreciation during bull cycles.


Futures And Derivatives
October was a very important month for the bitcoin futures and derivatives market. The most noteworthy event was the approval and launch of multiple bitcoin futures ETFs in the United States.
CME Futures
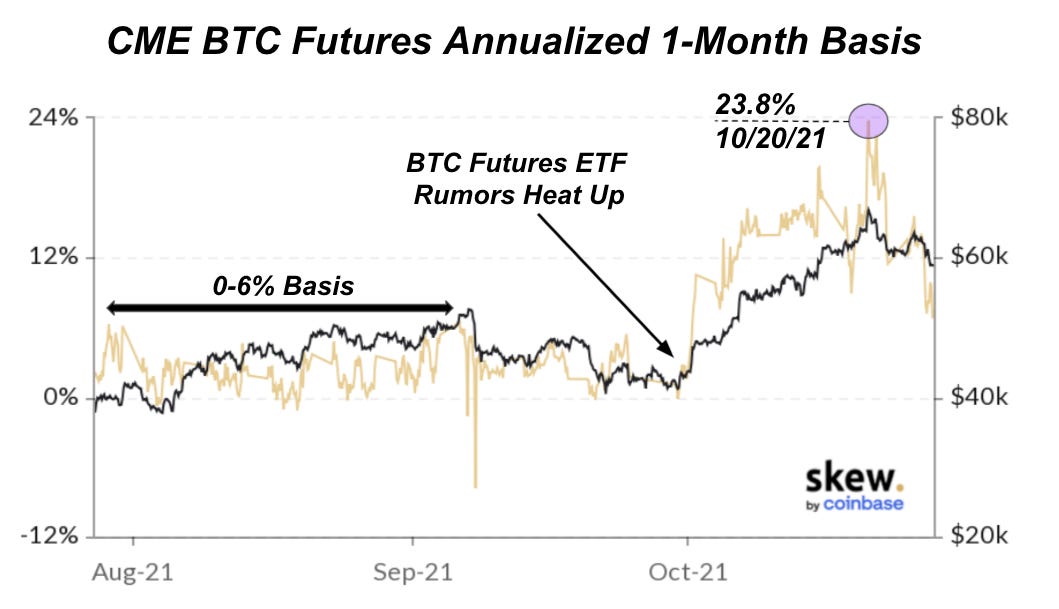
The bitcoin futures ETFs offer bitcoin exposure through the Chicago Mercantile Exchange, and interestingly enough, futures traders started to front a potential approval early in the month, hinting that the market knew an approval was imminent. One look at the annualized basis between the bitcoin spot price and the one-month futures price on CME tells the story.
$BITO is the first bitcoin ETF; it began trading on October 19, and the product saw record inflows, which led to a large net increase in open interest on the CME. While the large increase in open interest for CME bitcoin futures was aided by the futures ETF beginning to trade on the market, a large factor in the increase was traders' front running of the approval. The one-month rolling basis on CME aggressively spiked at the beginning of October as ETF rumors began to fly around.
Similarly, aggregate open interest on the CME also began to aggressively spike into October:

The most important thing to understand in regards to the large increase in open interest on the CME is that the exchange requires 40-50% in margin, which means that the max amount of leverage to be obtained by traders is approximately 2x. Additionally, spot bitcoin is not able to be used as collateral; this reduces convexity to the downside as it comes from traders entering margin-long bitcoin positions with bitcoin as collateral.
This distinct market shift can be seen by looking at the market share of CME futures as a proportion of aggregate open interest. The local high in April was driven by speculators and traders going margin-long with bitcoin, which is something we have extensively covered in The Deep Dive.

The steep rise in CME open interest has played a large role in the percentage of open interest collateralized with bitcoin trending down since the market top in April, and this should be a very welcome development for bulls.
Open Interest Collateral Breakdown

In The Daily Dive #084 — Derivatives Market Analysis, we covered these developing dynamics in depth and the potential ramifications.
Futures Basis
Another trend that we have followed closely is the annualized rolling basis for three-month bitcoin futures. This is the annualized return that can be achieved by selling bitcoin futures and buying spot. This strategy allows traders to achieve a return while being completely market neutral.
In the spring, this annualized return skyrocketed to as high as 45% as speculators were aggressively bidding up the bitcoin futures curve; but without a strong underlying spot bid following this speculation, the basis collapsed as leverage on the long side of the market was purged over the next few months.

This basis flattened in late July with the market bottomed, and has since recovered to a modest 13.78% at the time of writing. This is partly due to the approval of a bitcoin futures ETF and increasing inflows into futures-associated products, but there are significant second order effects of this development.
A consistently positive basis on forward-dated futures (formally known as “contango”) places a large financial incentive for outside investors and market participants to enter the bitcoin spot market to capture the market-neutral yield. While many allocators may not have any particular interest in bitcoin (these people and institutions somehow still exist), the risk-free yield available in the bitcoin futures market absolutely crushes anything that can be found in the global fixed income market.
Perpetual Futures Funding
When looking at the funding rate for perpetual swaps, it is clear that the bitcoin market is in quite the different spot compared to the previous time it was trading above $60,000. The funding rate for perpetual futures contracts is a way to tether the market to the underlying bitcoin spot price. When funding is positive, long positions periodically pay short positions. When funding is negative, short positions periodically pay long positions.
Thus, when the price of a perpetual swap contract deviates too far from the spot index, a financial incentive arises in the form of the funding rate which charges/pays traders a percentage of their notional position value periodically. Periods of extremely high funding can show that the market is being propped up by leveraged traders, which is what occurred in the spring. Moderately positive funding is not something that should worry bulls, as broadly, traders want to be the best performing asset of all time. Funding only becomes worrisome when there is a dichotomy between rising funding and falling spot price (bad news for bulls), or conversely when funding is going further negative while price rises (bad news for bears).
The two charts below show the average daily funding over the last years as well as the funding on an hourly basis for the month of October:

Notice the large funding spike during the break of the all-time high on October 21, when traders were paying 0.055% of their notional position size (60.22% annualized) to be long. These types of derivative-led moves are not sustainable unless they are met with large spot buying.
It is important to understand that derivatives can not drive the bitcoin market, they can only suppress and exacerbate volatility for given periods of time.

Bitcoin Mining
As we progress further in the year, the bitcoin mining industry and the hash rate of the network grows by the day. This month it has become increasingly clear that bitcoin mining’s new global home is in the United States, as the country’s share of global hash rate reached 35.4%, up from 4.2% in just one year.

*Note the data from Cambridge Bitcoin Electricity Consumption Index doesn’t accurately reflect China’s current hash rate based on IP address assumptions, but provides us with a rough, consistent estimate by country over time.
Data released by the Foundry USA Pool this month shows that New York, Kentucky, Georgia and Texas are the top states by hash rate share in their pool (Foundry USA isone of the top five largest-known mining pools in the world). Both Texas Governor Greg Abbott, and United States Senator Ted Cruz, expressed their support for bitcoin mining in the state with Texas Senator Cruz highlighting that “bitcoin mining is a way to strengthen our energy infrastructure” and noting that there is an enormous opportunity for bitcoin to help utilize wasted, flared natural gas in West Texas.
As the network recovers and transitions around the world, this has been one of the best opportunities for miners to make money with miner revenue in USD per hash approaching three-year all-time highs. All else being equal, miners are making more revenue for every hash they supply to the network right now and are 1.8x more profitable than they were at the beginning of the year.
Because of chip shortages and long lead times to bring back all of the previous China hash to the network, hash rate can’t come online fast enough as price starts to take off, making Q4 a promising time for miner profitability right now.

The hash rate recovery continues as expected, now up 84.37% from July lows and only 13.62% down from its seven-day moving average all-time high. We expect hash rate to reach or surpass all-time high levels in Q4 and see some incredible growth into 2022.
Based on announced plans and targets from the top eight public bitcoin miners, their hash rate will grow 267% by end of year 2022. These projections are based on new, pre-ordered machines that will mostly be manufactured and shipped next year. The progress will depend on the state of supply chain disruptions and chip shortages in the market.

In response to the hash rate recovery, the mining difficulty adjustment continues its steep climb upwards every 2016 blocks as more miners scale up to take advantage of the increased profitability. After the largest downward difficulty adjustment in history, the difficulty adjustment has experienced one of the steepest increases in just over three months, totalling 58.41% with another 7.85% upward adjustment this week.

Macro
In terms of the macroeconomic landscape, our thesis and thoughts on the current environment remain unchanged for the most part. Here is an excerpt from The Deep Dive May Monthly Report,
“While any talk of tapering may at this point very well be jawboning by central bank governors, who seemingly have been hitting the airwaves daily to dismiss inflation concerns, the eventual attempt by the Fed to wean the market off of quantitative easing programs and/or raise the Fed Funds Rate would very likely end up exactly like the last, an utter failure, as a rise in bond yields tightens financial conditions as liquidity to dries up, causing volatility to explode and all risk assets sell off in tandem.
“Central bank liquidity injections cannot fix a solvency problem, and the very same central bank put that has eased markets for over three decades will one day work to no avail. Bitcoin is protection against both… but for the time being, it is still treated as a risk asset in a de-risking/illiquidity event, and allocators should plan accordingly.
“It is important to remember that bitcoin at this stage in its adoption phase is not a hedge against PCE/CPI (consumer price) inflation, but rather the dual threat faced by every capital allocator on the planet; perpetual credit expansion (dilution risk) that inevitably ends with a credit contraction leading to a deflationary bust (counter-party & political risk).”
Bitcoin is THE largest and most significant story currently in global macro, and we find that the monetization process of the asset itself is what truly stands out, which is what we cover and document with our on-chain analysis.


As always, a great read.
Thanks for the in-depth information, I always look forward to reading your analysis when I check my mail.