The Deep Dive Monthly Report, November 2021
Released to Premium Deep Dive subscribers on 12/3/21
If you have any issues viewing this report through e-mail or mobile, you can view the full report on Substack here.
PREPARED BY:
Dylan LeClair, Head of Market Research
Sam Rule, Lead Analyst
Summary:
On-Chain Analysis
Realized Price, Realized Cap, MVRV
Net Unrealized Profit/Loss, HODL Waves, RHODL Waves
Long-Term Holder Supply, Supply Profit/Loss
On-Chain Cost Basis, UTXO Realized Price Distribution
Derivatives
Aggregate Futures Open Interest
Annualized Rolling Basis
Perpetual Futures Open Interest, Funding Rates
Bitcoin Mining
Hash Rate
Mining Difficulty
Miner Revenue, Hash Price
Risk Factors
Risk-On Asset Correlations
Strengthening U.S. Dollar
Federal Reserve Accelerated Taper
Elevated Futures Open Interest
Executive Summary
Relative to October, November was a more cautious month for Bitcoin as on-chain analytics remained largely bullish but short-term macroeconomic risk factors increased.
In November, we saw the continued monetization of bitcoin with Realized Cap hitting new all-time highs. Several cycle-top indicators across Market Value to Realized Value Z-Score, Net Unrealized Profit/Loss Ratio, and Realized HODL Ratio signal no signs of an overheated market, and remain in a neutral state. The short-term holder cost basis has acted as a key support for bitcoin price this month with increased supply building above the $50,000 range. Lastly, the percentage of bitcoin-margined futures open interest continued its decline below 50%.
Yet, the bitcoin price didn’t have the November increase that many expected as macroeconomic uncertainty has increased and as cycle dynamics deviate from historic trends. We cover these in the Risk Factors section at the bottom. Let’s dive in.
On-Chain Analysis
With the majority of our analysis, we find Bitcoin’s on-chain analysis to provide some of the most unique and valuable market insights compared to all other existing markets. This is due to its transparent public ledger and UTXO set design.
We’ve seen the first glimpses of on-chain analytics becoming normalized in legacy financial institutions and mainstream outlets. On-chain analysis helps guide our medium- to long-term view of the market while we supplement that with derivatives market and macroeconomic trends.
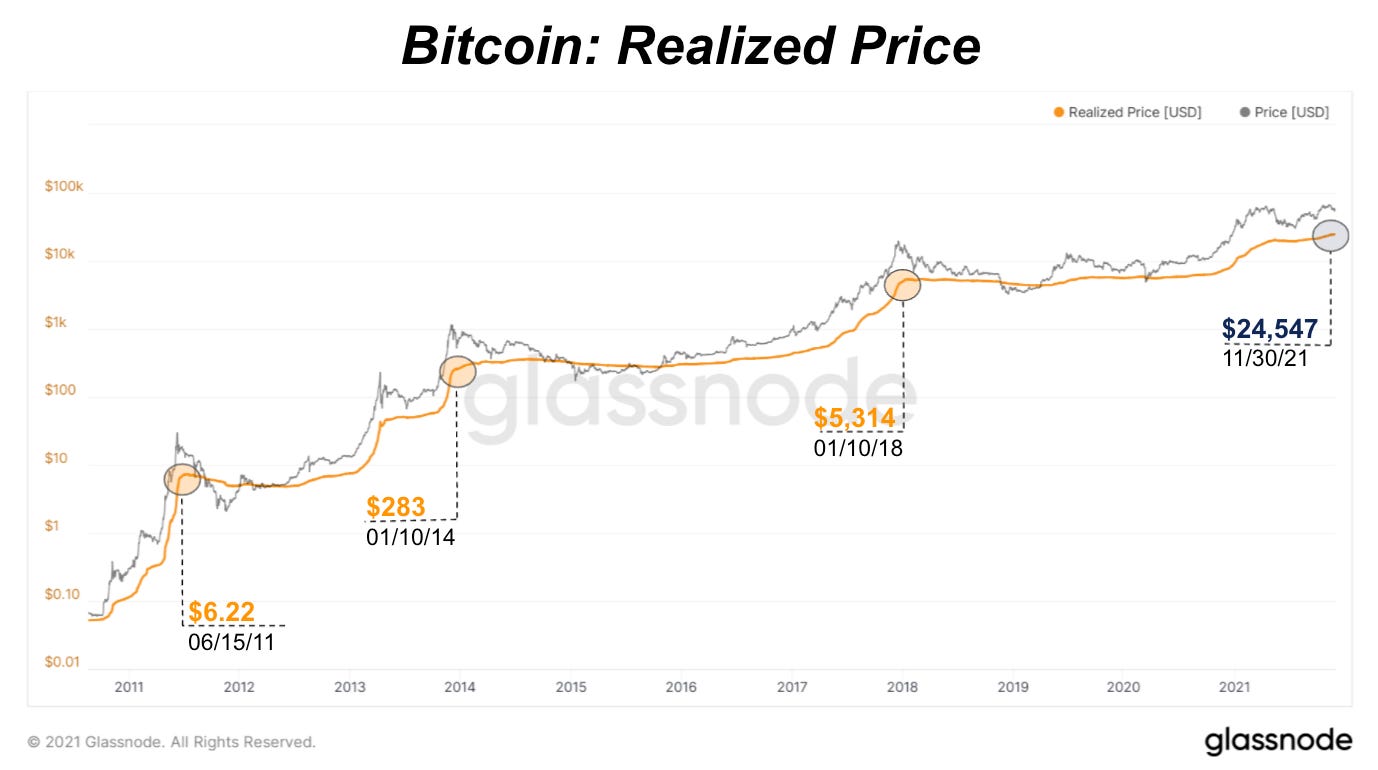
Zooming out, the direct monetization of bitcoin continues at a steady, logarithmic pace. The realized market capitalization and realized price, calculated by valuing each UTXO at the price it was last moved, hit all-time highs again in November. There’s been a rising up-trend in realized price since July signaling a continued accumulation with the market in a pre-parabolic phase.
Comparing the market cap to realized cap, the Market Value to Realized Value (MVRV), provides us with an indication of how overheated the market is. An overextended price (and market cap) to the realized price (and realized cap) reflects a widening gap between the market price and cost basis. You can read more in-depth coverage of Realized Cap and MVRV in The Daily Dive #106 and The Daily Dive #071.
Throughout bitcoin’s history, the market starts to become overheated when the MVRV Z-Score, capturing standard deviation moves from the mean, rises above 3.5. A value over 7 is historically a cycle-top signal. In November, both MVRV and MVRV Z-Score declined for the month signaling a neutral state of the market.
Along with MVRV, we can look at bitcoin’s Net Unrealized Profit and Loss (NUPL) metric in tandem. NUPL is a related view to MVRV since it’s calculated as (Market Cap - Realized Cap) / Market Cap. It provides us with another cycle top and bottom indicator signaling when there is too much unrealized profit, or too much unrealized loss in the market.
In November and over the last few months, the market has been ranging in a healthy state of unrealized profit aligned historically with previous bull cycles.
Next, we’ll examine HODL Waves. The traditional Hodl Waves metric displays bitcoin holding periods on-chain. For example we can see what percentage of the bitcoin supply has not moved in over a year, which currently sits at 54.45%.
Realized Hodl Waves weighs the various age bands by their realized price. This provides fantastic insight into the market, as during parabolic price action, not only does bitcoin held for long periods of time transfer hands, but those coins hold a disproportionate amount of weight in the realized market cap metric. With Realized Cap Hodl Waves, both of these dynamics are shown.
When looking at Realized Hodl Waves for bitcoin that has moved within the last six months, during local market tops these coins account for over 80% of realized market cap. Currently bitcoin moved within the last six months accounts for 51.70% of realized market cap.
The Realized Hodl Ratio similarly uses Realized Cap Hodl Waves to assess the state of the bitcoin market, by taking a ratio between the 1-week and the 1 to 2-year HODL bands. The metric rises as new coins hold a larger realized price. Currently, the metric is showing bitcoin is in mid-bull cycle range.
Over the last month, we’ve been closely analyzing the relationship between long-term and short-term holders. The behavior of these two groups tells us when bitcoin supply distribution versus accumulation is happening in the market, a metric which has been key to understanding bull and bear market cycles.
In November, long-term holder supply peaked and the distribution of long-term holder supply to new, short-term holders is starting to take shape. With the latest macro sell-off and rising uncertainty in future Federal Reserve Board policy, this could be a cautious move from some long-term holders to rotate into cash near-term or the start of a cyclical distribution phase.
We highlight these cyclical dynamics in the October Monthly Report saying,
“What comes after the potential peak of long-term holder supply is the exciting part of the market. The catalyst for major price moves upwards is simply a lack of available supply on the market, which causes new money looking to secure allocations to have to competitively bid the price. The rising price unlocks previously-held supply by long-term holders, which is why in previous parabolic bull markets that long-term holder supply draws down.”
Looking deeper into the long-term holder and short-term holder groups, we can analyze each group’s state of supply in profit or loss and the percentage of circulating supply.
The percentage of long-term holder supply in profit of all circulating supply is at its highest level ever with the total supply in profit and loss near 80%. The percentage of short-term holder supply is at all-time lows but starting to turn this month, as long-term holder distribution begins. Over the last two weeks, the short-term holder percentage of supply in loss has been rising, but still remains below the percentage that’s in profit. This dynamic is historically a primer for bull markets playing out as long-term holders accumulate circulating supply that squeezes the existing float supply that new, short-term holders can access.
What comes next is a distribution period of coins from holders to new entrants with such low float supply available on the market. The long-term holder net position change (and peak of long-term holder supply) shows a distribution period that started this month but that’s still only a fraction of peak distribution in previous cycles. One can expect that a majority of long-term holders won’t part with their bitcoin without seeing much higher prices.
Below is the current profit and loss breakdown of short- and long-term holders:
We can also look at the realized price of long- and short-term holders to gain insight. Currently the short-term holder cost basis is $53,125, and during bull market the cost basis of short-term holders is defended aggressively.
A display of the short-term holder market value to realized value (STH MVRV) over the history of bitcoin displays this dynamic:
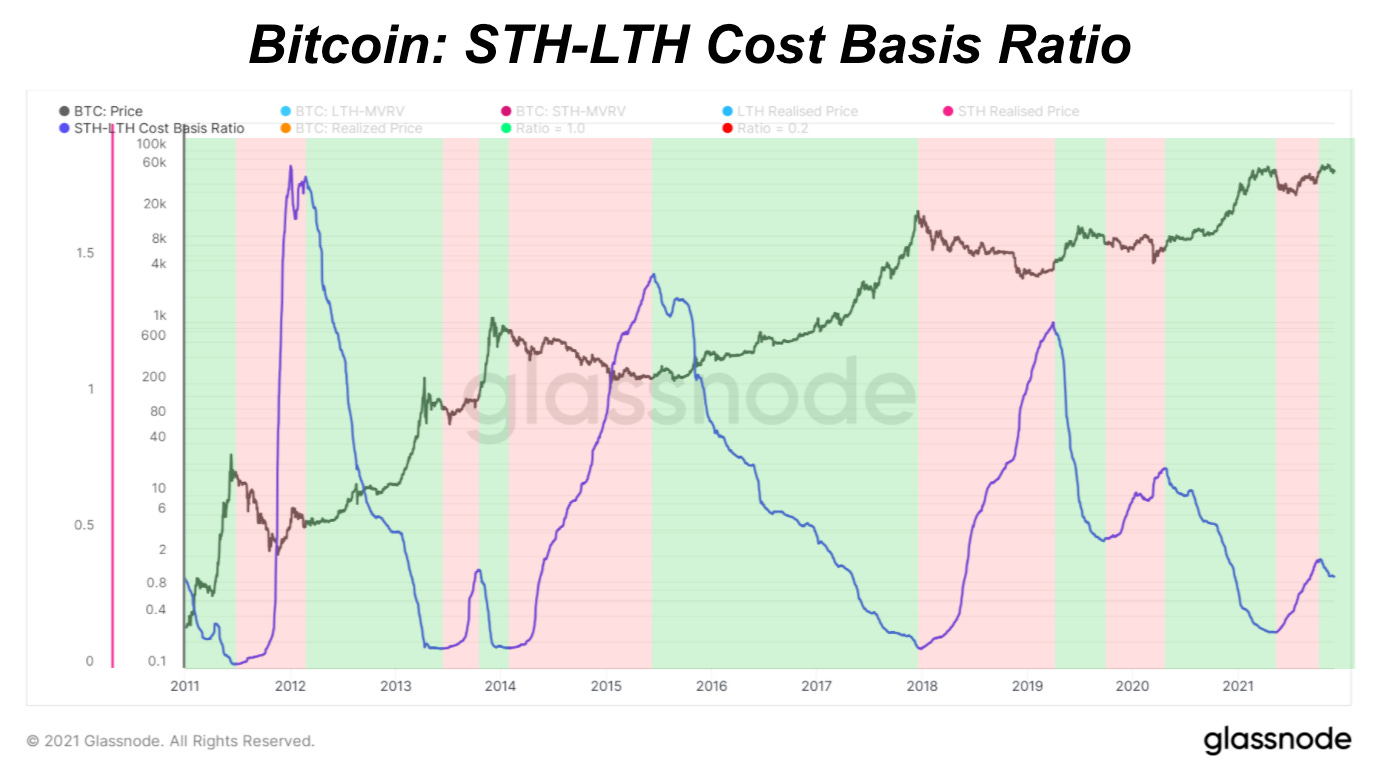
We also have the ratio between the cost basis of short-term and long-term holders which still is in a bull market trend. This metric was covered in detail in The Daily Dive #081 - HODLer-Engineered Supply Squeeze.
Lastly, we have the UTXO Realized Price Distribution, which is a great way to visualize what price every BTC was acquired for across the network. As shown below, currently 31.37% of circulating supply has last moved above $40,000.
Bitcoin Derivatives Market
Derivatives play a very large yet often misunderstood role in the bitcoin markets, and understanding what is unfolding in regards to leverage dynamics in the derivatives market can help investors make informed decisions as to whether it is an optimal time to allocate or invest with size.
While we hold the position that buying bitcoin to hold into the future at any price is a prudent decision, exogenous developments in bitcoin derivatives can alter the risk/return profile both in or against your favor.
With the price of bitcoin breaking all-time highs over the last month, open interest surged to all-time highs on an intraday basis (just short of all-time highs on a daily time frame), and many analysts began to warn of potential froth in markets.
An important thing to understand in regards to the bitcoin futures/derivatives market is that for every long position there is an equivalent number of short positions, so rising open interest alone is not cause for concern.
What should be watched by investors is the positioning of the market relative to the spot market, as this is what causes the dislocations and large volatility movements. Traders in the futures market speculate on future price movements, and during periods of peak bullish sentiment, the price of futures contracts months in advance trade far above the current spot price. In April of this year, 3-month forward futures were trading increasingly far above the spot market price, so much so that traders could receive over a 10% risk-free return over a 3-month period (over 40% annualized) just for buying spot bitcoin and shorting the futures contract.
While many expect the returns offered by bitcoin to far supplant a 10% or even a 40% annualized return over the coming months/years, futures contracts trading that far ahead of the spot market was a sign that speculative (and often very leveraged) risk taking was the primary driver in the market, and not spot market demand.
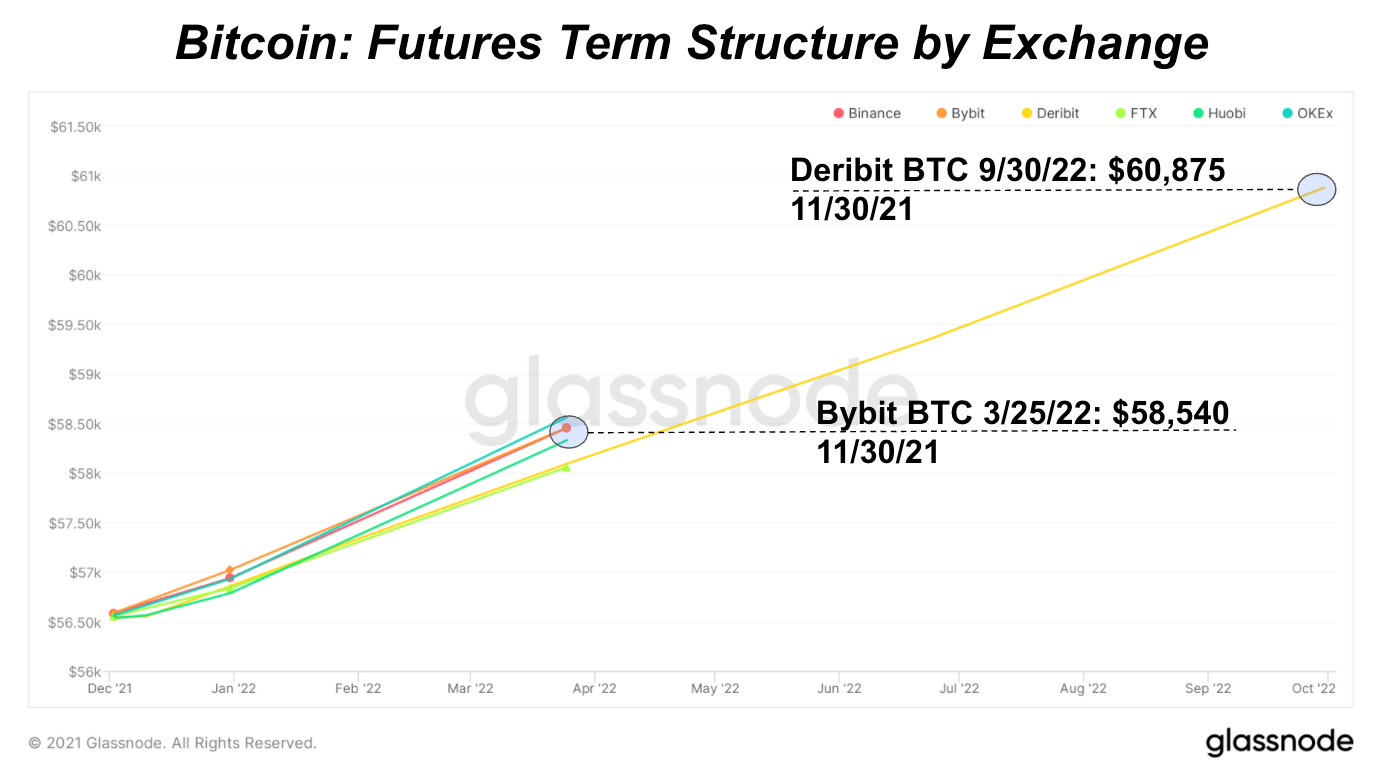
Another useful way to visualize the futures market is by looking at the term structure. Shown below is the current state of the bitcoin futures curve, with the September 2022 contract trading at $60,875, offering traders an approximately 9.75% annualized return over the current spot market price.
The most liquid and influential market in the bitcoin derivatives market is the perpetual swap, which is a futures contract that never expires but simply rolls over every eight hours. Traders/speculators can use both bitcoin (as well as other crypto assets) or stablecoins as collateral to enter a position, in which their position is marked to market every second.
To keep the price of perpetual futures tethered to the spot market, a funding rate is used. If traders use leverage to bid up the price of bitcoin above the price in the spot markets, the funding will turn positive, which means that long positions will periodically pay short positions a percentage of their notional position size to remain in the market.
For example, if the funding rate on a perpetual swaps contract is 0.1%, longs have to pay shorts 0.1% of their position size every eight hours. Obviously this rate is variable and subject to change as a result of market conditions, but a 0.1% funding rate annualized turns out to be 109.5% annualized rate to go long bitcoin (0.1%*3*365).
Taking a look at one extreme example from earlier this year, traders on Bybit saw the funding rate rise to an incredible 0.353% in February, meaning that long positions were paying over 300% annualized to margin long bitcoin. This large dislocation did not occur with a small amount of capital, as the open interest on the Bybit perpetual swap contract was over $2 billion at the time of the funding spike (as shown below).
Similarly, following the massive long liquidations that occurred on May 19th, the funding rate plunged to minus 0.177%, meaning that traders were getting paid to go long bitcoin at an incredible rate of 193.8%.
“Who in their right mind would pay to short bitcoin?” you might ask. The answer is that following large liquidation events, previous leveraged longs become forced sellers, and this dynamic drives the price of bitcoin on perpetual futures far below the spot market price, thus flipping funding negative. This is often the best time to buy bitcoin (or for traders, to enter long positions).
In the market today, funding has grinded lower with price, and compared to earlier in 2021 funding remains very moderate. This is an encouraging dynamic for bulls, as it shows the speculative fervor is not present to the extent it was at the local top of the market in April.
Equally important is the type of collateral present in the bitcoin derivatives market, as this dictates how the derivatives market reacts to both upwards and downwards price action.
Since the April all-time high, the collateral type present in the bitcoin derivatives market has increasingly been made up of stablecoins and less bitcoin (other cryptocurrency assets can be used to enter margin positions, but the overwhelming majority is BTC).
Aggregate open interest using bitcoin as collateral was 264,000 BTC near the local top in April, with that figure sitting just above 150,000 BTC today. In percentage terms, the market has decreased its use of bitcoin collateral from a high of 70.17% of open interest on April 17 to just 46.97% of open interest at the time of writing.
This is great news for bulls, as the use of bitcoin collateral increases downside risk, as position value declines in tandem with collateral value for long positions. The increasing prominence of stablecoins and the passing of the Bitcoin Futures ETF (which allocates capital on the cash-margined Chicago Mercantile Exchange) have played a large role in this development.
Bitcoin Mining
In previous monthly reports, we highlight the resilience of the Bitcoin network via the incredible hash rate growth, post China mining exodus. It’s easily the Bitcoin story of this year and one of the most monumental success stories in Bitcoin’s history yet.
Looking past this event, the mining hash rate is still up 22% compared to November in 2020. However, the hash rate stalled in the last week of November largely attributed to Chinese mining pools experiencing DNS “pollution,” a type of DNS attack that cuts off users’ access to the network by directing traffic elsewhere. Binance Pool, F2Pool, Poolin and ViaBTC all reported connectivity issues with subsequent drops in hash rate.
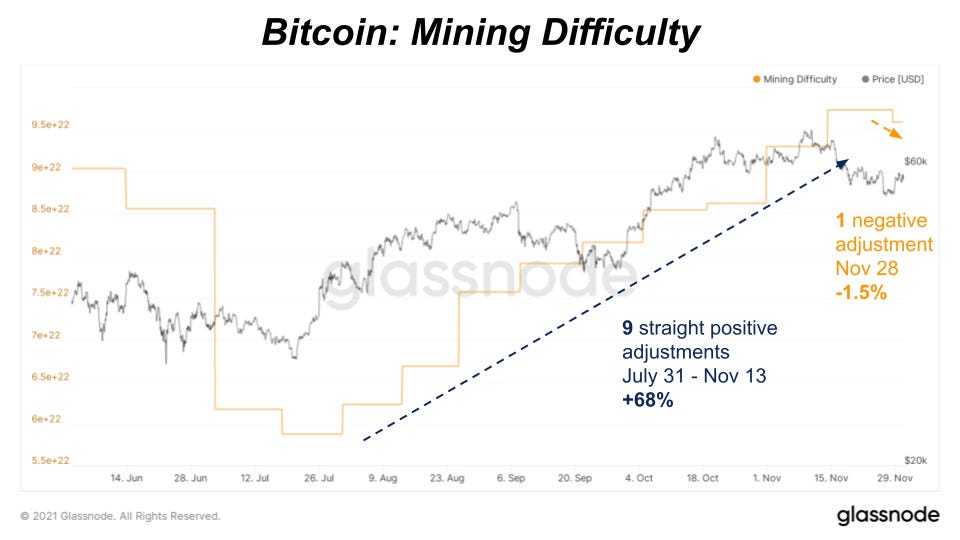
As a result, both total hash rate and difficulty have dropped over the last week, but this drop is expected to be short-lived as these mining pools’ hash rates have started to come back to normal levels. After nine straight positive difficulty adjustments where the estimated number of hashes to mine a block have increased by 68%, the latest adjustment was negative at a 1.5% decline.
Hash rate has remained static when looking at month-over-month growth from October, but new all-time highs around 180 EH/s, by the end of the year, are still in play.
Through the months of October and November, it continues to be a prosperous time for Bitcoin miners with total miner revenue largely over $50 million per day. Although below the peak daily miner revenue of $67.5 million per day we saw back in May, this trend looks more sustained with price less driven by derivatives markets.
As a result, November was the fourth-highest month of revenue over the last two years for bitcoin miners, pulling in $1.69 billion. That’s two consecutive top months of revenue for miners amid a growing trend of monthly revenue since June.
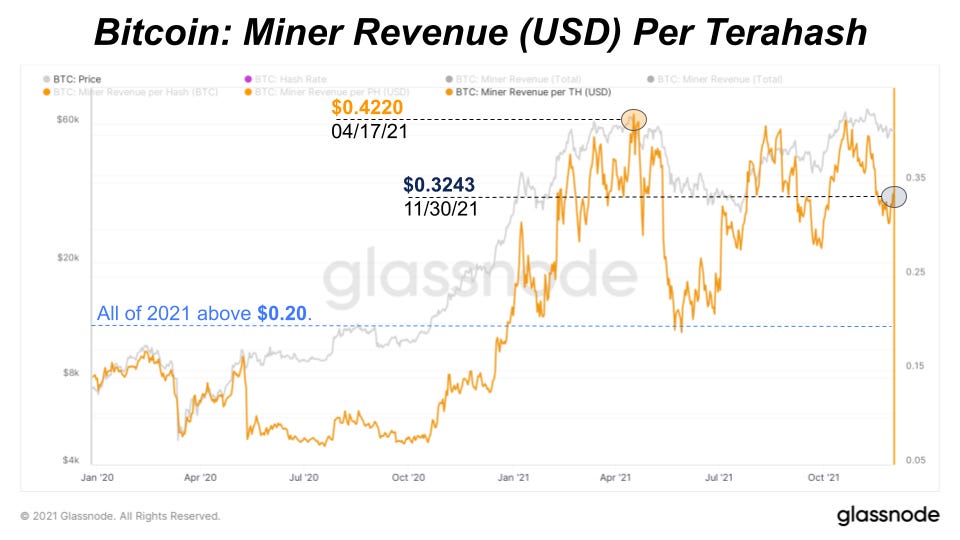
Currently, it’s one of the most profitable times to be a Bitcoin miner and that is expected to continue if price outpaces hash rate growth. Supply chain bottlenecks and chip shortages affecting the pace of ASIC miner deliveries, which affect short-term hash rate growth, still remain a high concern. Hash price, total miner revenue in USD per terahash, remains over $0.30 which is in the higher range of $/TH that miners have been making over the last three years. This has been a key development this year although hash price has been in a constant decline towards zero for all of Bitcoin’s history. The best case for miners’ profitability is to see a parabolic bitcoin move over the next few months while hash rate growth is still constrained.
Risk Factors
Although our long-term view is bullish on bitcoin as the best store of value and monetary network options that will see continued monetization and adoption, short-term there are risk factors that can affect or slow bitcoin’s growth on this path:
The most significant factor is bitcoin acting as a risk-on asset with high correlations to equities during an increased period of macroeconomic uncertainty and overextended equity valuations. Although we expect bitcoin to transition over time, acting as a more risk-off asset in the future, today it is highly subject to broader market equity moves as the market cap is only a fraction of a percentage relative to broader markets. Over the last six months, risk-on assets via stocks ($SPY) have underperformed risk-off assets via bonds ($TLT) suggesting a stronger risk-off sentiment.
The continued strengthening of the U.S. dollar is a key trend to watch as a rising $DXY comes with a rising risk-off market sentiment. A rising dollar index will negatively impact almost all asset classes, especially bitcoin. As global inflation runs hot and global fiat currencies relatively lose value, the demand for dollars increases especially in regions and industries with elevated U.S. dollar-denominated debt.
Increased macroeconomic uncertainty largely depends on the latest United States Federal Reserve policy stance, which is now leaning more towards an accelerated tapering of their balance sheet. Latest commentary suggests a possible tapering conclusion by 2021Q1 before a decision around interest rate hikes. Equity markets may continue selling off with increased probabilities of an accelerated taper and rising interest rates that would decrease market liquidity and negatively impact the cost of capital and equity valuations.
The bitcoin total futures open interest in derivatives market has risen to new elevated levels that have historically preempted increased healthy, liquidation flushes in the market. Although futures open interest is elevated largely because of increased CME Futures ETF demand, the rise is still cause for concern as perpetual funding rates rise higher as price is falling. These dynamics usually signal a derivatives market reset and thus a lower bitcoin price.










today has been wild! and it keeps on going. ₿