Released to Premium Deep Dive subscribers on 12/31/21
Become a premium subscriber to The Deep Dive to get access to all of The Deep Dive research.
Sign up with the button below to get 25% off a premium subscription.
If you have any issues viewing this report through e-mail or mobile, you can view the full report on Substack here.
PREPARED BY:
Dylan LeClair, Head of Market Research
Sam Rule, Lead Analyst
Summary:
On-Chain Analysis
Exchange Balances, Illiquid Supply
Long-Term Holder Supply, Supply 30-Day Change
On-Chain Cost Basis, UTXO Realized Price Distribution
Transaction Volume, Percent Supply in Profit
Market Valuation
Market Value To Realized Value Ratio
Reserve Risk
Derivatives
Aggregate Futures Open Interest
Annualized Rolling Basis
Perpetual Futures Open Interest, Funding Rates
Bitcoin Mining
Hash Rate
Mining Difficulty
Miner Annual Revenue, Hash Price
On-Chain Analysis
With Bitcoin’s on-chain transparency available and updated every block, it’s easy to get stuck on the latest daily or weekly view of the data. There can be insight and value in understanding these short-term moves, but it’s important to remember that on-chain analysis is best leveraged as a macro, long-term tool. That said, let’s take the longer view and look at how the on-chain data has changed since the start of 2021.
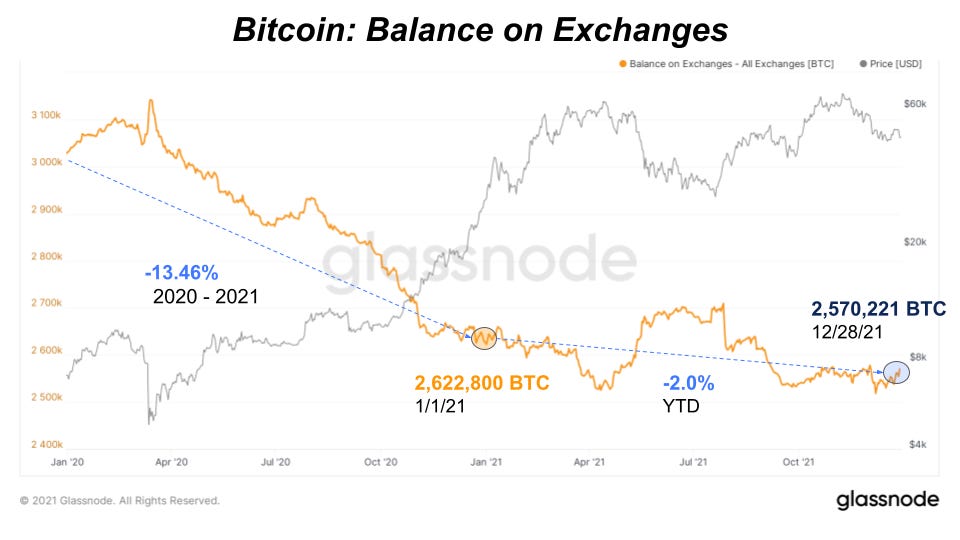
The simplest trend to start with is the bitcoin balance on exchanges which declined another 2% this year. That’s not much compared to the outlier year we saw in 2020, but it’s a continuation of a new, macro trend. July and September of this year were some of the largest exchange outflow months in bitcoin’s history.
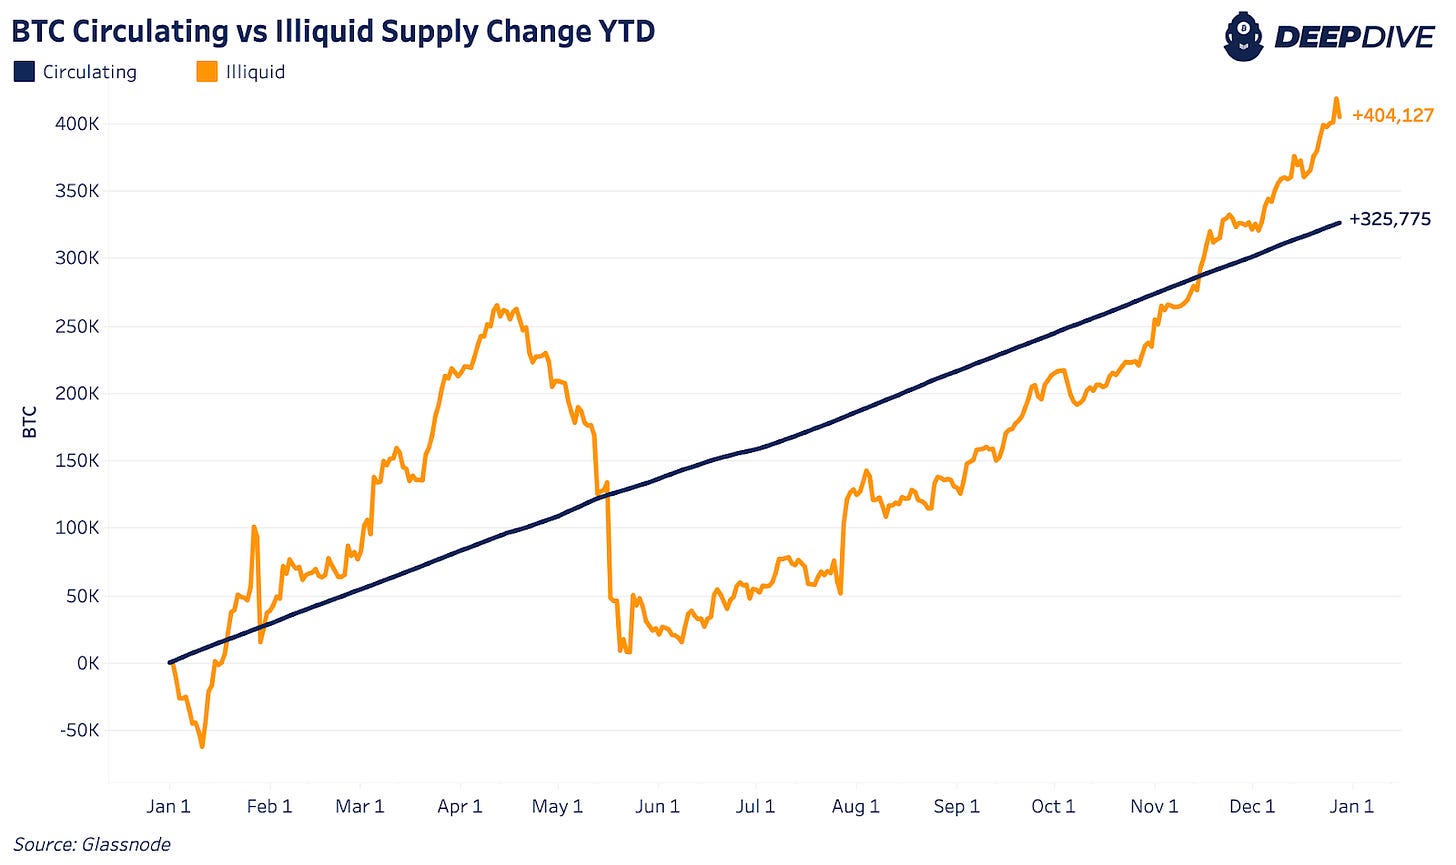
Some of that bitcoin that left exchanges made its way into illiquid supply, which grew this year by 2.89%, slowing down from 2020. Illiquid supply growth ended the year outpacing circulating supply showing that long-term investors acquired bitcoin faster than supply issuance this year.
We see that long-term bitcoin acquisition trend show up in the long-term holder supply as well which grew another 16.12%. This growth was sparked by one of the largest and fastest accumulation periods that we’ve ever seen after bitcoin’s price bottom in July.
Even with a small distribution from long-term holders over the last few months, long-term holder supply is still over 70% of circulating supply. We haven’t seen that level of long-term holder supply dominance since 2017.
After the rollercoaster of long-term holder heavy distribution and accumulation this year, the market is now in a neutral state with only a 0.1% change in supply over the last 30 days.
With their distribution and accumulation phases this year, long-term holders significantly raised their cost basis by 227.61%. A rising cost basis builds up a healthy support for bitcoin price as the long-term holder price to cost basis ratio went from a factor of 10 to 2.6 this year.
The short-term holder cost basis also increased this year rising 169.36%. Yet, after the recent price drawdown, price hasn’t reclaimed above the current short-term holder cost basis which has proven to be a key support for bull markets continuing. Excluding exchange balances, this leaves nearly 16% of all supply currently underwater, at a loss.
In total, 73.29% of all supply is in a state of profit, which is a completely different state than at the beginning of the year. July gave us a low reference point for this year reaching under 70%, but that didn’t come close to the 43.07% supply in profit percentage we saw back in March 2020.
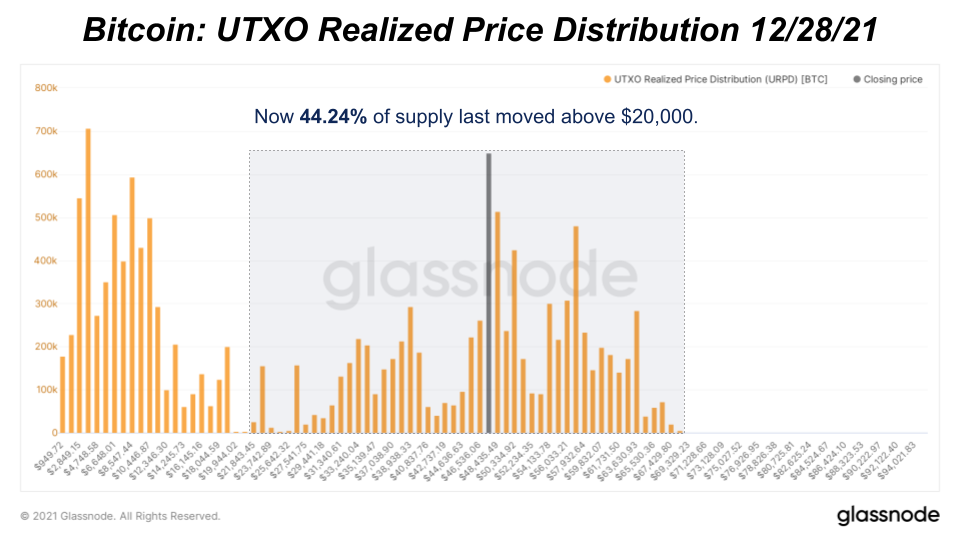
Although we look to end the year with more supply in a state of loss, the distribution of that supply is much different. At the first of the year, the price was just below $30,000 with only 12.64% of UTXOs existing above $20,000. Fast forward to today and over 44.24% now exists above $20,000. And nearly 20% of the supply was last moved above $50,000.
The change in supply distribution largely comes from new demand and price discovery driving up bitcoin’s current “fair value.” The new demand this year looks to have come from both retail and institutions. One way to view demand trends is through varying USD amounts of transaction volume. Using this metric, the majority of retail demand looks to have peaked in January through March while institutions increased throughout the year.
Market Valuation
In terms of relative market valuation, our favored metrics are the MVRV ratio and Reserve Risk.
In regards to the MVRV ratio, we see realized price as the most pure view of the monetization of bitcoin, and thus the ratio of the current price to the realized price gives us a relative market valuation. Currently at 1.94, the MVRV is nowhere near bubble top territory, but it is also not below 1.0, which historically has marked generational buying opportunities.
Next, we have Reserve Risk, which we explained in great detail in The Daily Dive #94 - Reserve Risk Overview. Reserve Risk quantifies the incentive to sell bitcoin against the cumulative opportunity cost foregone by holders. When accumulated opportunity cost is high (strong HODLing) and price (incentive to sell) is low, Reserve Risk flashes a buy.
Currently, Reserve Risk is approximately equal to the levels it was at during the summer when bitcoin briefly dipped below $30,000.
Derivatives
2021 was quite the year in the bitcoin futures market, with local bottoms and tops being set by overaggressive derivative speculators who found themselves betting against the tide of spot accumulation/distribution.
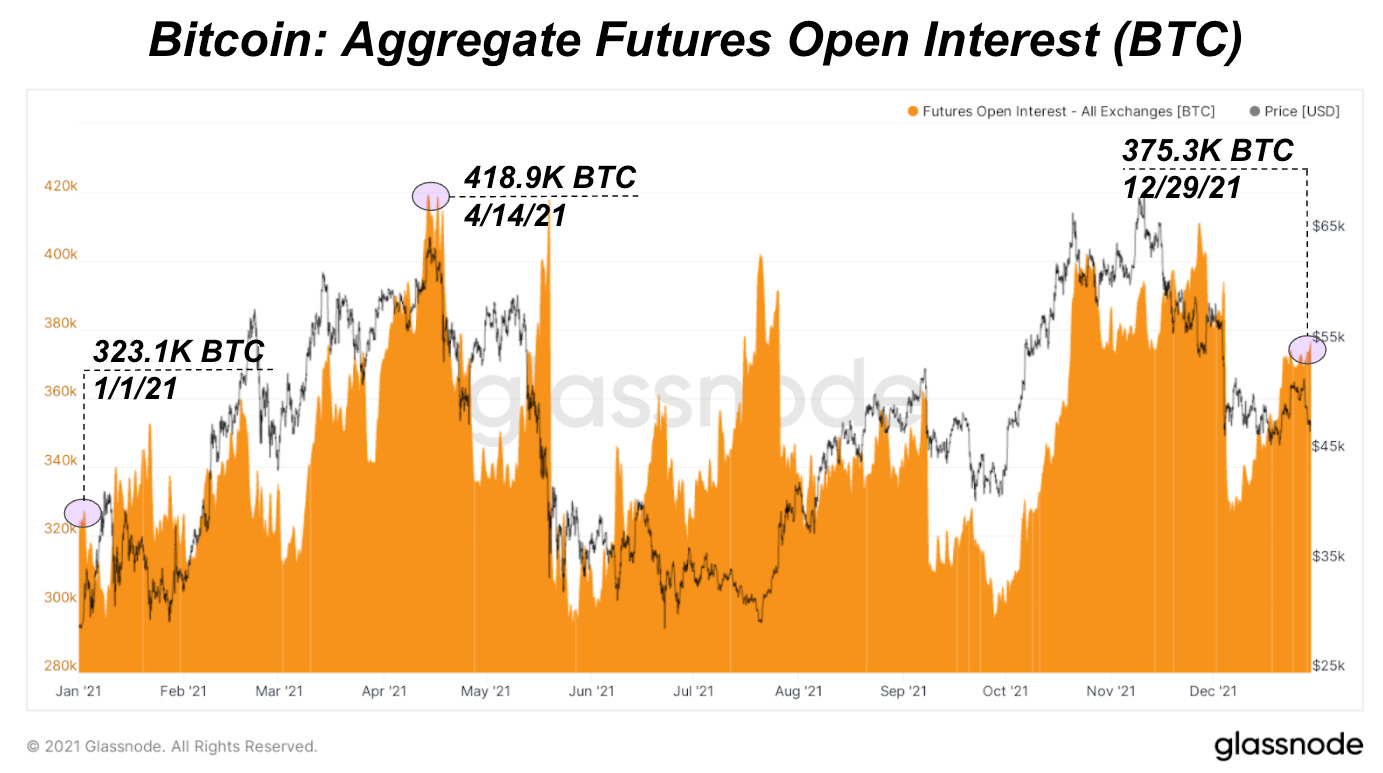
Aggregate futures open interest opened the year at $9.42 billion before rising in meteoric fashion to $27.5 billion in a little over four months, with an increasing amount of traders using their bitcoin to margin long BTC futures. Large liquidations followed (displayed clearly in BTC-denominated open interest) April into May, while bitcoin grinded down just below $30,000, as sentiment and long/short bias completely flipped.
Amidst the grind down to $30,000 in the summer, derivative traders increasingly drove down the price in the perpetual swaps market, with funding flipping negative for a sustained period of time. During this time period, the Binance BTC/USDT Perp contract grew from approximately $1 billion to $2.6 billion in open interest despite price declining over the same period, with funding going increasingly negative.
This large increase in short biased open interest led to the explosive rebound of the local bottom in July, as it highlighted the importance of understanding derivative dynamics in regards to price action for many market participants who were caught off guard.
Aggregating funding rates across exchanges over the previous two years displays the opportunistic times when funding for perpetual futures is increasingly speculative to the long and short side, and the ensuing price action.
Similar to funding rates on perpetual swaps, the futures annualized rolling basis (the spread between the spot market price and that of the forward quarterly futures contracts, annualized) blew out aggressively in April, reaching as high as 45% as euphoric sentiment was prevalent amongst bitcoin/crypto speculators.
With the liquidations that followed the April high, the basis spread collapsed, and has since oscillated from 0% (with certain contracts briefly trading in backwardation) to 15%, with the annualized basis currently at 8.83% at the time of writing.
Breaking down the makeup of the futures market, open interest on perpetual swaps contracts continued to increase total market share throughout 2021, with 65.3% of total open interest currently in perpetual swap contracts, with the remaining open interest in weekly, monthly, and quarterly expiration futures contracts.
The dominant exchanges in the perpetual swaps market are Binance, FTX, and Bybit, in that order, with Binance and FTX seeing large year-over-year growth in total market share. Over the course of 2021, Binance share of the perpetual swap market grew from 26.0% to 40.8%, FTX from 10.9% to 20.3%, and Bybit shrinking from 21.4% to 16.3%.
In terms of open interest by collateral type, the decreasing use of bitcoin/crypto margin and increasing use of stablecoin margin serves to treat long-biased speculators well, due to the convexity that comes with going long an asset with the same asset as collateral.
Since the start of 2021, bitcoin futures open interest has shifted from 61.3% to 41.26% crypto-margined.
This comes during a time of explosive growth in the stablecoin ecosystem, with aggregate stablecoin supply sitting at $145.8 billion.
Lastly, it would be unfair to ignore the massive growth of wrapped bitcoin on ethereum (WBTC) over the last year, with total WBTC going from approximately 115,000 to 258,000 over the course of 2021, up from just 589 WBTC total at the start of 2020.
WBTC allows for traders to use bitcoin as collateral on the Ethereum network, which comes with its own set of security/counterparty risk tradeoffs.
In general, the prevalence of bitcoin as collateral on crypto exchanges, other crypto asset networks, and in the legacy financial system, will continue to grow.
Bitcoin Mining
We’ve talked at length about the importance of this year for bitcoin mining. With the resilient hash rate recovery from the China ban, the increase to miner profitability and the overall rise of an industry as illustrated by the growth in public miners, 2021 is a historic year for bitcoin mining.
Bitcoin mining this year generated $16.6 billion in revenue which is larger than the last three years of revenue combined. That translates to bitcoin miners now making $45.83 million per day which is up 57.38% YTD.
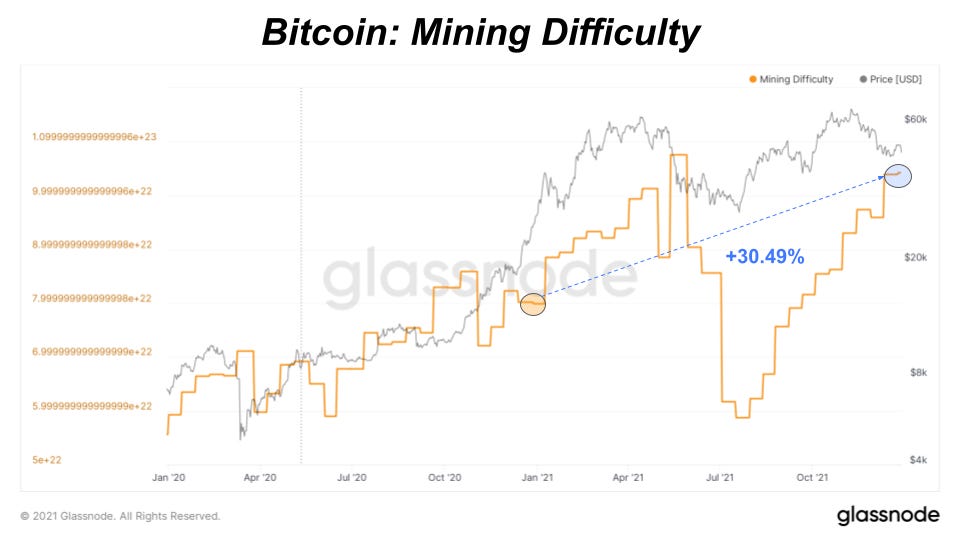
As for hash rate, the China ban has done little to phase the long-term trend as hash rate grew another 21.82% this year. Hash rate even peaked at an all-time high of 182.02 EH/s earlier this month before responding to a difficulty adjustment increase. Mining difficulty ended up rising 30.49% this year and is now just shy of the all-time high back in May.
Although cooled-off from its highs, the surprise this year has been a rise and sustained hash price over $0.20. As the new hash rate coming online can’t keep up with price increases, each existing hash produces more USD revenue for current miners. With marginal costs that largely remain the same or even lower overtime, profitability is at three-year highs.
As a result, we’ve seen a rush to secure as much additional hash rate as possible in a gold rush like fashion. Almost each additional month and quarter this year came with a new announcement from top public bitcoin miners to expand their hash rate while holding more bitcoin.
Final Note
In 2021, bitcoin adoption hit an inflection point with a nation adopting the currency as legal tender and an increasing number of institutions getting involved that previously remained skeptical on the sidelines. Bitcoin also faced its toughest stress test since the 2017 fork wars with the China mining ban, and the network seemingly didn't miss a beat. The resiliency displayed in light of a world dominant superpower banning mining operations within its borders, where over 50% of the hash rate was estimated to have resided, should not be understated.
Bitcoin is the world's strongest, most secure, liquid, digital asset, and its proliferation around the global financial landscape, both in developed and developing nations, will only continue in the coming years.











Happy New year; Awesome year end summary -- excited for '22; lfg 🤘🤘
can you even imagine what it'll do in 2022? fuck. i can't wait.