The Deep Dive #022 - A Deeper Look Into On-Chain Accumulation
In today’s edition of the Daily Dive we will take a fresh look at the accumulation taking place using on-chain metrics and data.
In last Friday’s Daily Dive, we examined the capital inflows that had seemingly come to a halt on the Bitcoin network, using realized market capitalization.
The history of the realized price/capitalization metric in particular is one that we decided should be covered in further detail. In hindsight, throughout the history of the Bitcoin network, the realized price has presented a fantastic signal as to the phase of the bitcoin market cycle.
While market price is set at the margin, realized price can serve “fair value” of the market price of bitcoin, valuing each UTXO at the price quoted when it was last moved. In a very broad sense, over extended periods of time, when:
Realized price is increasing, bitcoin is in a bull market
Realized price is plateauing, bitcoin is in an accumulation phase (preceding a bull market)
Realized price is decreasing, bitcoin is in a bear market
The chart below displays this dynamic.
As you can see, realized price has been drawing down since the month of May, albeit slowly, but this historically has marked the start of a prolonged bear market. Is it premature to use a two month view of realized price to call a bear market? Most likely so, but it still is a notable trend.
Here is a closer look at the recent downtrend in realized price.
Is bitcoin in a bear market? Truth be told, it is impossible to know, but the decrease in realized price from a peak of $20,197 on May 12, 2021, to $19,329 today historically would be how the start of a bear market would look like.
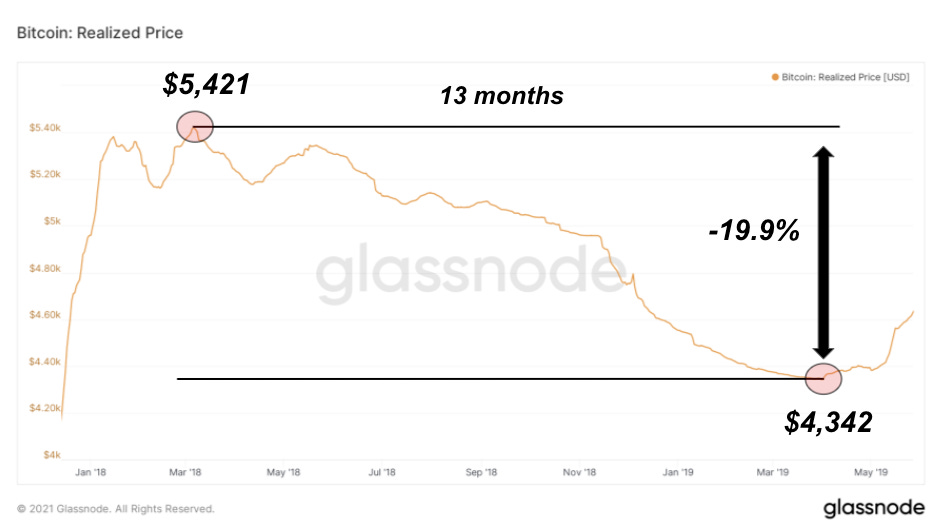
It can be helpful to gain perspective from a previous cycle to see how realized price moved. From peak to trough, realized price drew down 19.9% from the all-time high during the 2018 bear market, making a low 13 months following the peak.
It is very possible that realized price could follow a pattern similar to the 2013 cycle, where realized price briefly started a downward trend before recovering with the start of the second act of the infamous “double bubble.” In our opinion, this is the most probable case, rather than a multi-year bear market followed by re-accumulation.
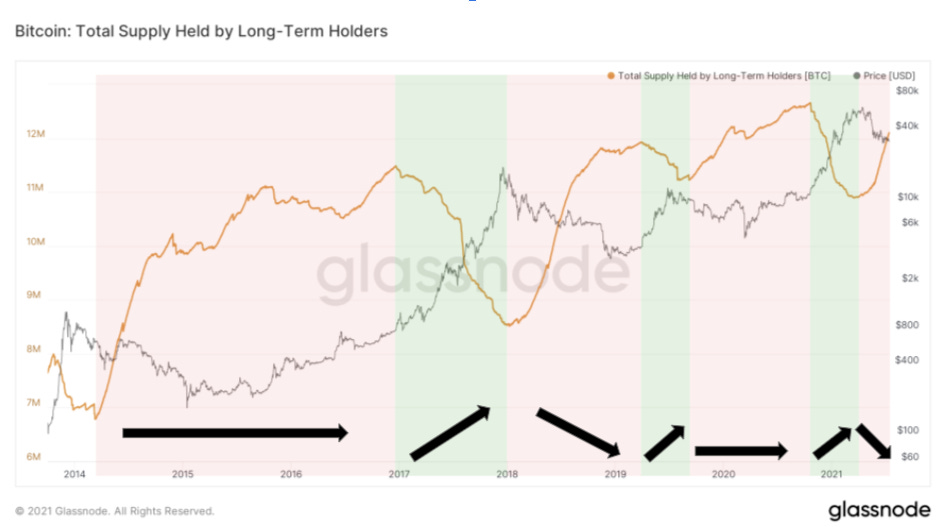
Another interesting metric to take a look at is the pattern of long-term holders, who increase holdings into market downturns and conversely sell into bull markets. As shown by the total supply held by long-term holders below, during green zones (bull markets), holders decrease overall holdings, while accumulating during consolidation/bear market phases.
This is a lagging indicator rather than a forward market indicator, meaning holders respond to market price to choose how to act rather than signaling what will happen next, but nevertheless, it is an interesting development to see such a feverous accumulation by longer term holders over the past two months.
Last, but not least, is bitcoin liveliness. This was a metric covered in our June Monthly Report, but it is relevant to the topic at hand today, and the trend has increased since the report was released.
Liveliness is a ratio that measures on-chain investor activity. In theory, if all bitcoin in circulating supply moved to the next block (not possible), liveliness would temporarily jump to 1.0. Thus, when liveliness is in a sustained downtrend, it means that coins are being accumulated and hodled at a greater pace.
This was the dominant trend during the earlier months of 2020, and the return of this trend is extremely promising for the return of a bull trend in the later months of 2021 and into 2022.


