The Daily Dive - Inflation, Credit And Volatility
Producer Price Index Hits 10%
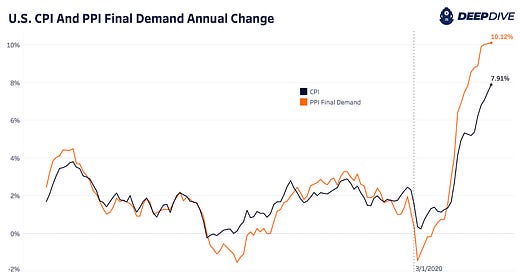
The latest United States producer price index (PPI) figures were released this morning showing a 10% annual index change. The PPI tracks price changes received for goods and services across domestic producers and will be an important key input in the Federal Reserve Board’s decision to tighten monetary policy tomorrow in the face of surging inflation.
The United States PPI growth is still well below what we’ve seen across the European Union and will likely continue higher in the coming months as producer input costs lag the rise in commodities and energy prices. Below we see a clear trend of acceleration in Consumer Price Index and PPI post the COVID-19 response, which came armed with unprecedented fiscal and monetary stimulus.
Services which make up 64.96% of the index rose 7.8% while goods, making up 33.28%, rose 14.4%. This was the largest ever monthly spread between goods and services PPI. With gasoline at a 60.6% annual change and 14.8% month over month, The BLS report noted that,
“Nearly 40% of the February increase in prices for final demand goods can be attributed to the index for gasoline.”
Although Brent crude oil has come back down to below $100 a barrel from its approximately $130 barrel local high, it’s still up 281% from the March 2020 monthly low. Oil prices look far from stabilizing while new developments are taking shape with Russia looking to increase strategic, energy and economic ties with China, India, Saudi Arabia and the United Arab Emirates.
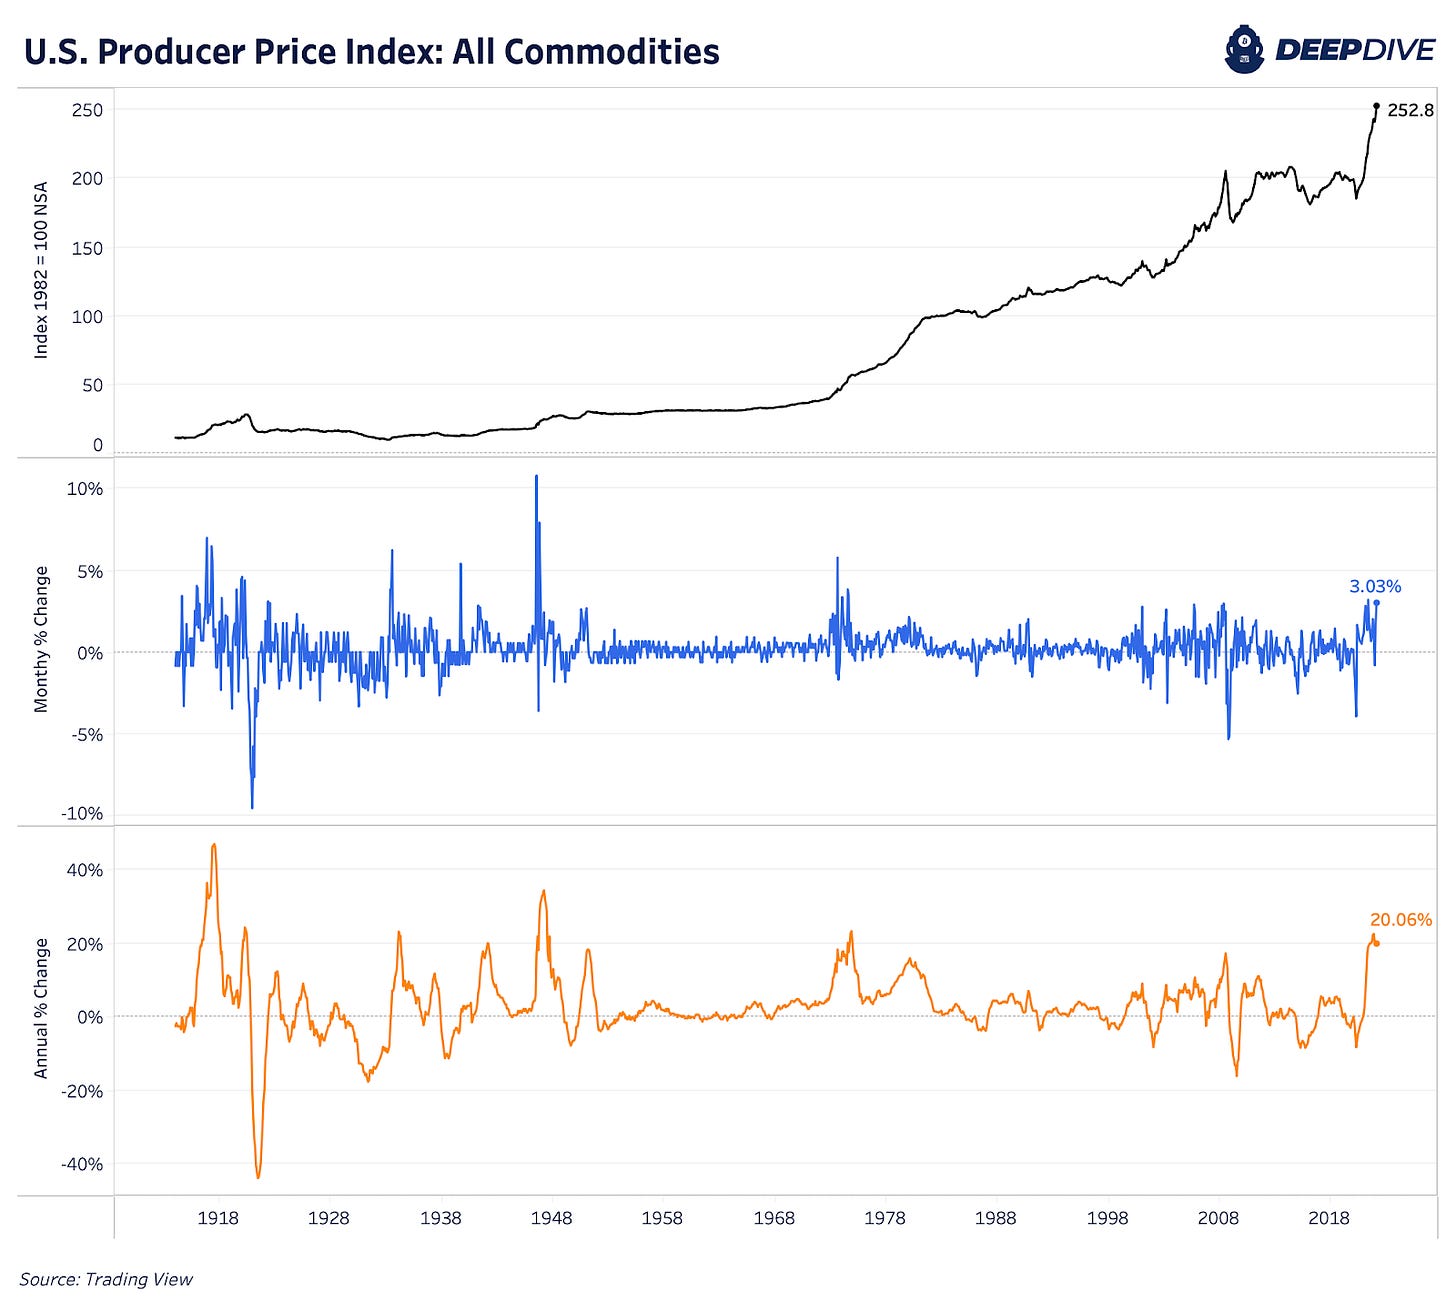
The PPI annual change for commodities remained over 20% for the month of February while the month-over-month acceleration was one of the highest values we’ve seen since 1973. We expect the majority of commodities’ price increases to show up in next month’s data.
Total manufacturing industries tell a similar story with annual change at 16.61%, just shy of the November 2021 all-time highs (series doesn’t have 1970s data). Month-over-month growth was the highest it has ever been at 2.47%.
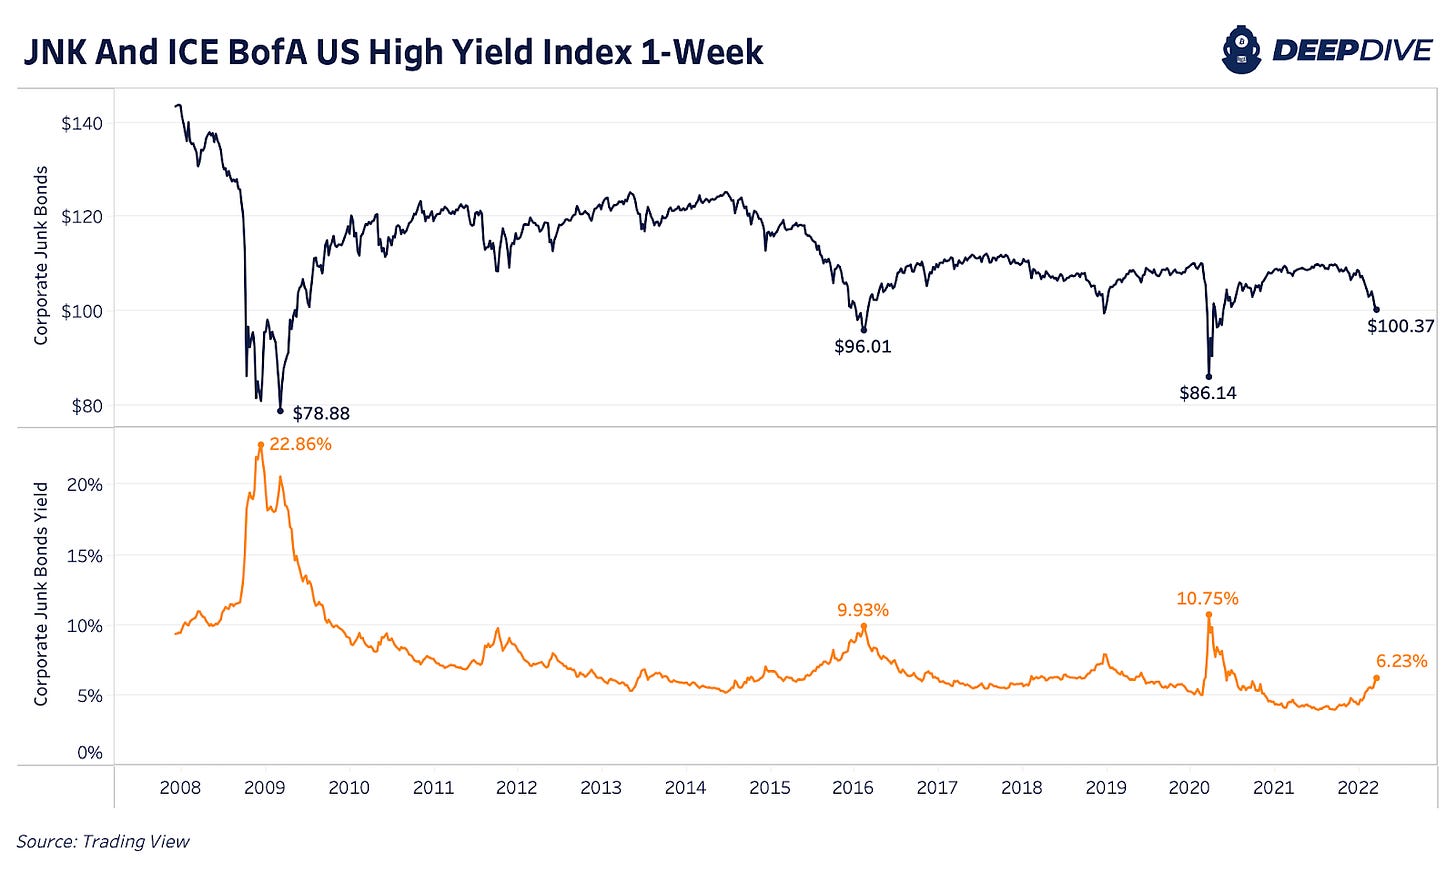
Corporate credit continues to deteriorate as JNK, an index of corporate junk bonds, rolls over. As these high-yield bonds sell off, the yields have risen to over 6%. As corporate credit and financing costs continue to become more expensive, the risk of a major, macro credit unwinding rises.
Volatility in the system remains elevated with the VIX over 31. The initial volatility spikes back in Q4 2021 coincided with the market sell-off in bitcoin and the S&P 500 Index. Based on its historic moves and relationship to the VIX, it’s hard to imagine bitcoin making a larger upwards move with overall equity market volatility so high in the short term. We would have to see a major, fundamental shift (decoupling) or catalyst in the market to change our view.
Our base case is that we are due for another explosive volatility shock and that the VIX has not made its yearly high yet. We also view the likelihood of a recession in the U.S. as a near certainty over the coming four quarters, as real growth likely reverses in the face of soaring energy prices and rising yields.
For bitcoin bulls, the encouraging sign is that under the surface, accumulation is occurring, with free-float supply continuing to decrease, as quantified by a variety of on-chain metrics.
However, due to the accelerating readings of inflation across the global economic sector, credit markets are selling off, and thus broader market liquidity is decreasing as volatility continues to elevate.
In our view, the market will have its pain point tested in the form of higher yields during 2022, and it is not a matter of if but rather when the Fed decides to intervene to quell credit market conditions.
Tomorrow’s release will dive further into on-chain market dynamics, as we show exactly why when the macro tides change, bitcoin is likely destined to outperform most if not all asset classes.


