The Daily Dive - Consumer Price Index 40-Year High
U.S. Inflation Hits 7.91%
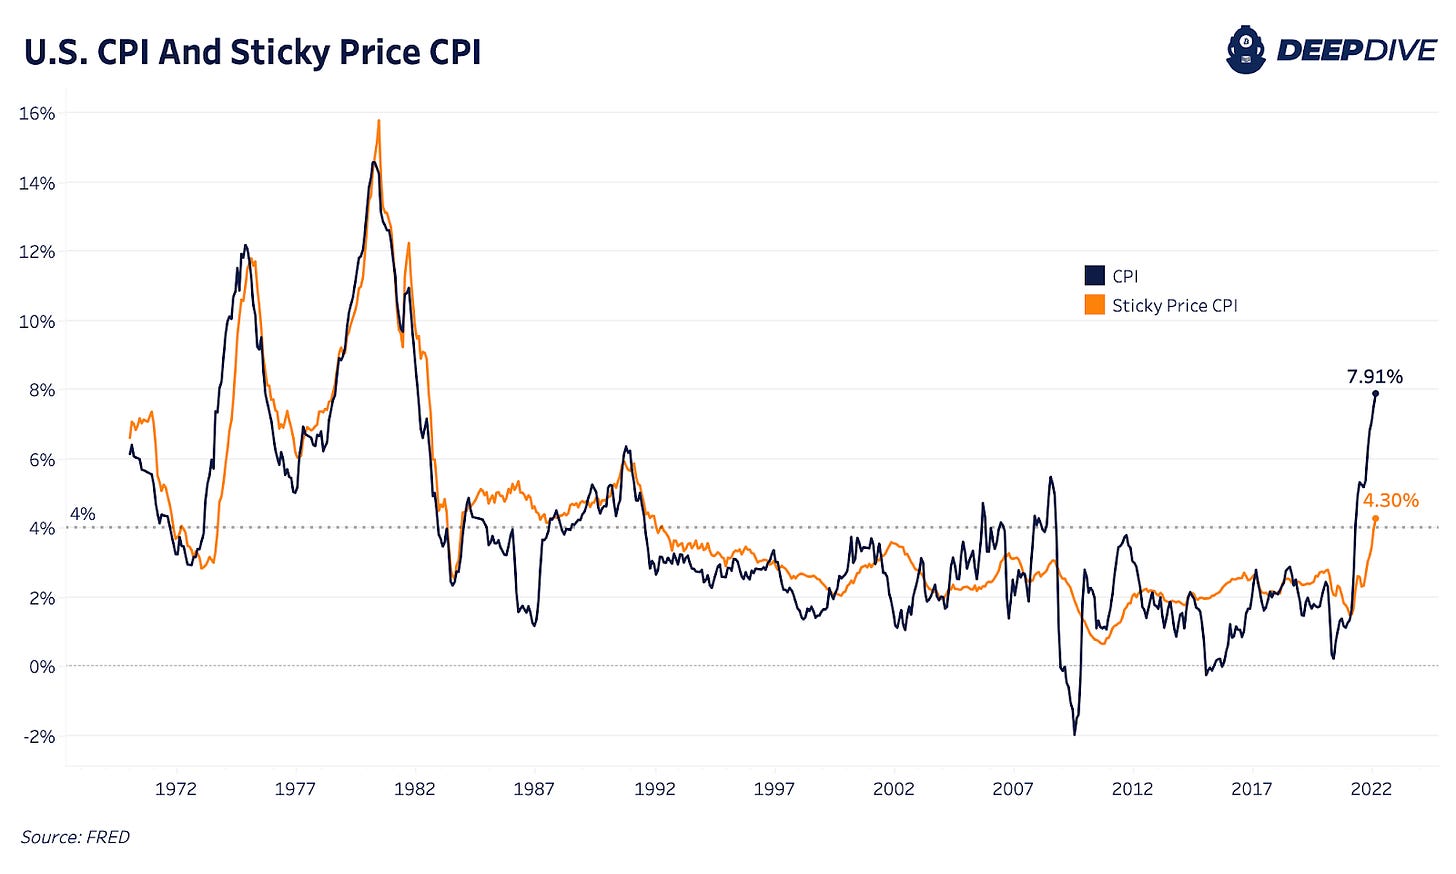
Today, we saw yet another acceleration in the United States Consumer Price Index for the month of February with data coming in line with consensus expectations at 7.91%. Previously, we expected inflation to potentially peak in Q1 while remaining elevated for the rest of the year but that scenario is looking less and less likely as the surge in commodities and energy prices are now taking over.
Even if it has little material impact on bringing prices down, the Federal Reserve and other central banks are in a position where they are now forced to try and aggressively tighten monetary policy to maintain any integrity or illusion of their price stability goals.
As a result, today the European Central Bank (ECB) revised their 2022 inflation forecast to 5.1%, up from 3.2%, while announcing tighter monetary policy across a faster wind-down of their quantitative easing purchases. The central bank also revised its 2022 GDP growth forecast down to 3.7% from 4.2%. They highlighted two downside scenarios with GDP growth hitting 2.3% for the year in their severe case. Even the severe case outlined is still well above the pre-Covid GDP growth 5-year trend, suggesting growth forecasts are still too high.
As the narrative of transitory inflation has faded, the Fed has been looking for signs of “sticker” or more entrenched inflation before taking hawkish action. The Atlanta Fed’s Sticky Price CPI measurement, covering a weighted basket of items that change price relatively slowly, continues to accelerate along with CPI, signaling that this inflation is not temporary.
We’re also likely to see higher energy and food inflation in the March CPI release as the second-order effects of rising commodities and the Russian-Ukrainian conflict start to take shape. Energy is already 25.68% more expensive than last year with food and energy together making up nearly 21% of the CPI weighting.
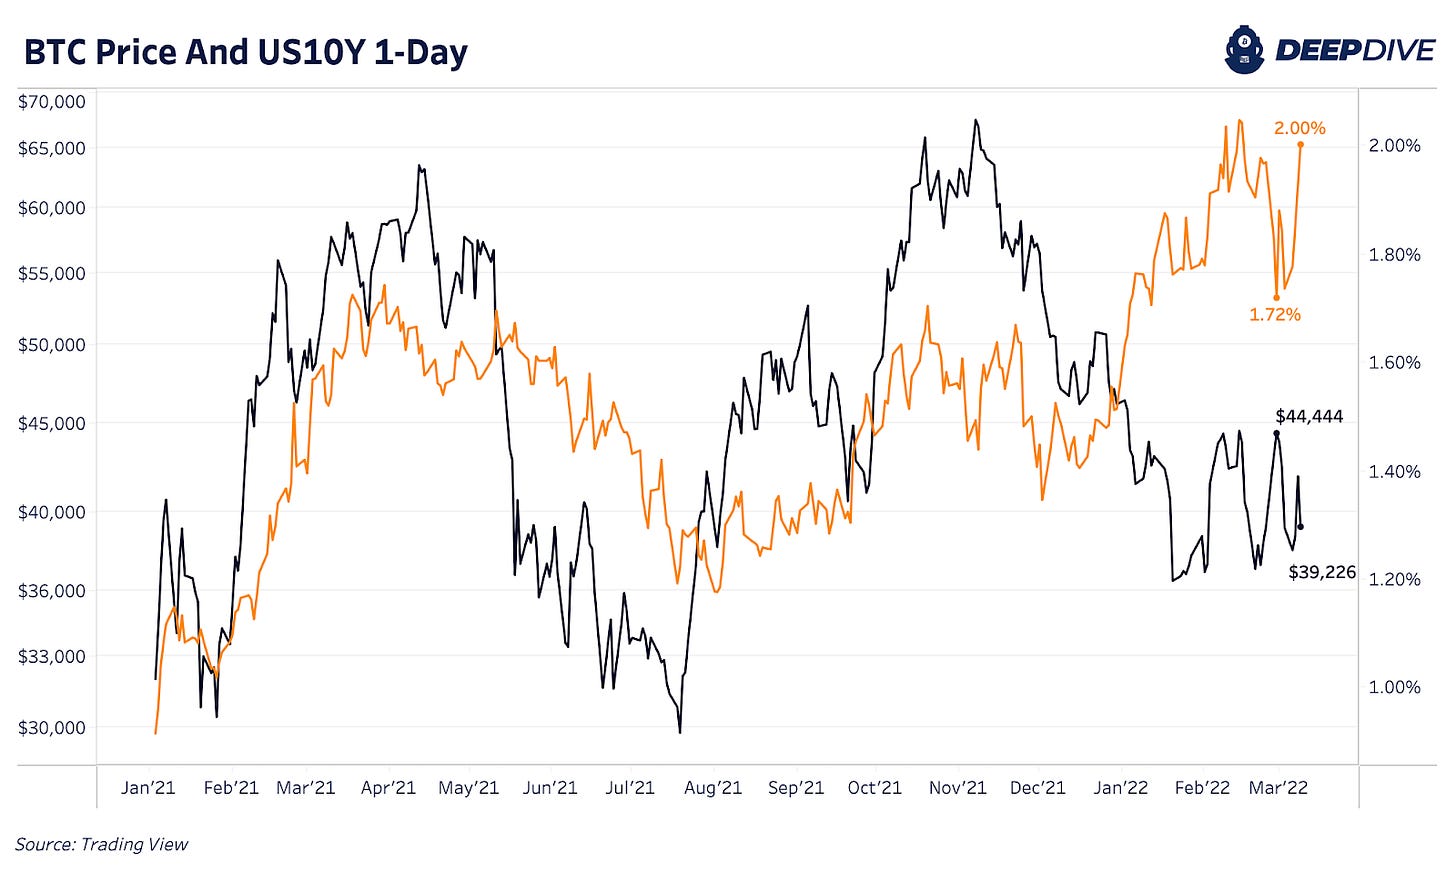
In a brief period where U.S. treasury yields spiked to the downside, yields across all durations are back to their increasing trend since November 2021. Since its recent low of 1.72% at the end of February, the 10-year treasury yield is now back at 2%.
Since December, a rise in the 10-year yields with credit getting more expensive has coincided with a fall in bitcoin’s price.
So what does this all mean for the big picture?
Credit markets are beginning to realize that inflation is here to stay, in a big way, as is the trend of rising yields since Q4 2021. As credit instruments sell off, interest rates in a historically over-indebted economic system rise, leading to a lower net present value for financial assets, and higher interest burdens on consumer, corporate and sovereign balance sheets.


Our base case for the short/intermediate term is increasingly tight financial conditions and an unwind in leverage (in legacy markets, as bitcoin derivatives have already de-risked substantially).


In our view, this regime ends with a liquidity crisis in legacy markets, which likely has a net negative impact on the bitcoin price, followed by a pivot in central bank policy back towards quantitative easing and ultimately yield curve control.

Short/medium term liquidity risks aside, the end game is unchanged. The case for a non-sovereign absolutely scarce digital monetary asset has never been stronger.


