The Daily Dive #150 - Difficulty ATH And Bullish STH LTH Ratio
Difficulty Adjustment All-Time High
Once again, bitcoin’s hash rate is on the move with significantly more hash power coming online over the last few days. Hash rate is now up 24.56% year-to-date and 11.59% over the last 30 days.
Using the YTD growth as a rough two-month growth rate annualized, the network’s hash rate would reach approximately 300 EH/s by the end of the year if this pace continues. Until we see a slowdown or forecast revisions in public miner expansion, we see that as a reasonable end-of-year possibility.
With rising hash rate also comes rising difficulty adjustment. The below chart shows the estimated number of hashes required to mine a block along with the percentage change in difficulty. Currently, it’s estimated to take 1.14e+23 hashes to mine a block. Written out, that's 114,634,933,222,468,000,000,000.00000.
Not shown below is the latest difficulty adjustment coming through today at 4.78% in response to this rising hash rate. After taking 238 days to reach a new difficulty all-time high on January 21, we’ve continued to see upward difficulty adjustments as the network continues its 2022 expansion. The last downward difficulty adjustment was 1.49% back in November 2021, after seeing bitcoin’s largest downward difficulty adjustment of 27.94% in July 2021.
STH LTH Ratio
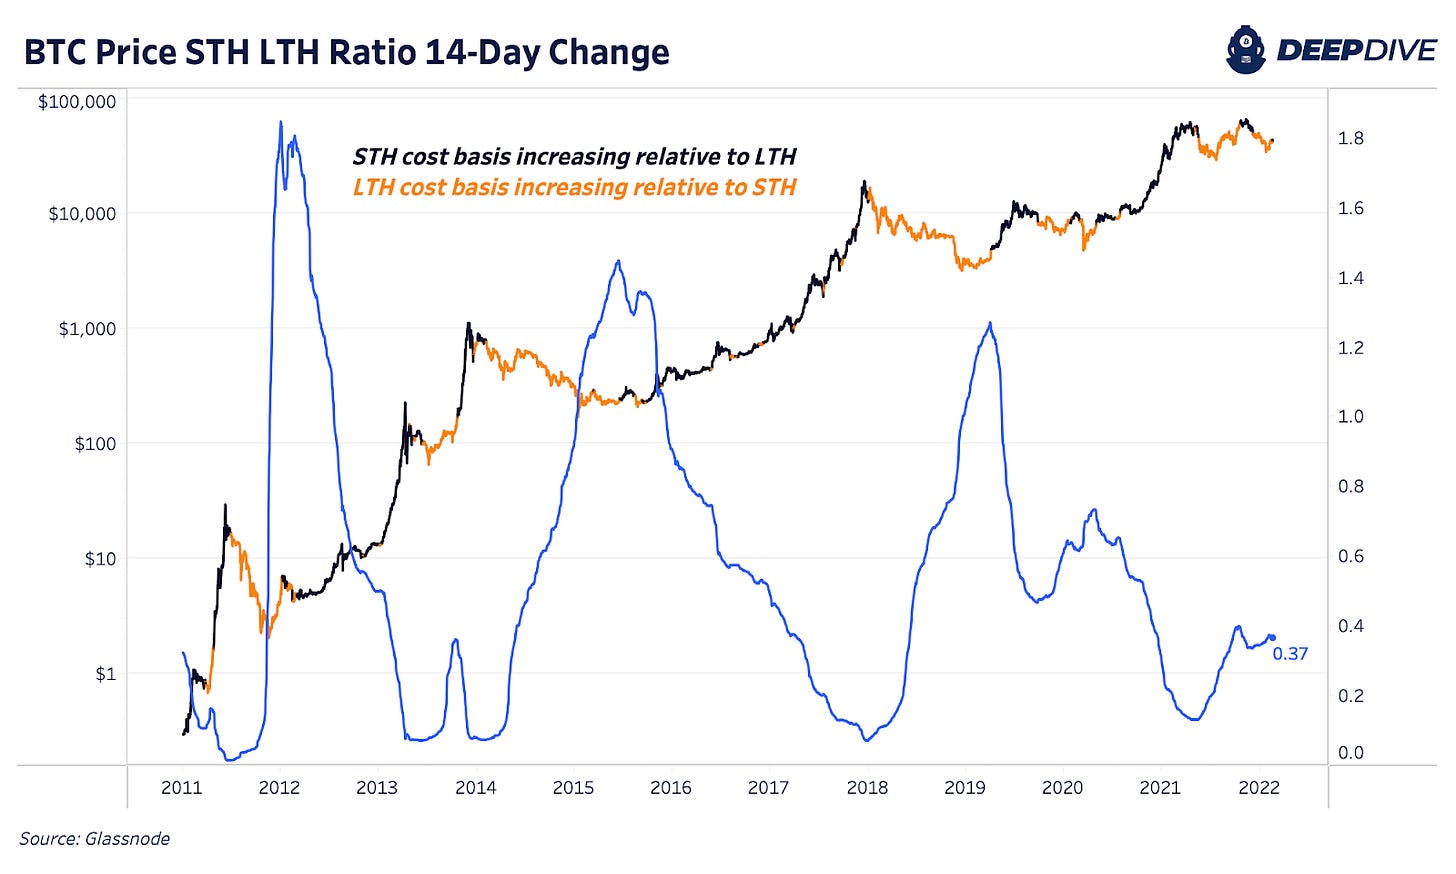
One of our favorite on-chain indicators recently flipped bullish. The STH (short-term holder) LTH (long-term holder) cost basis ratio recently has started to trend downward over the last two weeks, indicating a shift in market conditions.
The metric is first explained in detail in The Daily Dive #070.
Historically the metric has been one of the most accurate market indicators in Bitcoin, as the relationships between short-term and long-term holders and the acceleration/deceleration of cost basis of the two respective cohorts is quite informative.
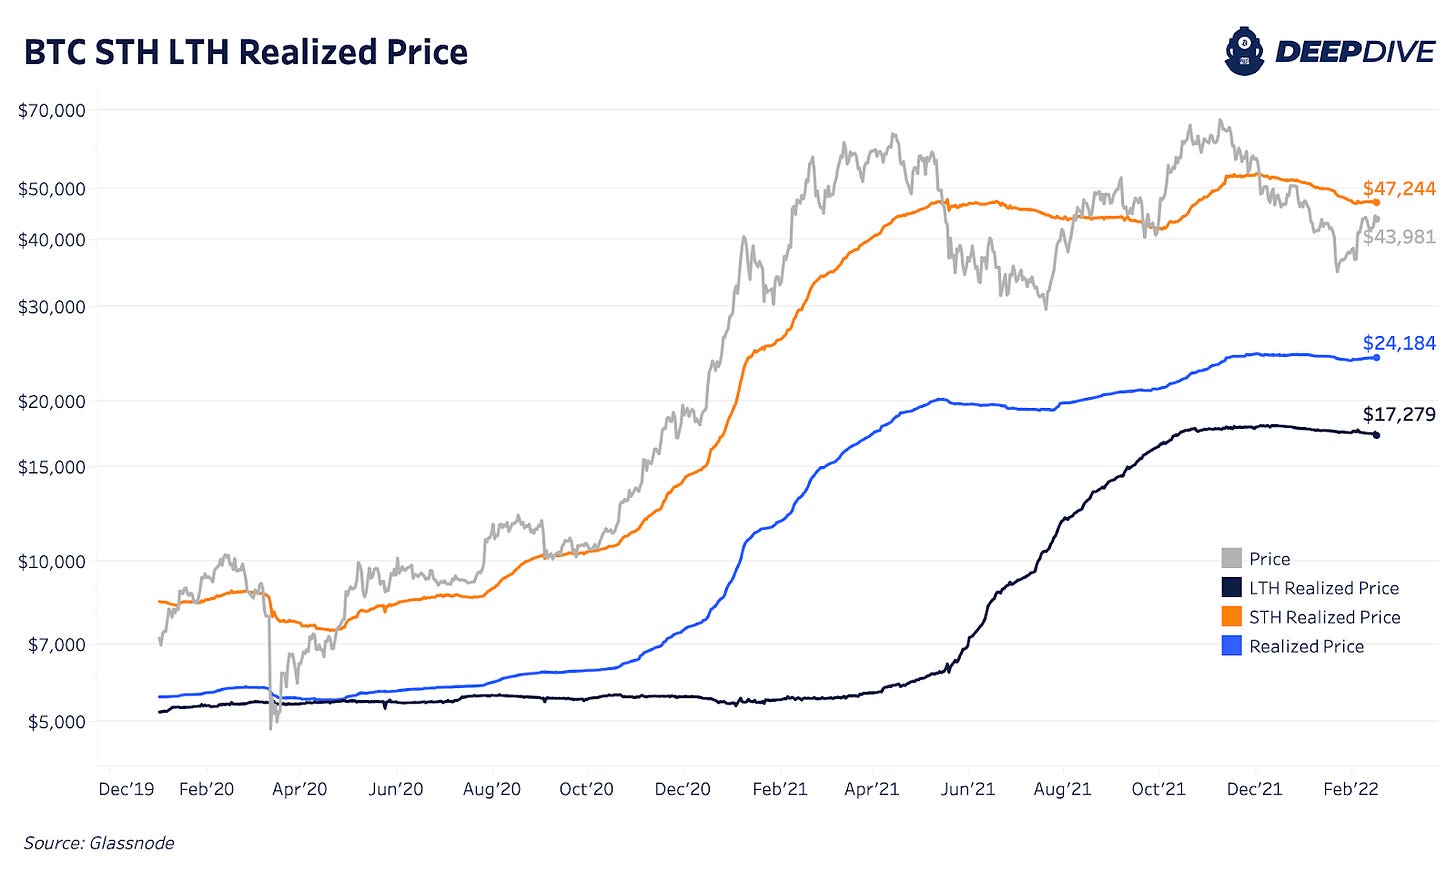
While it is true that short-term holders are still underwater in aggregate (relative to the average cost basis of the cohort) the market absorbed lots of realized losses during the last few months, and with a relative accumulation occurring, the STH LTH Ratio has flipped back bullish.
A backtest of the ratio over time speaks for itself:
Below is a view of the inputs that go into the ratio itself:
Similarly, last Wednesday in The Daily Dive #144 we highlighted the bullish flip in the delta gradient, another market momentum metric.
Another interesting momentum indicator in the bitcoin market is the weekly Heikin Ashi candlestick chart, which factors in price range to visualize market momentum. Below shows the chart since the beginning of 2020:
It should be remembered that while multiple on-chain metrics and momentum indicators are flipping bullish (from a risk/reward perspective), the macroeconomic environment and the global liquidity tides remain the biggest headwinds for the bitcoin market today. With deteriorating credit market performance and weak momentum across equity market indices, a traditional parabolic bitcoin bull market is unlikely (yet not impossible) for the time being.


