The Daily Dive #146 - Consumer Price Index And Realized HODL Ratio
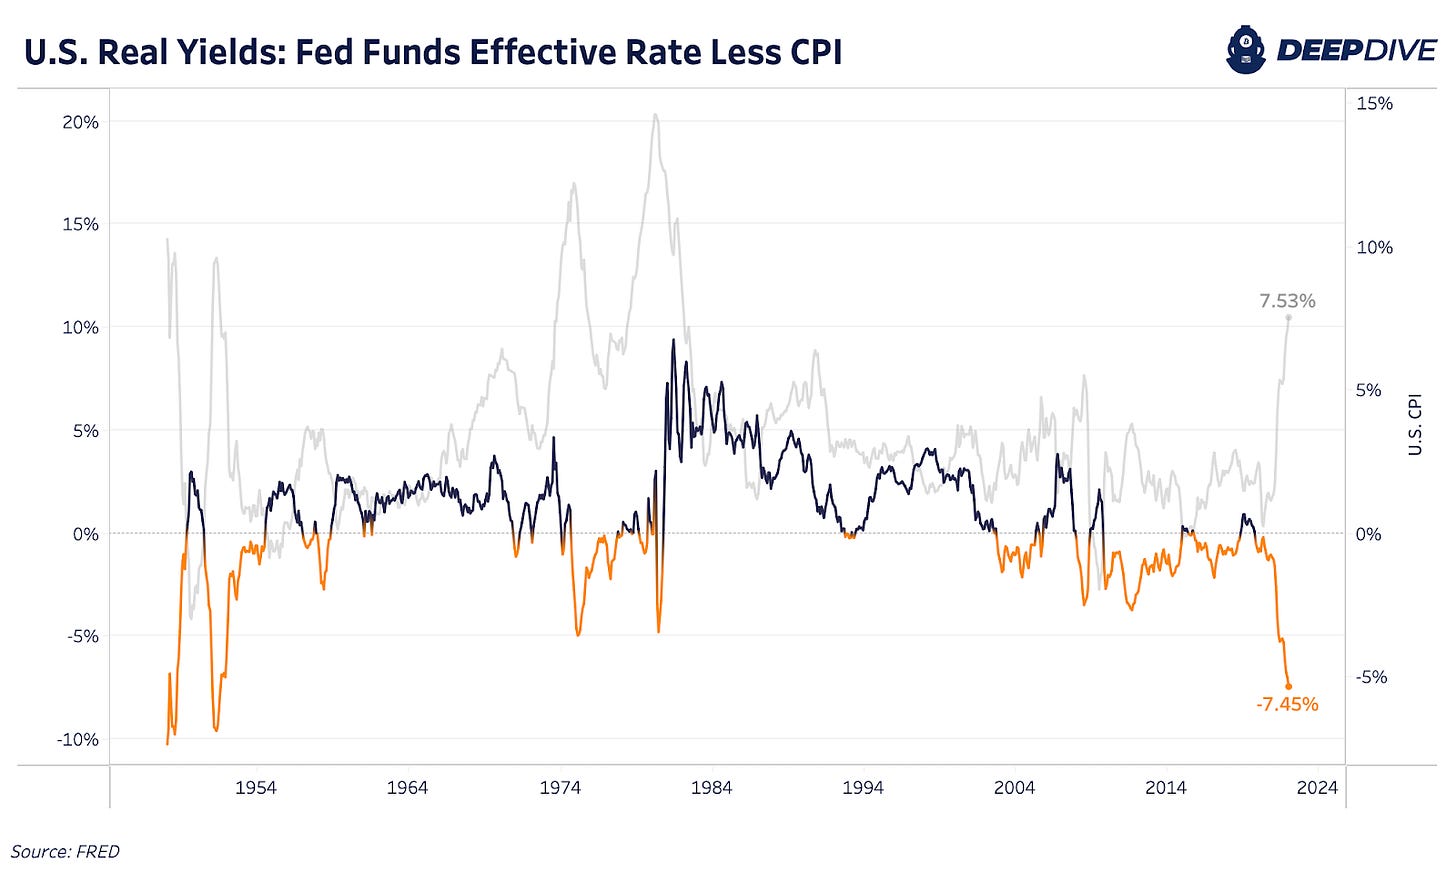
7.5% Consumer Price Index Print
Year-over-year consumer price inflation came in above expectations today, causing volatility across a wide array of assets and asset classes this morning.
Equities, credit markets, and bitcoin all immediately sold off on the move, as the market’s expectation for future Federal Reserve rate hikes soared, finishing the day with a 92.8% implied probability of two full rate hikes by the Fed in March.

This comes at a time when the Fed is as behind the curve on the inflation half of its dual mandate ever. The Fed’s dual mandate has been in effect since 1977, with the goal to "promote effectively the goals of maximum employment, stable prices, and moderate long-term interest rates."
With employment numbers having recovered notably since the depths of the “emergency pandemic” levels, the Fed must act on its mandate and begin to roll back its easing.
The most interesting thing to watch for will be bitcoin’s performance relative to legacy asset classes as this attempted monetary tightening started, as the dichotomy of thinking in regards to bitcoin’s role as an asset class has never been clearer.

The macro sellers that drove the price of bitcoin from $69,000 to $33,000, with few relief bounces, have already used most of their ammo.

Systematic financial repression is baked into the cake at this point in the economic system, and from there it is a question of “What should you own?”
An increasing amount of people are choosing absolutely scarce bitcoin, it’s that simple.
For context, 75% of circulating supply was last moved below the price bitcoin is currently trading at, similar figures as during the summers of 2020 and 2021.
Realized HODL Ratio Turns Down
A key on-chain metric that we’ve discussed before, and that we will cover today, is the Realized HODL (RHODL) Ratio. The ratio uses realized cap HODL waves, which takes the original HODL Wave metric and weights the UTXOs in each age band by their realized price. Specifically the Realized HODL Ratio uses the one-week and the one-to-two-years Realized Cap HODL Age bands.
For a more in-depth overview of this metric, check out The Daily Dive: HODL Waves And Realized HODL Ratio.
By using this metric, we can better understand what’s happening with younger coins versus older coins. As younger coins become more dominant and the ratio rises, long-term holders hold less of the realized market value. As the ratio falls, long-term holders hold more market-realized value compared to younger coins. An overheated market would show much higher younger coin dominance.
In the previous bitcoin tops in 2021, we didn’t see the rise of younger coins relative to older coins like previous cycles. We saw the RHODL Ratio rise throughout the year, but it never became heated or overheated like the 2016 cycle. This can be due to a changing cycle, a more maturing market or the fact that we didn’t see the significant wave of new demand, younger coin buying, seen in past cycles.
Over the last month, we’ve seen a significant increase in the HODL Waves and Realized Cap HODL Waves one-to-two-years age bands. More coins are aging into this band and are taking up more economic weight in the RHODL Ratio calculation as more long-term held supply comes into the market. As a result, the RHODL Ratio is right around its 50th percentile inbetween a neutral and cooled state.
Historically, we’ve seen the one-to-two-years age band peak around 50% of supply, while it’s currently at 12.93%. We look to be headed into a trend of increased holder accumulation post a local bitcoin price top. As accumulation continues and older coins age in, the RHODL Ratio falls and makes bitcoin a more attractive historical buy.


Nice write up; at certain times in the price action i see hints of bitcoin trading as the risk off asset that it actually is...this is likely my confirmation bias; or could be that folks are slowly realizing that selling the hardest money ever made because youre scared of inflation is very dumb