On-Chain Cost Basis
In recent weeks, much of our analysis has been focused on the consolidation period currently occurring in the bitcoin market, with a particular focus on realized price as an indicator of lackluster capital flow. As shown by the chart below, the realized market capitalization of bitcoin, which can otherwise be thought of as an aggregate price paid for every coin on the network, has increased by $87 billion dollars since the beginning of August.
While significant in absolute terms, given the realized market capitalization of bitcoin was a mere $90 billion at its peak following the 2017 bull market, in relative terms realized cap has not meaningfully increased since early fall of 2021.
A look at the 30 day rate of change of realized price gives additional context to this dynamic.
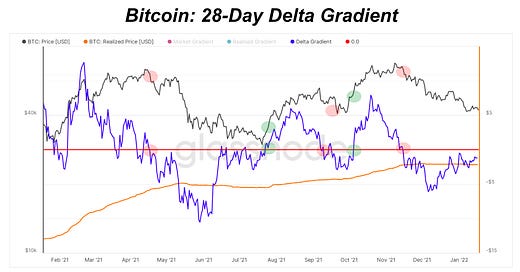
To dig deeper into the dynamic of price and realized price, we can examine the Delta Gradient indicator. The metric gauges market momentum relative to capital inflows.
As per Glassnode,
“The momentum of a market can be considered by assessing the rate of change of price, or the verticality over some period. The simplest example is a parabolic advance, whereby the rate of price appreciation increases in magnitude as a result of market momentum.
The Realized Price reflects the aggregate price at which each coin in the supply last moved. Steeper increases in the Realized Price indicates a true and organic capital inflow is occurring, as every coin that is spent on-chain and sold, has a buyer with fresh capital. The steepness of this curve therefore represents a rational baseline for sustainable value growth.
The Delta Gradient is calculated as the difference between the gradient of the spot Price, and the gradient of the Realized Price. This metric therefore measures the relative change in momentum between speculative value, and true organic capital inflows.
Statistical normalization is then applied to bring historical values, and log-scale price changes into a consistent scale.”
In our case, we are evaluating the 28-day Delta Gradient:
When the Delta Gradient is positive, it indicates an expected uptrend is in play which can be expected to last a similar length of time to the period of the oscillator considered (i.e. 28-day Delta Gradient, suggests a 1-2month uptrend is in play)
When the Delta Gradient is negative, it signals the converse, that a downtrend is in play with similar expected duration.
Increasing successive peaks in the Delta Gradient indicates that each rally has reached greater verticality, and suggests momentum continuation to the upside (e.g. see 2016-17 bull). Vice-versa is applicable for corrections and downtrends.
Decreasing successive peaks in the Delta Gradient, particularly when price is making corresponding higher highs, indicates declining momentum with each rally. This can be interpreted as a bearish divergence and a potential trend reversal signal (e.g. see 2021 Q1-Q2 bull).
By evaluating the relative rate of change of the price of bitcoin relative to the rate of change of the realized price, we can evaluate market momentum. Currently, the Delta Gradient is trending upwards but has yet to cross the 0.0 threshold, signifying that a current market downtrend is likely still in play.
With all of this being said, it should be noted that the primary driver in the bitcoin market today (due to the risk off occurring in legacy markets and relatively small amount of capital inflows flowing into bitcoin) is derivatives.
Shown below is the three month futures annualized rolling basis since the start of August.
The correlation is quite clear, and shows us that a large part of the price action in the market over the last quarter has been driven by incumbents in the derivatives market, whether to the upside or the downside.


fucking send it already ₿!! lol.