Rising Dollar Index
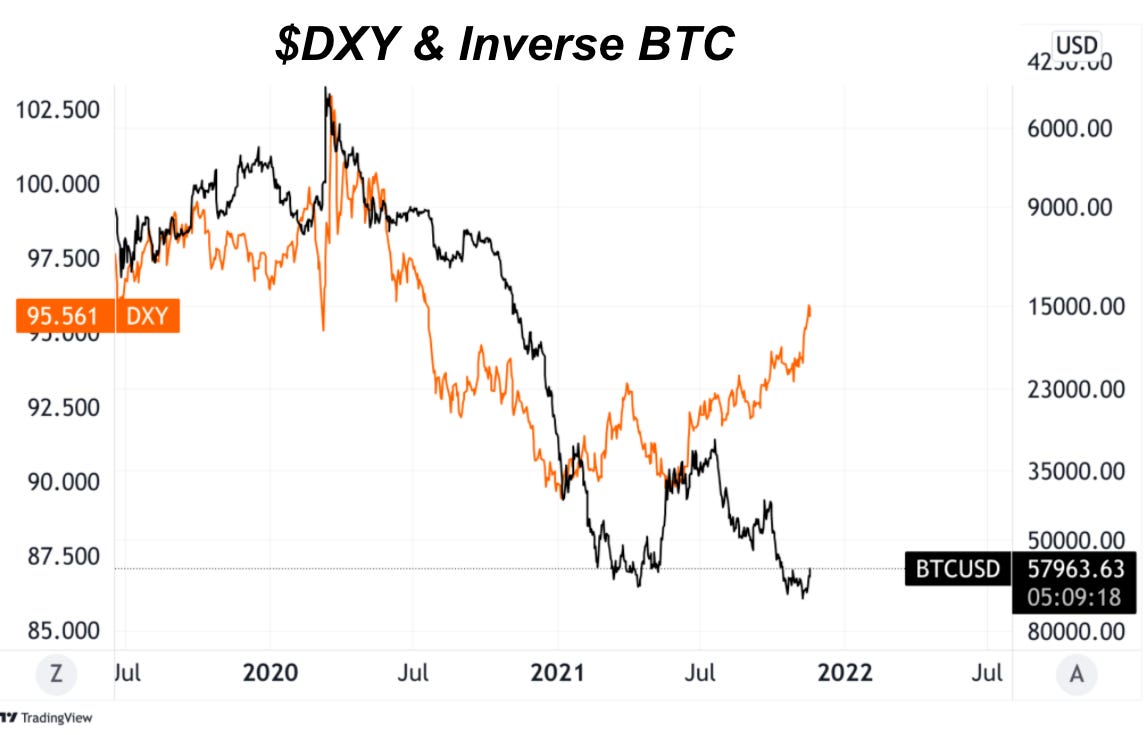
The DXY (U.S. Dollar Currency Index), which measures the value of the USD against a basket of other fiat currencies, has continued to strengthen over the course of 2021, currently trading at 95.57.
While many investors are rightfully focused on consumer and asset price inflation in the United States, the growing strength of the dollar against other foreign currencies is something to keep an eye on.
Due to the dollar’s role as the world reserve currency, vast amounts of dollar-denominated debt exist offshore, outside of the purview of the Federal Reserve Board. A result of this dynamic is that a rising dollar relative to other foreign currencies (even if the dollar is devalued against real goods services, and financial assets) can cause financial market meltdowns, as a dollar “short squeeze” unfolds, as debtors are forced to sell any USD-denominated assets they may hold to cover their liabilities. Although it was induced by the COVID-19 economic lockdowns, the rise in the DXY in March of 2020 coincided with a crash in global financial markets. This is not a coincidence, but rather simple math. For most global financial assets, bitcoin included, the dollar is the denominator in the trading pair, and if the denominator is increasing in value, the value of the asset will drop as a result.
Notably, throughout much of 2020, the DXY and bitcoin were very closely inversely correlated, as a weakening dollar served as a boon for all dollar-denominated financial assets. Since then however, the two have diverged, with the DXY rising through much of 2021 in tandem with the price of bitcoin.
Does this mean that bitcoin is headed back to around $20,000 because of dollar strength? Absolutely not, as bitcoin is undergoing its own monetization process and adoption curve, but the strength of the dollar against other fiats is notable, and should be acknowledged and watched by investors of all asset classes, because if the trend continues, it could cause a deleveraging across asset classes that presents a fantastic buying opportunity for those looking to acquire bitcoin on the cheap.
It is important to restate that the DXY can rise in tandem with high Consumer Price Index readings, and a sustained uptrend in the DXY towards levels seen early in 2020 would assuredly create headwinds for other asset classes that trade against the dollar, bitcoin included.
Exchange Balances At Three-Year Lows
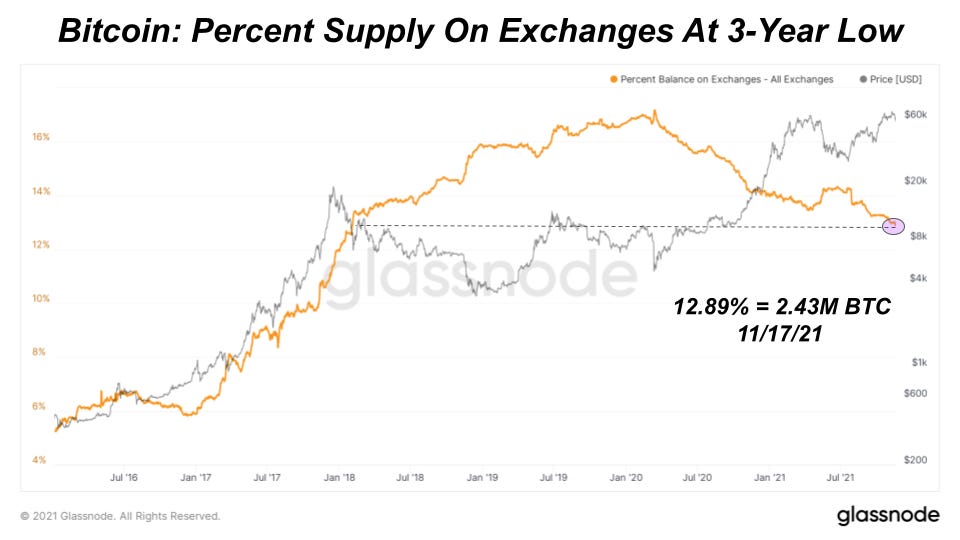
With bitcoin price falling below $60,000, let’s revisit the current state of exchange balances and bitcoin exchange flow activity. At a macro level, the decline in bitcoin supply on exchanges continues with the percentage of bitcoin on exchanges of circulating supply hitting another three-year low yesterday. The secular exchange balance decline that started in March 2020 has not changed.
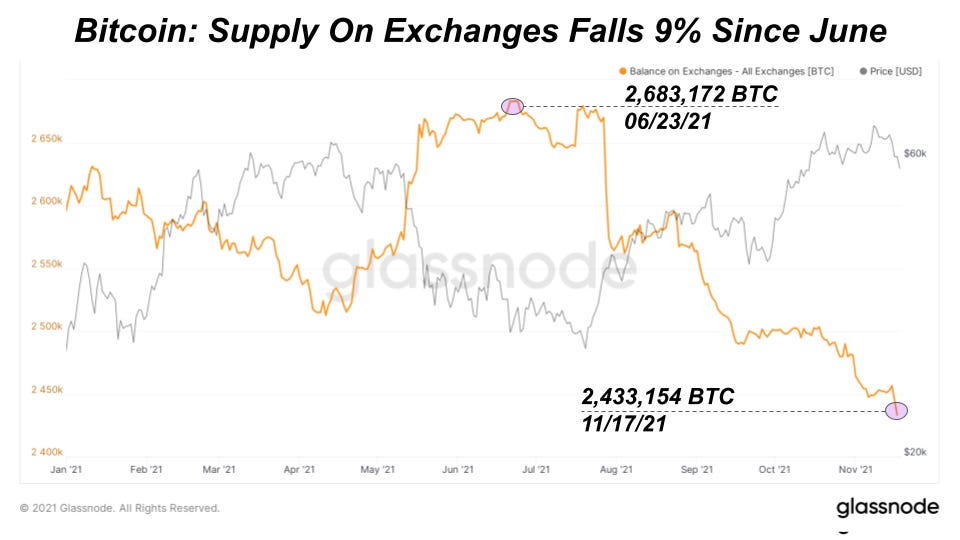
During the previous all-time high over the summer, we saw an exchange supply percentage increase as more bitcoin flowed into exchanges to sell the top. Yet, exchange balance supply has fallen 9%, over 250,000 BTC, since the June peak this year and looks like it is continuing the trend. If this were the macro cycle top, we would expect to see more bitcoin flowing into exchanges to sell.
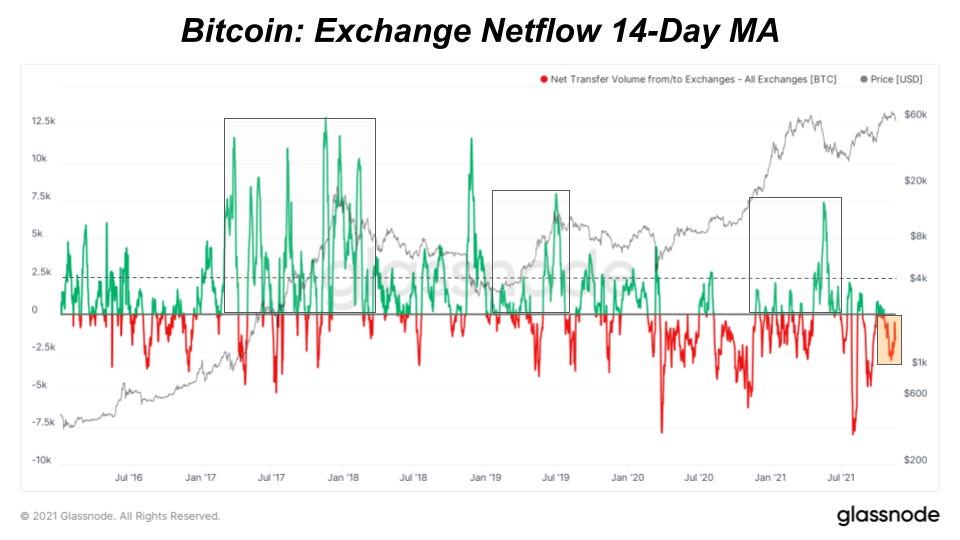
Another way to view exchange balance activity is to look at the daily netflow volume that can be inflows or outflows. Exchange wallets and addresses are classified using proprietary data science, statistics and clustering techniques from Glassnode. Generally, we want to be cautious with interpreting this data as exchange classifications are difficult to do and constantly change as exchange practices change. For example, let’s say there’s an alert that shows 10,000 BTC outflowing from an exchange on a specific day. It’s best to wait a few days for confirmation that this is not an unclassified internal exchange wallet transfer.
To account for changes in daily volume and view broader trends, we can look at a 14-day moving average of the data. When compared to all-time high runups and previous tops, we saw much higher inflow activity in the market that we’re not seeing today. If this was the macro top, we would expect to see higher exchange inflows to indicate more selling.
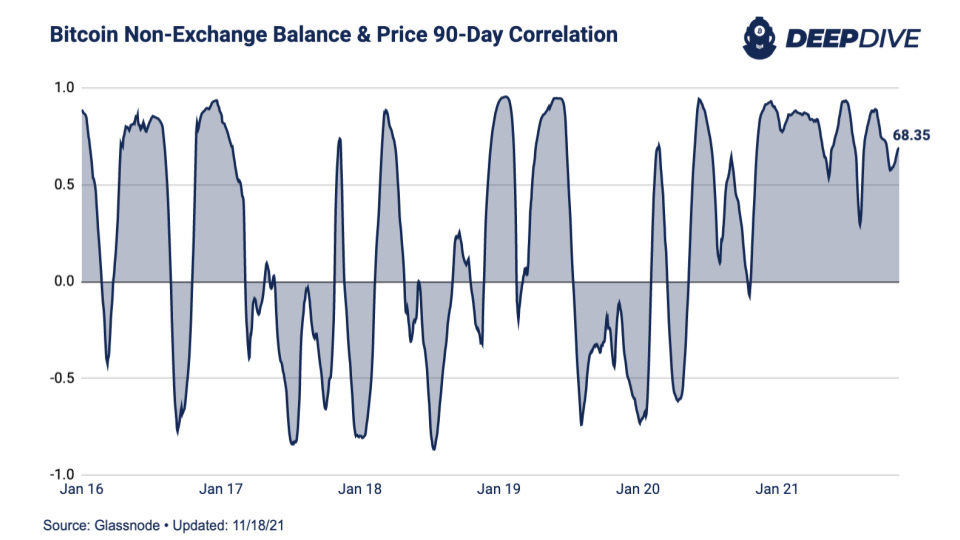
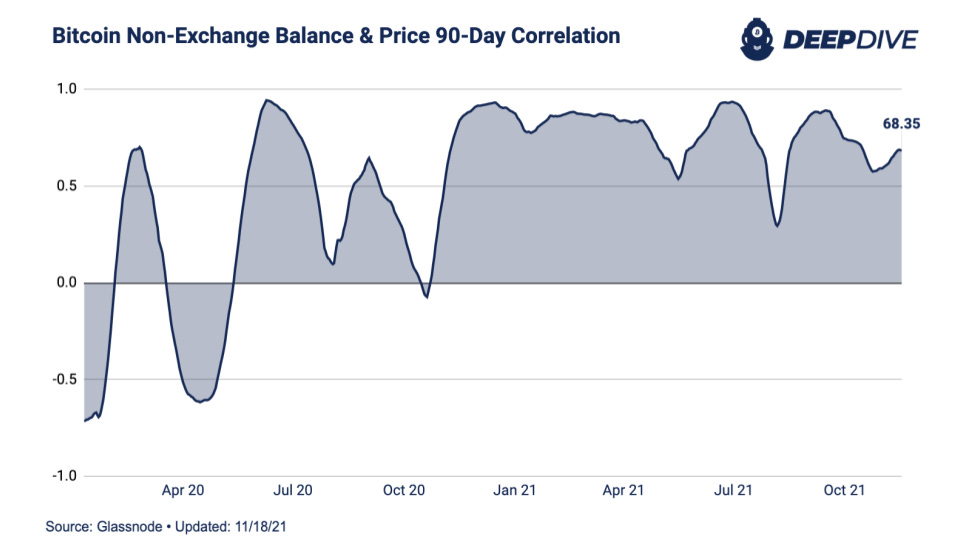
With balances on exchanges hitting new lows, non-exchange balances are rising. A couple of months after the secular market shift in March 2020, there has been a rising, sustained correlation between non-exchange balances and bitcoin price. This is a unique period compared to the last five years. It’s another way to illustrate the supply shock dynamics’ effect on price that we’ve discussed before. In bitcoin’s history, we’ve never seen bitcoin leave exchanges at this rate. Assuming that bitcoin is off the market, less supply is available to buy which puts upward pressure on price as new demand enters.


every day is a good day to buy... especially today. lol. $56k?! yuh.
thank you very much, very excellent report , i am your fans, i will follow your advice, thank you