The Daily Dive #091 — Bitcoin Liveliness & Transfer Volume
Bitcoin Liveliness Overview
The first half of today’s Daily Dive will examine the recent trends in Bitcoin liveliness.
Before diving in, let’s define Bitcoin liveliness. Bitcoin liveliness is a metric that offers insight into on-chain HODLer behavior. Technically, Bitcoin liveliness is a ratio of the cumulative coin days destroyed (CDD) and the sum of all coin days ever created.
To break this down further (and to review what qualifies as a “coin day”):
Over the course of one day, 1.0 BTC will generate one coin day, over the course of one week 1.0 BTC will generate seven coin days, etc.
Coin days are destroyed when bitcoin are spent, i.e. 1.0 BTC held for a week and then spent would create and then destroy seven coin days.
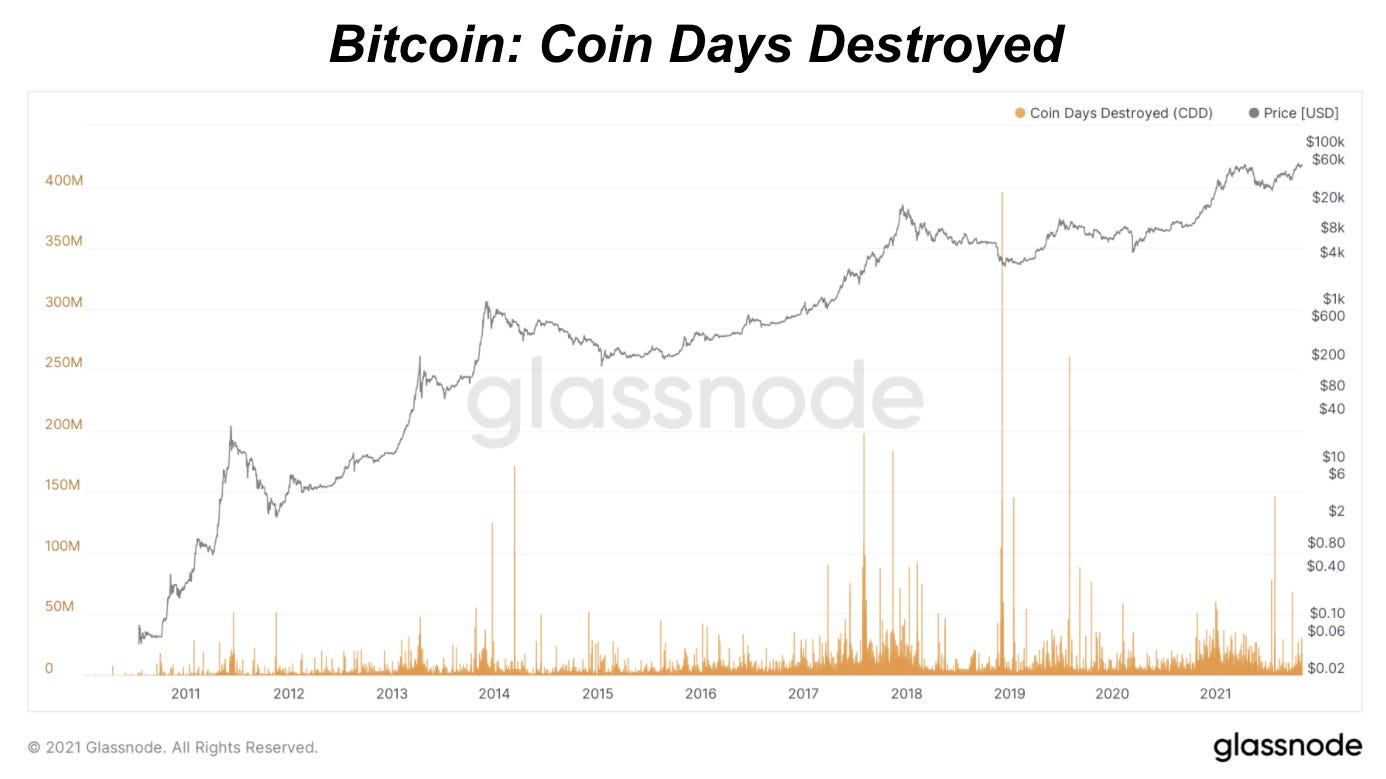
Below is the daily chart of coin days destroyed, which fails to provide any real signal.

However, moving addresses or rolling sums of coin days destroyed can be very helpful for identifying accumulation and distribution trends for bitcoin HODLers. Shown below is the 90-day rolling sum of coin days destroyed, which is showing that bitcoin is currently in one of the strongest three-month accumulation periods in its history.

Now let’s check back in with Bitcoin liveliness.

As mentioned above, Bitcoin liveliness is a ratio of the cumulative coin days destroyed and the sum of all coin days ever created. Thus, when more coin days are being created than are being destroyed (accumulation periods), liveliness will be trending down, and when more coin days are being destroyed rather than created, liveliness will be trending up.
In a thought experiment, if there was a blockchain and every coin (technically: UTXO) was spent at once, liveliness would jump to 1.0, and conversely, if there was a blockchain where no coin every moved after it entered circulation, the liveliness of said coin would be 0.
Many low-cap alt coins have extremely low levels of liveliness.
When taking a closer look, since the start of 2020, we can identify some key on-chain HODLer trends:
The prolonged accumulation period starting in March 2020 and extending into November
The heavy distribution that began to occur in November, as a large amount of new capital entered the space
Decelerating levels of distribution through May 2021
One of the strongest periods of accumulation ever from May 2021 to today
Below are the charts from the start of 2020 and the start of 2021 for a closer view:


Bitcoin liveliness is just another insightful metric that can be used to identify cyclical trends during the monetization period of bitcoin. Make no mistake about it, the accumulation has been occurring, the spring is loaded up, and bitcoin is preparing for its next parabolic advance.
The next section will highlight some of the recent trends in transfer volume on the network.
Transfer Volume At All-Time Highs
The transfer volume on the Bitcoin network can help gauge the current level of network activity and provide a better understanding of how much value the network is moving in BTC and USD denominations. To measure total transfer volume, we use Glassnode’s entity adjusted metrics which uses advanced heuristics to determine and exclude volume transferred within addresses of the same entity.
Using a 30-day average of transfer volume in BTC, the network reached a three-year high moving 318,830 bitcoin at its peak in early October. Since then it’s slowed down to around 275,000 bitcoin per day. Yet with the price increase, total transfer volume in USD is sustaining $15 billion transferred on the network per day throughout October.


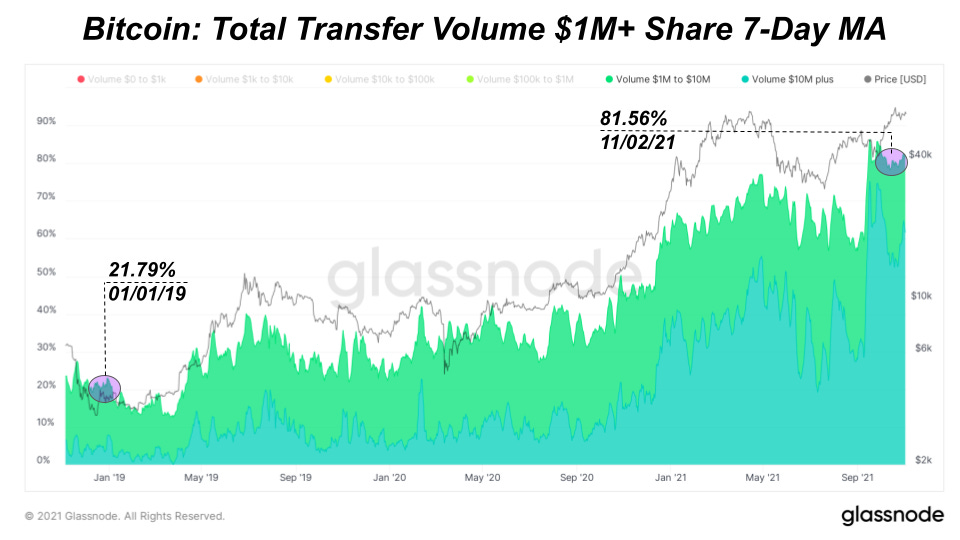
We can break down the total transfer volume in USD categorizing smaller and larger transfer volumes. The lion’s share of total transfer volume on the network comes from transactions moving $1 million plus in value which now makes up 81.56% of all transfer volume. This trend of increasing share of $1 million plus volume to total volume has been rising since late 2020 with a recent surge in September. In layman's terms, more of the big money is moving around the network than ever before, especially over the last two months.
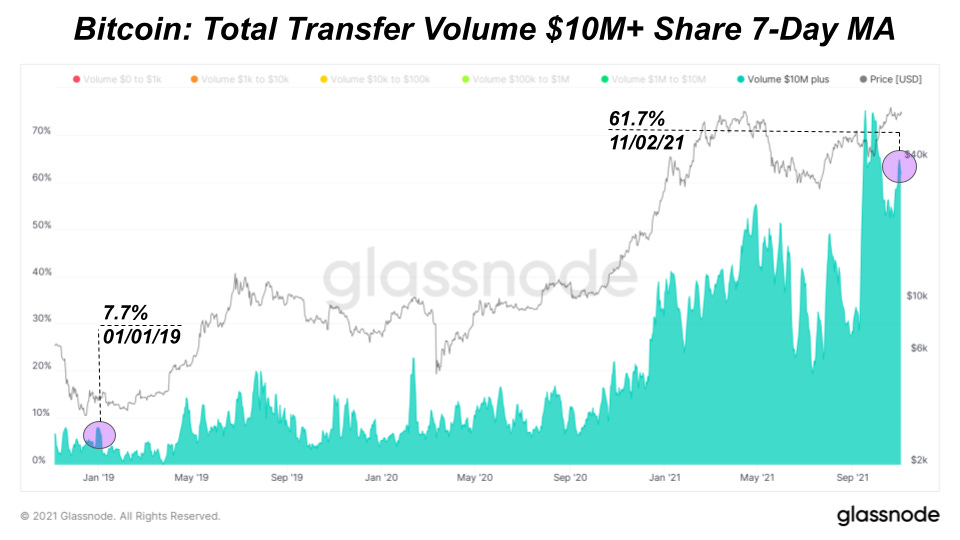
Although $1 million plus volume makes up 81.56% of total volume, $10 million plus volume is the majority share of total volume at 61.7%. We can see a spike in the $10 million plus volume activity reaching over 75% share of total volume slightly before September’s monthly low. That activity is largely sustained right before bitcoin’s rally from $40,633 into a new all-time high.


