Long-Term Holders Cycle Supply Trends
One of the most common patterns in bitcoin’s on-chain history is that of the long-term holders stacking sats during bear markets then and selling some of their positions for profit taking near the tops of bull markets. Right now, long-term holder supply is hitting new all-time highs as we brace for bitcoin’s next bull move up.
We last covered long-term holder supply profit dynamics in The Daily Dive #078. The definitions of Glassnode’s long-term holders and short-term holders can be found here.
As new demand enters the market in the later stage of the bull cycle, long-term holders sell bitcoin to new market entrants, i.e., short-term holders, until the market selling and buying is exhausted. This typically signals the local market price top as new demand is eager to buy at any price. Price then cools off and long-term holders start accumulating again.

Over the summer, as the bitcoin price fell over 50%, bitcoin entered a mini-bear-market-type environment where long-term holders took the opportunity to stack supply at a rate that we haven’t seen happen before during a bull cycle.
This behavior propelled the long-term holder supply to new all-time highs as long-term holders now anticipate higher prices expecting new retail, institution and futures ETF demand to come into the market. Now, we’re still seeing long-term holders add to their holdings, but at a slightly decelerating rate compared to earlier in the summer


Regardless of the decelerating nature of the trend, the simple fact is that long-term holders continue to soak up an ever-increasing proportion of circulating supply. It’s pretty simple: an ever-growing amount of people around the world are coming to understand the monetary properties of bitcoin the asset, and thus a growing number of people are buying bitcoin with no plan to ever sell back for fiat currencies that are engineered to decay in value.
Relative Long-Term Holder Supply

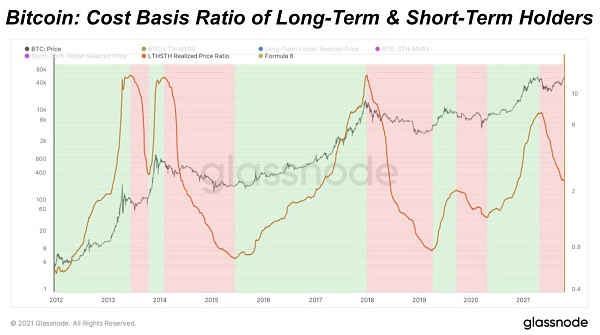
An even more insightful metric is a ratio of cost basis between short-term and long-term holders. We covered this metric extensively in The Daily Dive #070.


The ratio between the cost basis of short-term and long-term holders looks to be bottoming. So what comes next? A reflexive bull market with parabolic price action. Bitcoin bull markets are fueled by new market entrants competitively bidding for a share of available free-float supply, and the data is clear as day: the conditions for parabolic price action are already in place, and interestingly enough, the catalyst for fresh entrants bringing in a new wall of money very well just might be a new all-time high itself.
Lastly, if we examine the rate of change on the ratio itself (calculus anyone?), it can be seen that the cost-basis ratio is bottoming and just about ready to flip positive. This can be seen with the purple line, which flips positive when the ratio is increasing.


Great update! Do you have longer term data for the ratio between the cost basis of short-term and long-term holders - 2017 to date?