The Daily Dive #064 - Derivatives Liquidation And $40,000
UTXO Distribution And $40,000
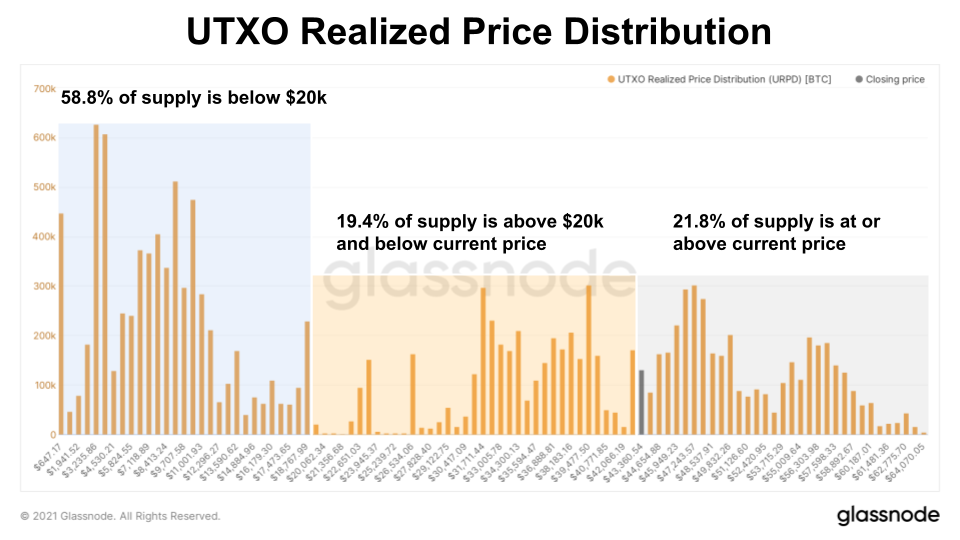
The $40,000 plus range has been a key psychological level for bitcoin price. Since the start of 2020, bitcoin price has existed at or above $40,000 for 155 days, or 36% of the time. Since all of those 155 days happened in 2021, the price has existed at or above $40,000 on 59% of the days of this year. To dig in further, we can use the UTXO realized price distribution data to get some better context on yesterday's decline and how the $43,460 closing price fits within the bigger picture.
Currently, 21.8% of supply is at or above the closing price level showing a significant amount of interest for bitcoin changing hands at a higher range. On the other side, 19.4% of supply is above $20,000 and below the closing price with strong support built up in the $31,000 - $43,000 range. Roughly 25% of bitcoin supply exists above $40,000.
Each bar in the charts shows the amount of existing bitcoin that last moved within that price range. For bitcoin to drop below $40,000, we would have to see a significant sell-off in the market with many short-term investors realizing losses alongside a bigger structural change to long-term holders that accumulated in that 19.4% supply middle range.
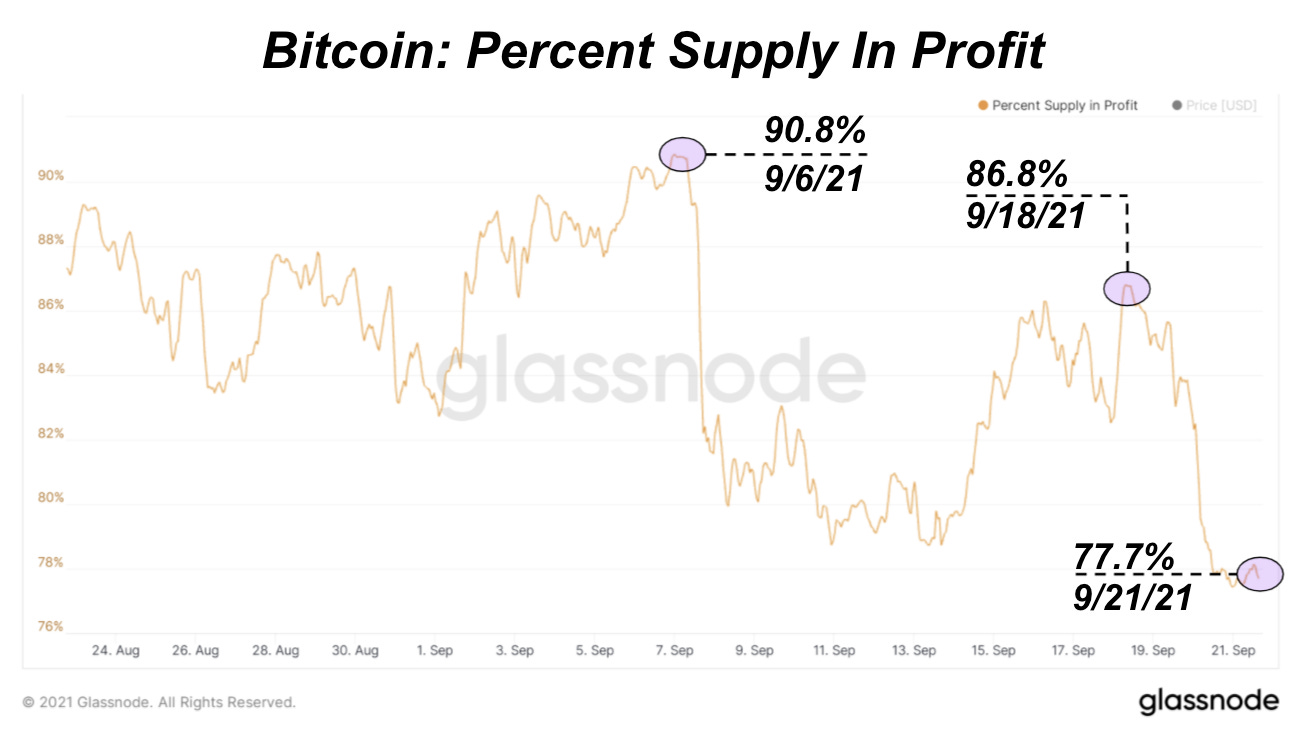
Another way to view potential losses in the market is through the percentage of bitcoin supply in profit. Over the last few weeks, the percentage supply in profit has dropped 13% with most of that decline happening last night. We saw much lower levels at 66% back in July this year right before the 70% price increase from $29,000.
If we do see a further bitcoin price move to the downside in the short term, there looks to be plenty of room for long-term holders in the market to absorb it. This week we're keeping a close watch on derivatives market dynamics and macroeconomic conditions.
Derivatives Market Liquidation
Over the course of September the bitcoin derivatives market played a large part in whipsawing the price back and forth. The spot supply dynamics remain the same, as we have covered extensively in the Deep Dive, which means that derivatives have been among the leading factors in the price action.
When eyeing the percentage of the bitcoin derivatives market that is using bitcoin as collateral versus stable coins as collateral, you can put together a picture of what has occurred in regards to the leverage. Below shows the dynamics which have led to the choppy price action over the last month:
With price falling, while percent of bitcoin-margined open interest rising, it becomes evident that stablecoin-margined longs were the ones who were positioned the worst. Conversely, when price began to rebound on September 14 while the percentage of bitcoin-margined open interest was falling, it shows that bitcoin-margined longs were the ones who got squeezed.
What can be taken from this is as follows:
Derivative market dislocations and corrections are completely healthy in an open global free market.
The most explosive moves come from shorting with stablecoins as collateral or longing with bitcoin as collateral, due to the negative convexity associated with the two different forms of collateral and the underlying price action. If similar market structure continues, volatility can pick up but will stay somewhat muted.
It should be noted that these dynamics and market structure will be rather insignificant if the legacy financial market begins to implode due to the contagion in Chinese capital markets covered in the Daily Dive #063.


