The Daily Dive #062 - Derivatives, Mayer Multiple, Stablecoins On Exchanges
Derivative Market Update
10 days ago, on the day that El Salvador officially adopted bitcoin as legal tender, the price of bitcoin tanked, with the skeptics out in full force. As covered in The Daily Dive #054, the event was driven by cascading liquidations in the bitcoin futures and derivatives markets. Over-leveraged long positions were culled from the market, a very much welcomed and healthy development.
With that said, what is the current state of the futures and derivative markets? Let’s dive in...
Funding on perpetual futures contracts dipped negatively following the September 7 crash, and has stayed at more favorable levels since the event.
Funding rates on perpetual futures contracts are payments made periodically to long or short traders based on the difference between the perpetual contract market and the spot price. Funding rates make the perpetual futures contract price close to the index price. Thus, when funding is high or increasing for sustained periods of time, a leverage flush is often in the works.
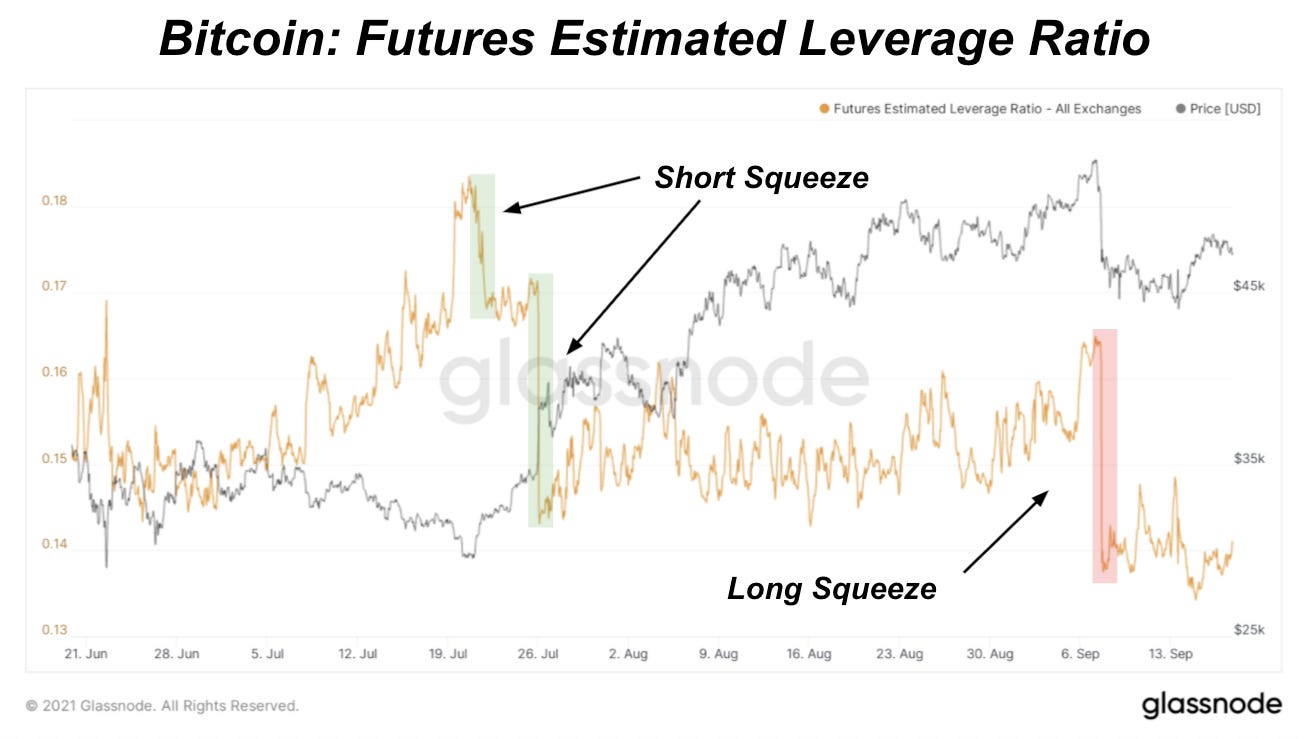
Another useful metric for evaluating the derivatives market is the estimated leverage ratio. The estimated leverage ratio is a ratio of the open interest in futures contracts and the balance of the corresponding exchange. Highlighted below in green and red are the times over the last three months where the leverage ratio plummeted due to large liquidations (green is for short squeezes while red is for the long squeeze).
It can help to think of this as an imbalance in the market that is self correcting by nature. Futures and derivatives can and do move the market in a major way, but what matters most is the underlying spot supply and demand dynamics. By definition a financial market “derivatives” value is derived from another source, and that source is the price in the spot market.
Shown below is the total open interest in bitcoin futures markets denominated in BTC. When denominating open interest in bitcoin terms, you can see these imbalances correct in real time:
While this is cause for concern for many of the loudest skeptics, the inherent beauty of a decentralized, global, 100% free market for money should not be missed. Liquidations, either on the long or short side, hardens the core base of holders. There are no bailouts. Bitcoin is completely antifragile, and when contrasted with the legacy financial system, the differences could not be more stark.
Mayer Multiple and SSR
Two additional metrics/indicators that we're keeping eyes on that support the narrative for a major Q4 move, Mayer Multiple and stablecoin supply ratio. Both show bullish signs.
The Mayer Multiple was created by Trace Mayer as a way to analyse the price of bitcoin in a historical context. It is the ratio of the current bitcoin price over the 200-day moving average. It can give us useful context to where bitcoin price currently is in relation to its long-term trend.
A low Mayer Multiple indicates bitcoin price is cheap compared to its long-term trend. A high Mayer Multiple indicates price is expensive compared to its long-term trend. Interestingly enough when looking at the chart, the Mayer Multiple peaks with local bitcoin price tops and bottoms in a similar way. Currently, the Mayer Multiple value is 1.04, which is well below the series average of 1.44, coming off a local bottom in late July. Based on its historical patterns, there’s a case to be made that we see the Mayer Multiple trend back to its average.
We can also look at its distribution over bitcoin’s history. The Mayer Multiple has historically been higher 63.83% of the time:

In the Daily Dive #042 - Stablecoin Market Overview, we talked about the stablecoin market and stablecoin supply ratio (SSR). As a refresher, SSR measures bitcoin market cap relative to the circulating stablecoin supply. What the SSR tells us is how much stablecoin buying power for bitcoin exists in the market. You can read more about SSR here.
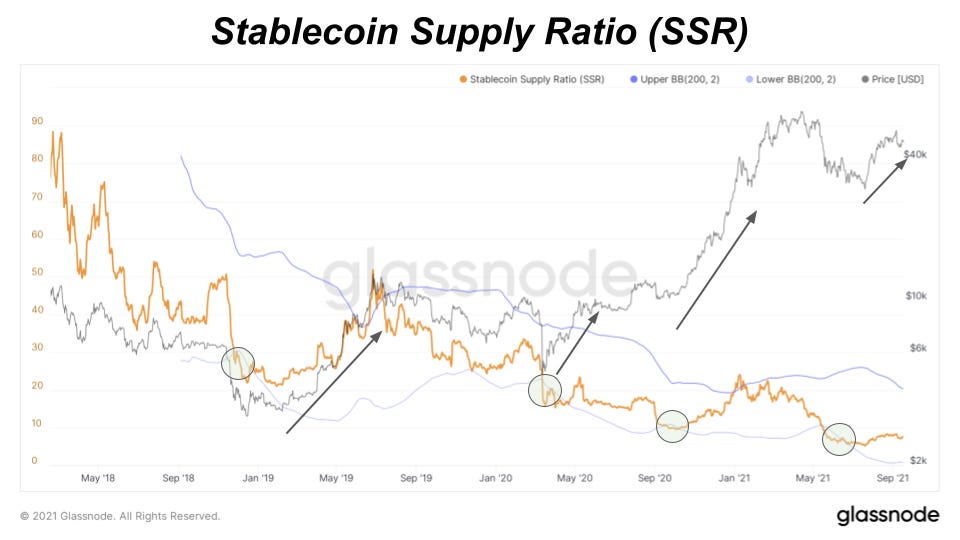
Without increased stablecoin buying power for bitcoin, it’s difficult to support upward bitcoin price moves up. Right now, we’re seeing SSR coming off of three-year lows which translates to more stablecoin supply that can buy up circulating bitcoin. Using the SSR, the existing amount of stablecoin supply can buy up to 13% of the current bitcoin supply.
If we use Bollinger Bands with SSR, we can see that each major low in SSR (touching the lower band) over the last three years coincided with major bitcoin price moves upward. We will caveat that the SSR has certainly gone lower because of an increased rate of stablecoin supply hitting the market this year. However, stablecoins’ main use cases are still to proxy as U.S. dollars to buy and trade digital assets. When bitcoin starts making major price moves again, we can expect more of that stablecoin supply to come off the sidelines, flowing into bitcoin.


