The Daily Dive #029 - Bitcoin Market Cycle Status
Today’s Daily Dive will zoom out and take a look at the cyclical market indicators for bitcoin. While history does not repeat, it often rhymes, and using some of these metrics can give one a look into where we may be in the current cycle and the potential risk/reward trade-off.
Reserve Risk
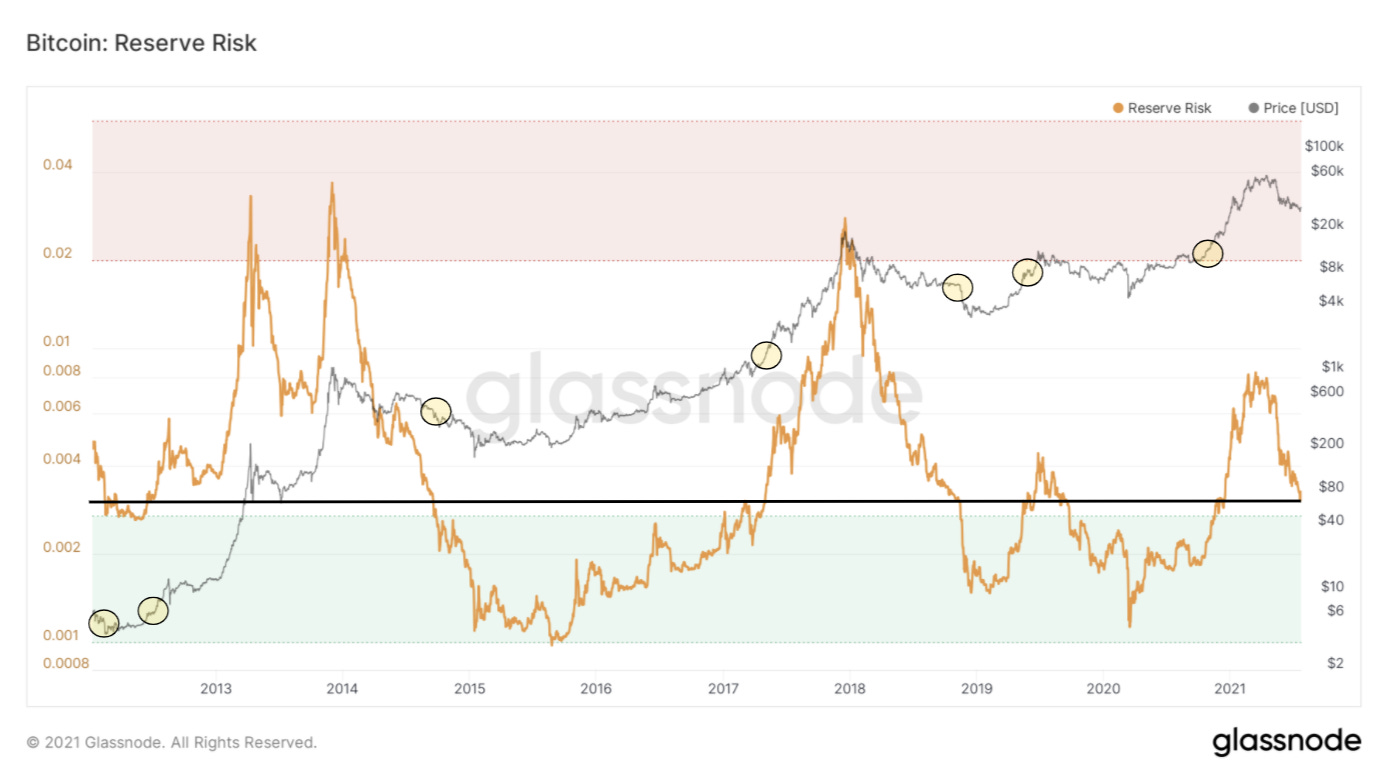
Reserve Risk is a measure that attempts to assess the confidence level of long-term holders relative to the price of bitcoin. Reserve Risk is defined as price/HODL Bank (for more information on the calculation of Reserve Risk, click here).
As the chart of Reserve Risk shows, bitcoin looks to currently be not overvalued, but not extremely discounted/cheap either. When looking at the times in history where Reserve Risk was equal to the level it is today, it is clear that this is not what a “top” looks like.
However, some may look at the previous downswings in Reserve Risk to point out that there is further downside to come. However, as articulated in previous Deep Dive reports, we believe bitcoin to be in a mid-cycle re-accumulation phase, and not a protracted bear market.
Market Value To Realized Value
MVRV is a metric that is covered frequently in the Deep Dive, as we believe that realized price is one of the most pure metrics for evaluating the “fair” value of bitcoin on the network.
Currently the realized price of bitcoin is $19,300, with the price at around $32,000. This puts MVRV at 1.66, which again presents a similar outlook as Reserve Risk: that bitcoin is not grossly overvalued but is also not at absolute fire sale prices that typically are seen at the bottom of bear markets.
For context, the average MVRV over the last year has been 2.44.
Market Cap To Thermocap To Ratio
The Market Cap to Thermocap Ratio is another cyclical metric that can be used to value bitcoin.
Thermocap, also known as the aggregate security spend, takes the dollar value of every bitcoin mined by miners in aggregate, thus the metric is perpetually increasing over time. Currently, the aggregate security spend or thermocap of bitcoin is at $27.7 billion.
Similar to the previous two cyclical top/bottom metrics, the Market Cap to Thermocap Ratio looks to be in the sweet spot between over and under valued. Interestingly, this cycle did not witness the blow-off top in price that previous cycles witnessed. Reiterating the belief that we are in a re-accumulation period, 2013 looks to be an apt comparison to what the rest of 2021 and 2022 could look like.
Puell Multiple
The Puell Multiple takes the daily issuance value of mined bitcoin in dollars by the 365-day moving average of the same value.
The Puell Multiple marks cyclical tops and bottoms so well because as the price of bitcoin gets bid at the margin, miner revenue increases substantially (in dollars), and hash rate increases, which increases miner difficulty, which lowers profit margins and increases sell pressure on the market.
Currently, the Puell Multiple is at 1.05, which is extremely healthy in terms of fair valuation, similar to the cyclical market top/bottom indicators covered above.
All signs point to a re-accumulation period and a continued bull market in the late months of 2021 and into 2022.


