The Daily Dive #020 - Volatility Squeeze & Stock-to-Flow
Make or Break for the Stock-to-Flow Model
It is close to make or break for the stock-to-flow (S2F) model. First released in March 2019 by the pseudonymous Plan B, the stock-to-flow model attempted to quantify the relationship between the relative scarcity of bitcoin and the price of the asset.
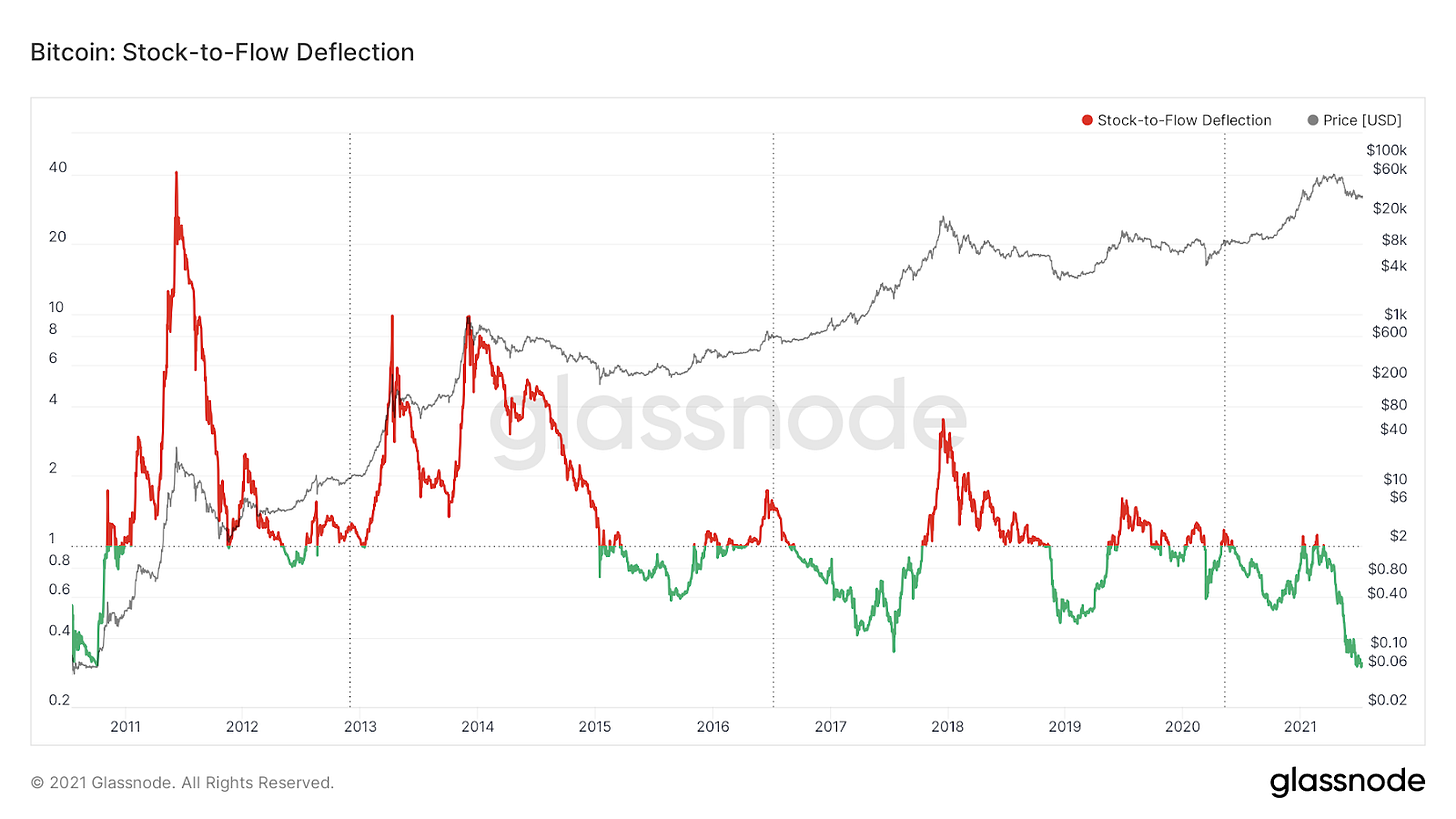
With the model first being released with the price of bitcoin around $3,000, the price of bitcoin impressively oscillated around the model over the past two years, but over the past three months as the price has retraced 50% from April’s highs, the deviation from the model value has widened to historic levels.
At around $25,000, the model would be two standard deviations below the model, which some would argue invalidates the model entirely. While S2F serves as nothing more than an evaluation framework for bitcoin, it can be assumed that a lot of capital inflow occurred on the basis of the S2F model over the last two years.


Currently, the S2F deflection multiple is at its lowest point since October 2010, when the price of bitcoin was $0.06, with the deflection multiple currently at 0.31.. While there was obviously no S2F model back in 2010, and little to no investor activity on the network, this demonstrates how far the current deviation is from the models historical price point.
Volatility Squeeze
There has been a lot of talk on the recent consolidation and low volatility in the price action of bitcoin over the past week. This has led some to call for an impending “volatility squeeze”. A volatility squeeze would mean a break out in either direction from the current trading range bitcoin has been in during the last 2 months.
Below is a dot plot from Alpha Zeta plotting 30 day VOL (x-axis) with the following 30 day returns for bitcoin over the course of the asset’s history. While the dotplot can be somewhat skewed due to the unlimited upside potential against only a -100% downside potential, the plot nevertheless is very telling.
The trend is clear: following periods of low volatility throughout the history of bitcoin, breakouts to the upside are the norm.
Data from Skew show that one-month realized volatility has been trending lower since June 18 following a spike first brought about by the derivatives blow up on May 19.
One-month realized BTC volatility is currently at 85%.
To give readers some context on the realized volatility of bitcoin compared to other asset classes, below is the realized volatility of bitcoin, gold (XAU) and the S&P 500 (SPX) over the last six months.
XAU and SPX realized vol are currently at 13.6% and 11.9% respectively.


