

Prepare For An Explosive End To 2025 For Bitcoin
With Q4 upon us, Bitcoin has now entered what has historically been its strongest stretch of the cycle.

With Q4 upon us, Bitcoin has now entered what has historically been its strongest stretch of the cycle. Leaving September behind, typically the market’s weakest month, investors are asking whether Bitcoin will finish 2025 with the explosive move higher that history suggests. While seasonality alone is not destiny, on-chain data and investor behavior are offering compelling confirmation signals that point to a potentially dramatic end to this cycle.
Seasonality
The Bitcoin Seasonality chart indicates that September has consistently been Bitcoin’s most difficult month, a pattern that held true again this year. But October, November, and December have historically delivered outsized gains, with Q4 standing out as the strongest quarter across Bitcoin’s history. If the four-year halving cycle remains loosely intact, we may now be entering the exponential phase that typically precedes a market peak.
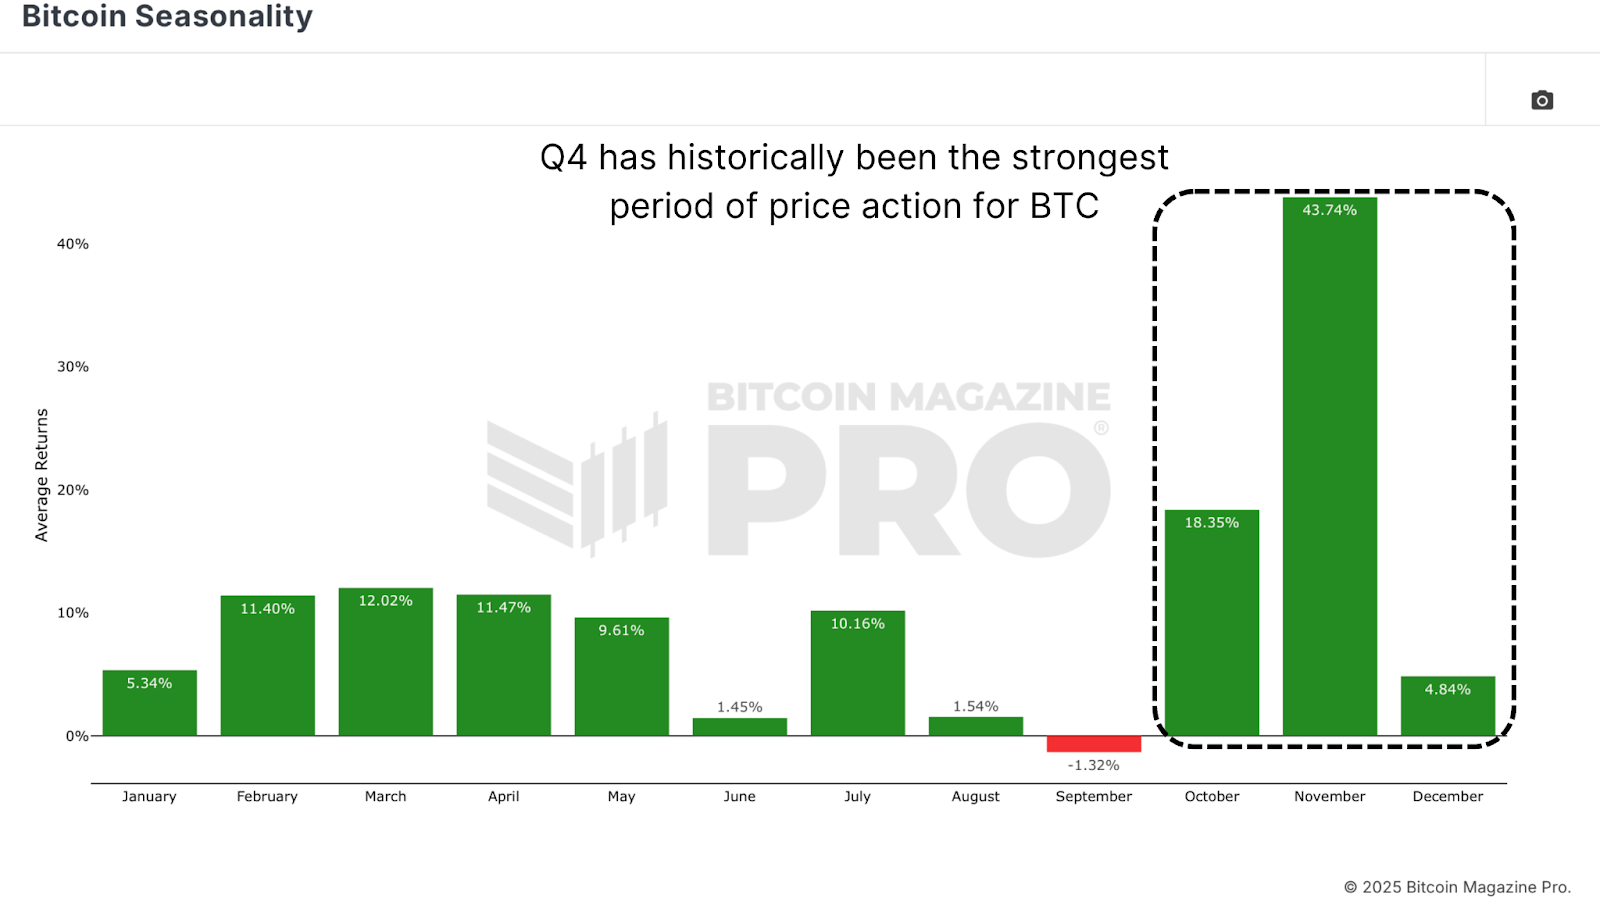
Figure 1: Bitcoin Seasonality highlights Q4 as the strongest period of the year.
Short-Term Holders
Bitcoin recently bounced precisely at the Short-Term Holder Realized Price, the average cost basis for new market entrants. This level has consistently acted as dynamic support in bull markets and resistance in bear markets, making it a reliable measure of investor conviction.
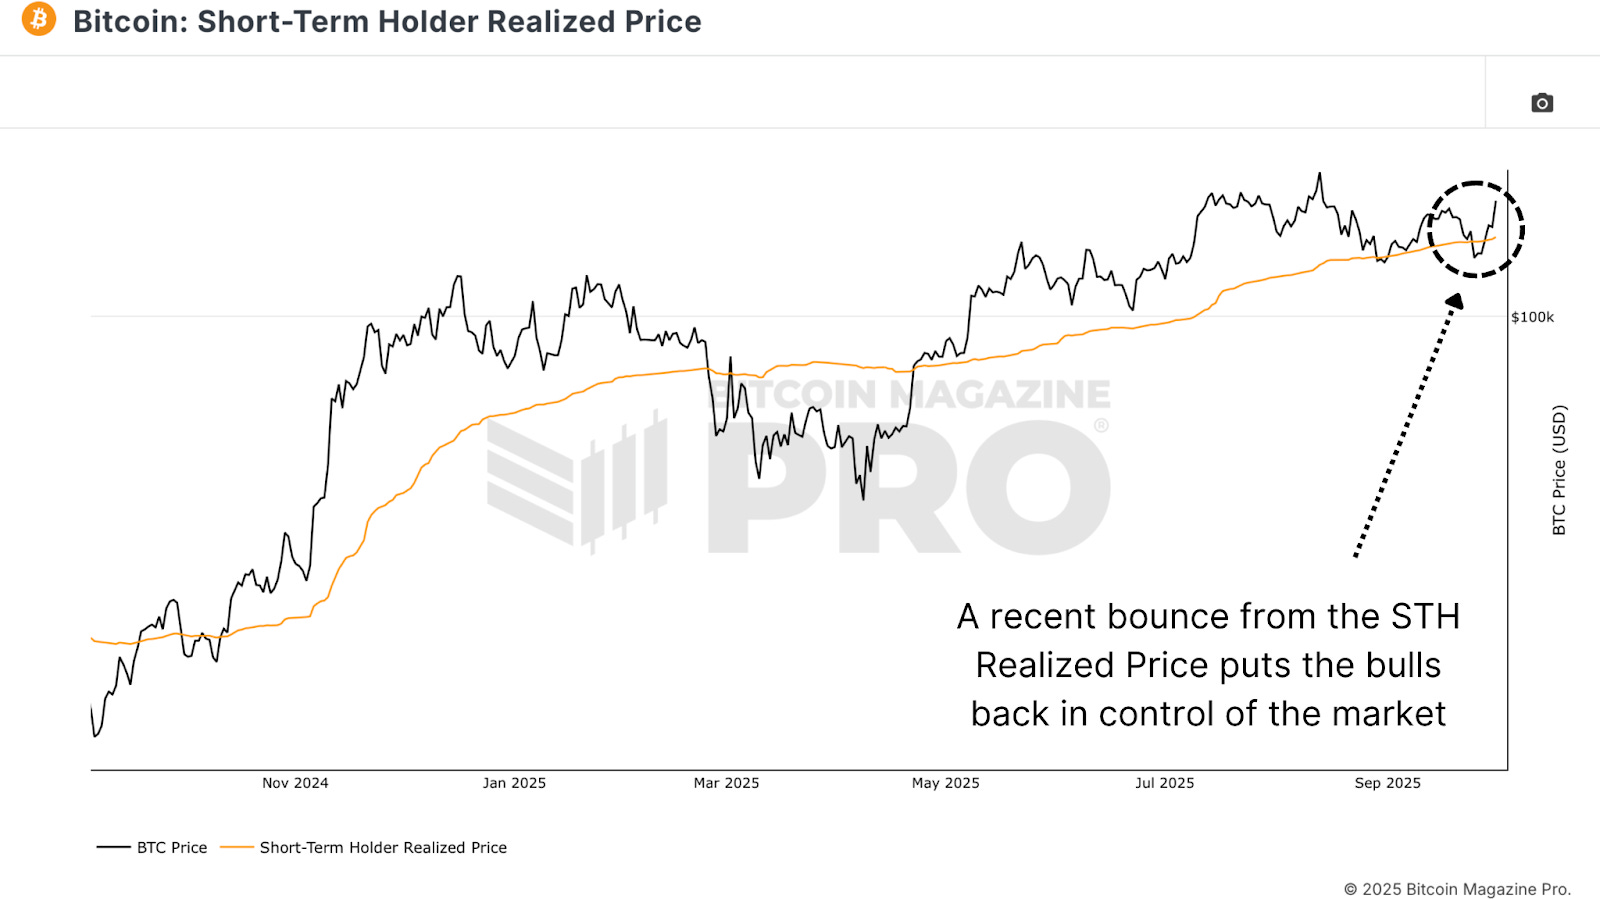
Figure 2: Bitcoin’s rebound from the Short-Term Holder Realized price confirms renewed demand.
Long-Term Holder Habits
The key driver of cycle peaks has always been Long-Term Holders (LTHs) distributing coins to newer market participants. Historically, this profit-taking accelerates sharply as Bitcoin approaches cycle tops. In 2017 and 2021, around 37.8% of the circulating supply shifted from LTHs to Short-Term Holders (STHs) before the market peaked.
This cycle, that threshold has already been reached, with 37.9% being transferred. Still, the nuance is that the overall percentage of Bitcoin held by LTHs has trended higher, reflecting structural changes from institutions, ETFs, and treasury buyers who are unwilling to sell quickly.
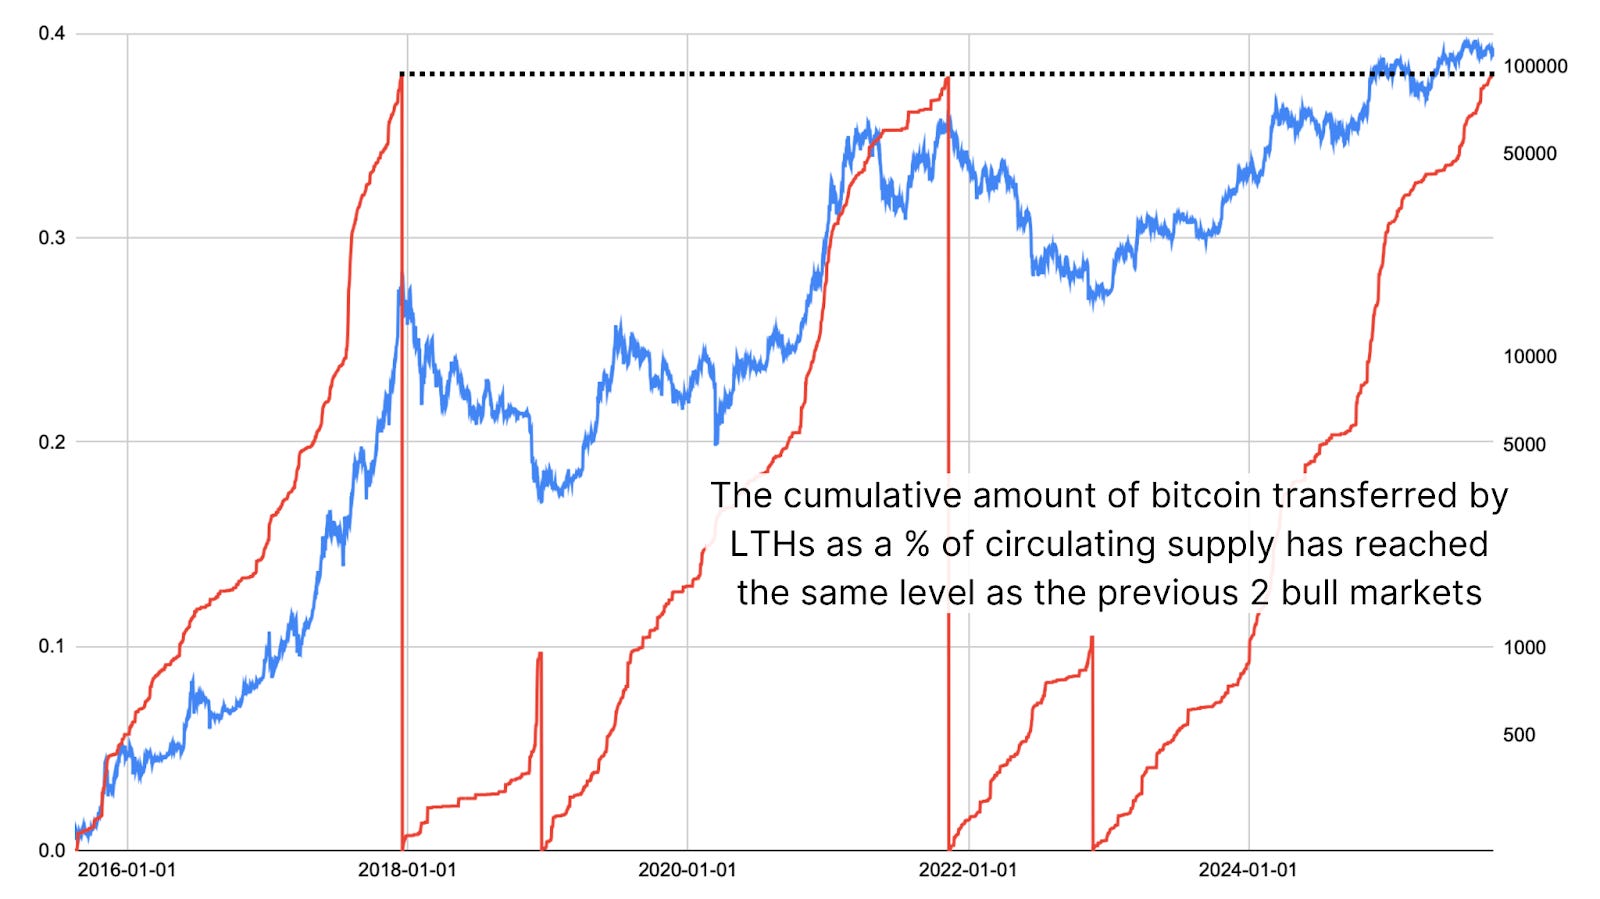
Figure 3: Long-Term Holder Supply turnover remains below prior peak levels when adjusted for total LTH share.
A custom metric tracking the cumulative percentage of Bitcoin transferred from LTHs to STHs when accounting for the amount of the circulating supply held by LTHs adds further clarity. Today, it shows that while we’ve already seen significant profit-taking, the proportion of LTH supply distributed is still lower than in all previous cycles when measured relative to the LTH base. Also, keep in mind that the data is resetting at market peaks and bottoms.
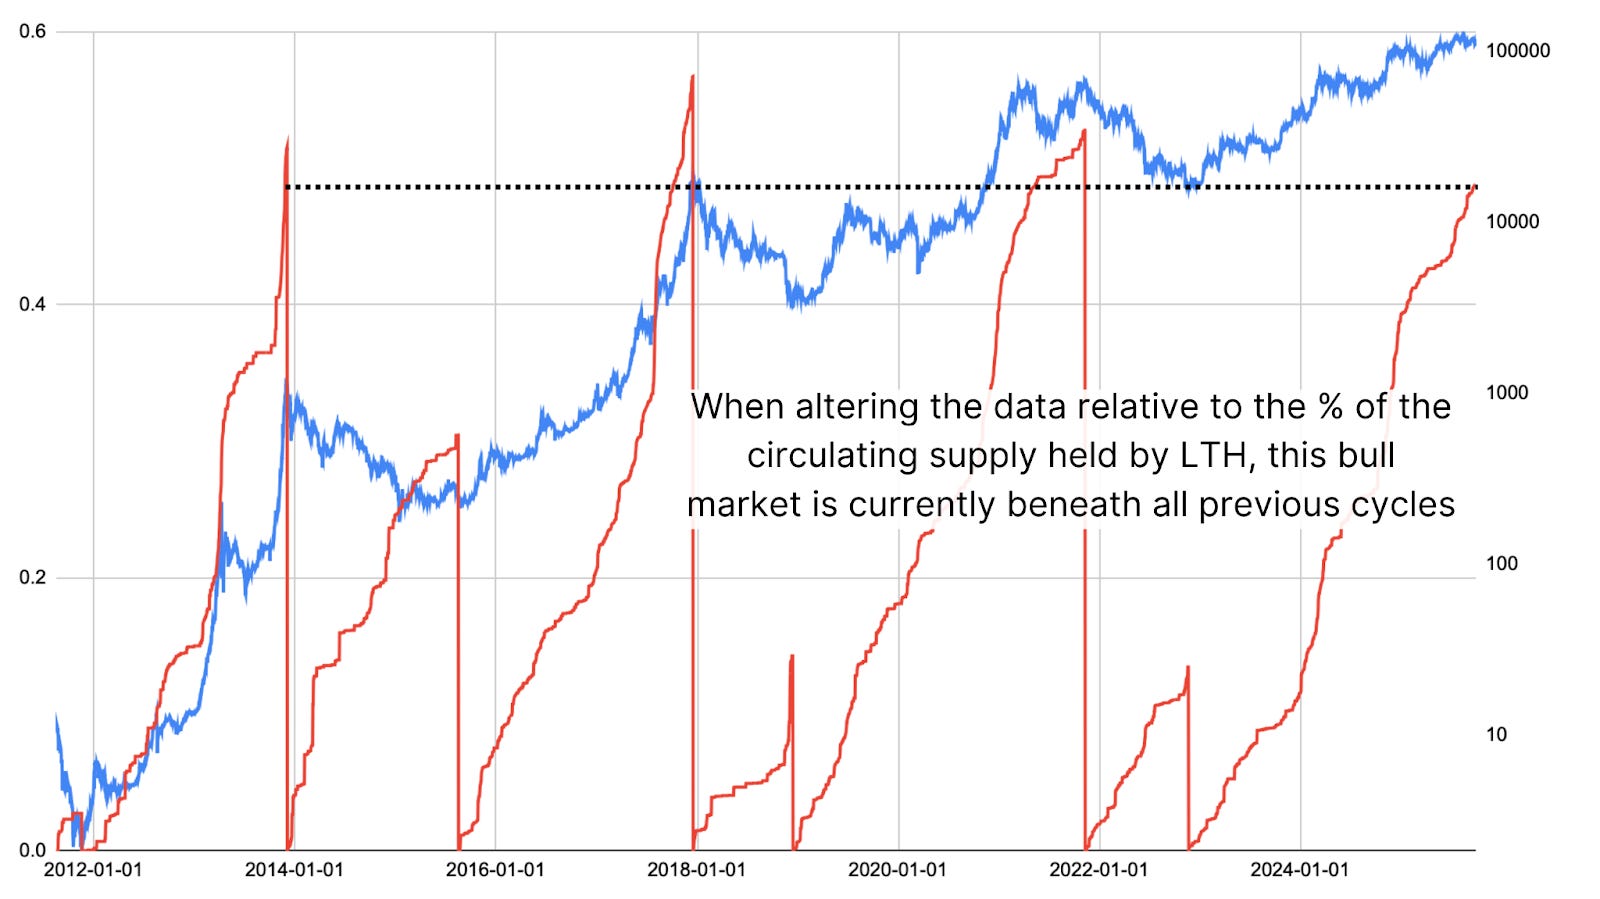
Figure 4: LTH-to-STH cumulative transfers confirm Bitcoin has not yet reached exhaustion levels.
Money Multiplier
Another way to quantify this changing market dynamic is through the money multiplier, which is how much market cap expands relative to each dollar of inflow. When LTH supply dominates, fewer coins are liquid, and the multiplier effect rises. Even after fairly substantial cumulative profit taking this cycle, the multiplier remains high at around a 4.4x. This indicates that a lot of the short-term holders who have accumulated this cycle have transitioned into long-term holders, as a majority of them now look to be holding for the foreseeable future.
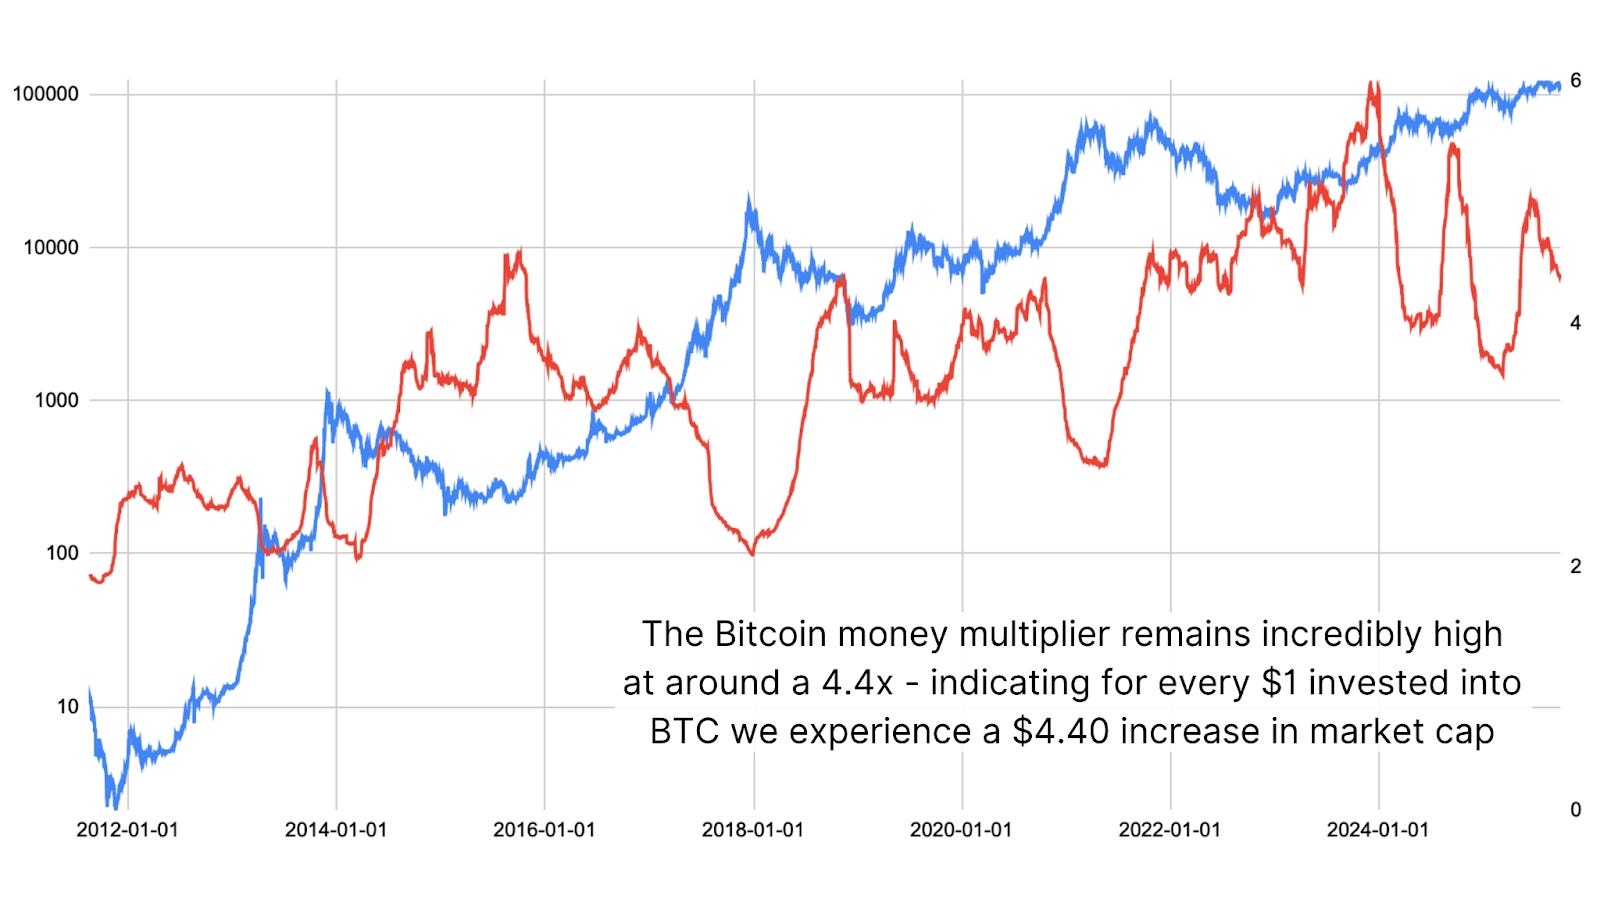
Figure 5: Money multiplier based on long-term holder supply suggests room for further upside.
Conclusion
Long-term holder profit taking suggests that Bitcoin is far closer to the end of this bull market than the beginning, but not at the finish line just yet. Despite having already reached levels of LTH distribution that matched prior cycles on a circulating supply basis, the higher baseline of long-term holder dominance means the market has not exhausted itself.
Long-term holder behavior remains one of the most reliable roadmaps for Bitcoin’s cyclical nature, and it is signaling that the final, most powerful phase of this bull market may be directly ahead.
For a more in-depth look into this topic, watch our most recent YouTube video here: The New Bitcoin Chart That Shows Us What Will Happen In Q4
Matt Crosby
Lead Analyst - Bitcoin Magazine Pro
Bitcoin Magazine Pro

For more detailed Bitcoin analysis and to access advanced features like live charts, personalized indicator alerts, and in-depth industry reports, check out Bitcoin Magazine Pro.
Make Smarter Decisions About Bitcoin. Join millions of investors who get clarity about Bitcoin using data analytics you can’t get anywhere else.
We don’t just provide data for data’s sake, we provide the metrics and tools that really matter. So you get to supercharge your insights, not your workload.
Take the next step in your Bitcoin investing journey:
Follow us on X for the latest chart updates and analysis.
Subscribe to our YouTube channel for regular video updates and expert insights.
Follow our LinkedIn page for comprehensive Bitcoin data, analysis, and insights.
Explore Bitcoin Magazine Pro to access powerful tools and analytics that can help you stay ahead of the curve.
Invest wisely, stay informed, and let data drive your decisions. Thank you for reading, and here’s to your future success in the Bitcoin market!
Disclaimer: This newsletter is for informational purposes only and should not be considered financial advice. Always do your own research before making any investment decisions.