

Predicting The Bitcoin & MSTR Cycle Peaks
Navigating the Bitcoin Bull Market: Price Targets for BTC and MSTR

With Bitcoin breaking into new all-time highs, the inevitable question emerges for every investor: how high can this bull market actually go? In this analysis, we’ll take a data-driven and mathematical approach to try to estimate potential price targets for both Bitcoin and (Micro)Strategy throughout the current cycle.
Reevaluating The Pi
The Pi Cycle Top Prediction chart relies on two key moving averages: the 350-day moving average multiplied by two (green line) and the 111-day moving average (orange line). Historically, when the 111-day MA crosses above the 350-day MA x 2, a cycle peak has occurred within just a few days. Despite its past accuracy, including flawless calls during prior cycles, it's important to remain cautious.

Figure 1: The Pi Cycle Top Prediction chart suggests a cycle peak in early 2027.
At current trajectories, the indicator forecasts a cycle peak around January 17, 2027. However, for any crossover to occur, BTC would need to sustain prices well above the 350DMA*2 for months, likely at prices substantially higher than $200,000. That level of sustained price appreciation seems unlikely this cycle, although I’d love to be proven wrong! While the tool remains a valuable risk management indicator, we shouldn’t rely solely on it for timing macro tops just because of its historical accuracy.
MVRV Ratio
A more grounded method involves the Market Value to Realized Value (MVRV) ratio. By analyzing the relationship between market price and the realized price (the average cost basis of all BTC in circulation), we can set realistic expectations. If we extrapolate a conservative cycle peak MVRV score of 2.8 using prior diminishing returns, peaks we’ve already set in this cycle in the MVRV, and the current realized price of $50,000, we arrive at a current projected Bitcoin top of around $140,000.
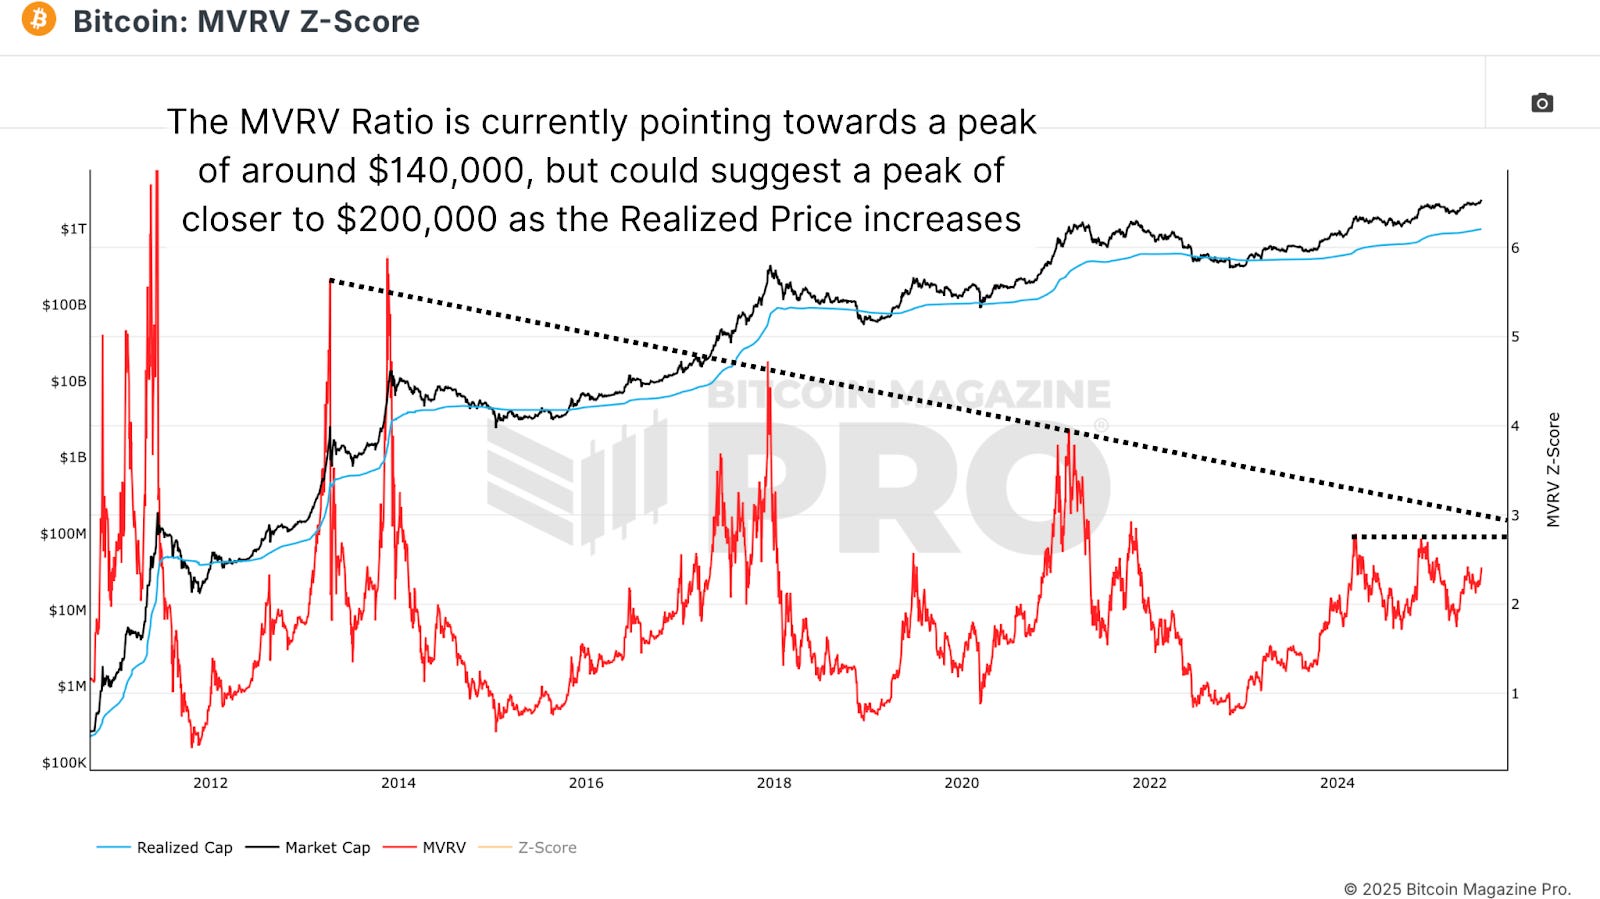
Figure 2: Extrapolating the MVRV ratio points to a cycle top in the region of $140,000 to $200,000.
However, since the realized price continues to increase as capital flows into Bitcoin, a $70,000 realized price later in the cycle would suggest a potential peak closer to $200,000. This method reflects a more dynamic approach to understanding Bitcoin's market behavior based on on-chain data and investor psychology.
Fibonacci Extensions
For more technically inclined traders, Fibonacci extensions can offer insights when entering price discovery. Using TradingView’s Fib extension tool on previous cycle lows and highs, we’ve identified significant levels that have acted as resistance and support historically with an incredibly high degree of accuracy. Along with that, the recent high corresponded incredibly closely to the 1.382 Fib level at ~$122,000.
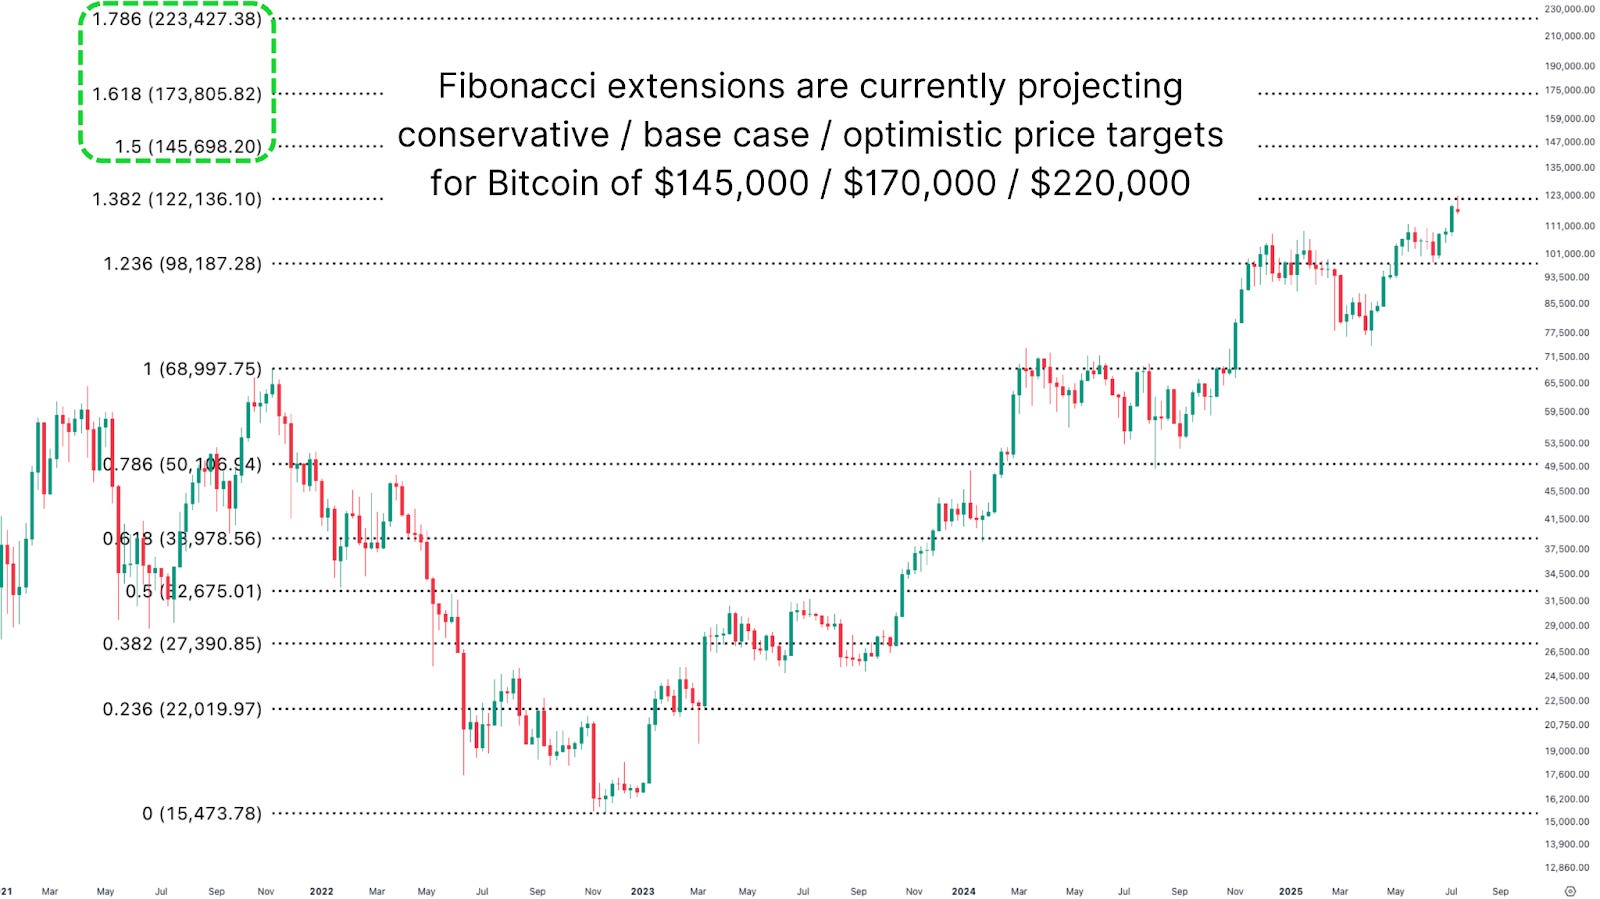
Figure 3: Applying Fibonacci extensions reveals math-based cycle top predictions.
Looking ahead, the 1.618 extension suggests ~$170,000 as a likely cycle top, with a more aggressive upside target of ~$220,000. Interestingly, this aligns closely with the $140k to $200k projections derived from MVRV analysis, providing solid cross-model validation.
Strategy’s Peaks
(Micro)Strategy’s share price is heavily influenced by its growing BTC reserves. The company currently holds over 600,000 BTC and is expected to increase this to between 700k and 800k as the cycle continues. Applying the same Fibonacci framework to MSTR shows a potential resistance around $543, also the current all-time high, and upcoming targets of ~$800 and ~$1,300.
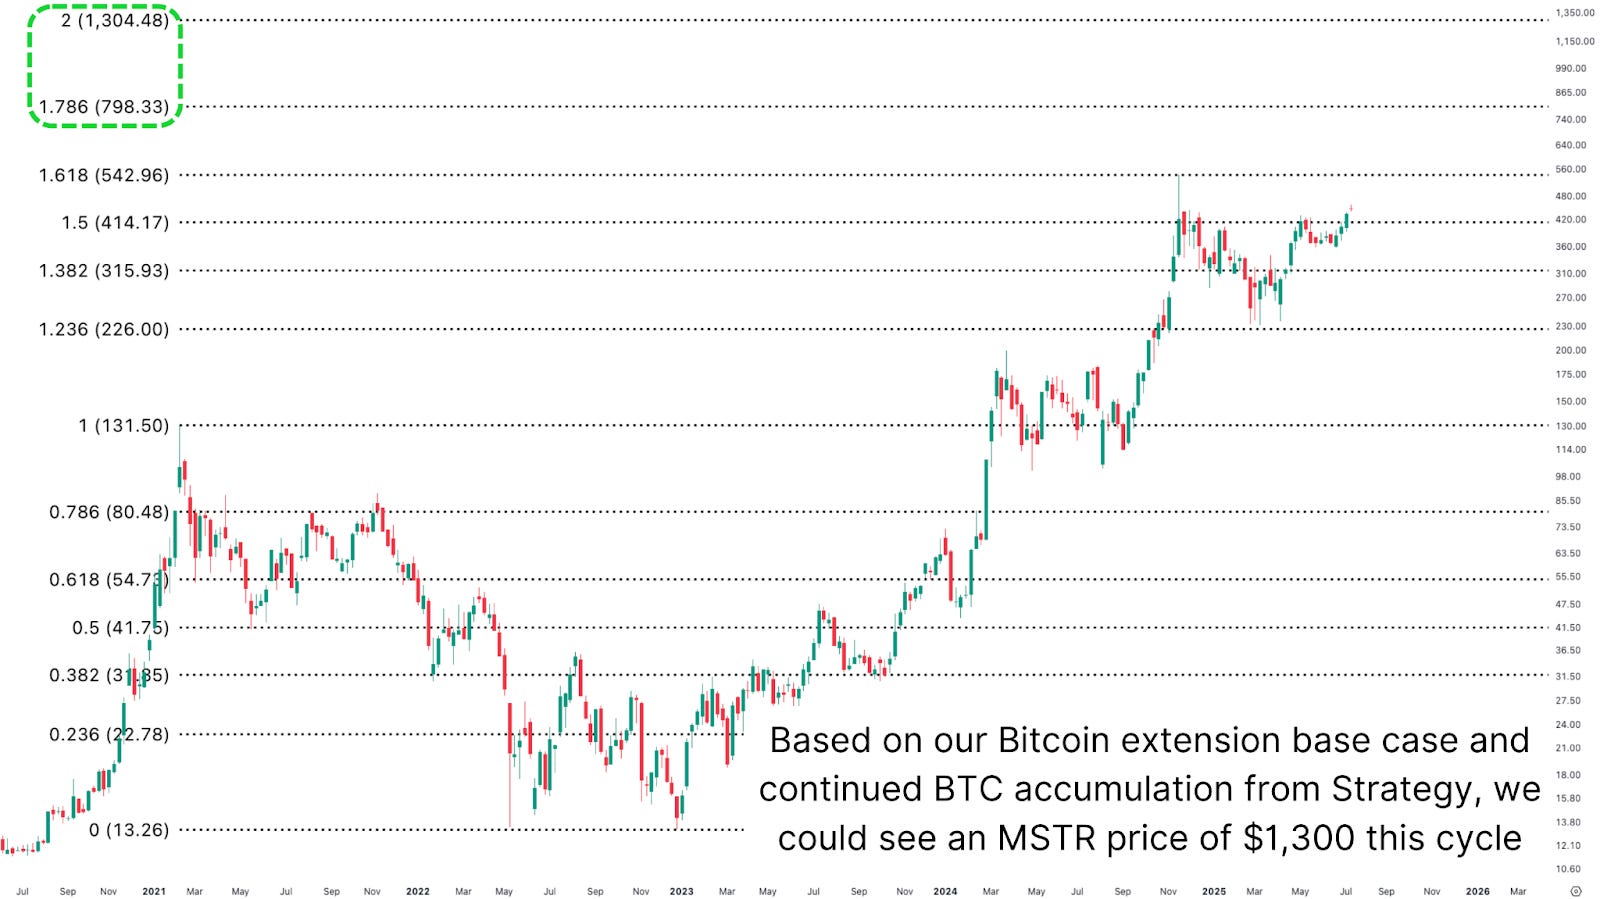
Figure 4: Using Fibonacci extensions to plot potential MSTR price highs.
To validate this, we analyzed MSTR's premium to its Bitcoin Net Asset Value (NAV), which has fluctuated between 2x and nearly 3x multiple times this cycle. Assuming a future Bitcoin price of $170K and continued accumulation, a 2–2.5x premium suggests that MSTR reaching $1,300 is a credible upper bound.

Figure 5: Further analysis of MSTR’s price trajectory supports other predictions.
Conclusion
Bitcoin’s price potential this cycle ranges from $140,000 on the conservative end, to $170,000 in the base case, and up to $220,000 in a bullish scenario. For Strategy, this translates into a likely upper bound of around $1,300, offering asymmetric upside for investors betting on indirect Bitcoin exposure.
Ultimately, while modeling future price action is informative, data should guide your decisions, not dictate them. Don’t cling to round numbers or models alone. Be prepared to act when risk signals emerge, even if your favorite model hasn’t hit its magic number.
For a more in-depth look into this topic, check out a recent YouTube video here: Mathematically Predicting The Bitcoin & MSTR All Time Highs
Matt Crosby
Lead Analyst - Bitcoin Magazine Pro
Bitcoin Magazine Pro

For more detailed Bitcoin analysis and to access advanced features like live charts, personalized indicator alerts, and in-depth industry reports, check out Bitcoin Magazine Pro.
Make Smarter Decisions About Bitcoin. Join millions of investors who get clarity about Bitcoin using data analytics you can't get anywhere else.
We don't just provide data for data's sake, we provide the metrics and tools that really matter. So you get to supercharge your insights, not your workload.
Take the next step in your Bitcoin investing journey:
Follow us on X for the latest chart updates and analysis.
Subscribe to our YouTube channel for regular video updates and expert insights.
Follow our LinkedIn page for comprehensive Bitcoin data, analysis, and insights.
Explore Bitcoin Magazine Pro to access powerful tools and analytics that can help you stay ahead of the curve.
Invest wisely, stay informed, and let data drive your decisions. Thank you for reading, and here’s to your future success in the Bitcoin market!
Disclaimer: This newsletter is for informational purposes only and should not be considered financial advice. Always do your own research before making any investment decisions.
The MVRV score on your website for last cycle is completely different from the chart you illustrate here
Cycle peak mid-August