Part 2: The Bitcoin Ghost Town
Looking across bitcoin financial products, it’s hard to see much institutional demand at these prices. Everyone seems to be waiting for the next big breakout or breakdown move before allocating again.
Relevant Past Articles:
The Bitcoin Ghost Town
Part 2 of Thursday’s article published 10/20/22 for paid subsribers.
The below chart shows the GBTC’s daily volume well below the product’s average in the second pane in gray. Today’s volume is only 38% of the historic average and around 6.8% of the GBTC daily volume at peak. The third pane shows a colored version of the 30-day moving average volume where dark blue is the highest period of activity and dark red is the lowest period of activity. Currently, we’ve been in one of the lowest volume and activity periods — dark red — since late August.
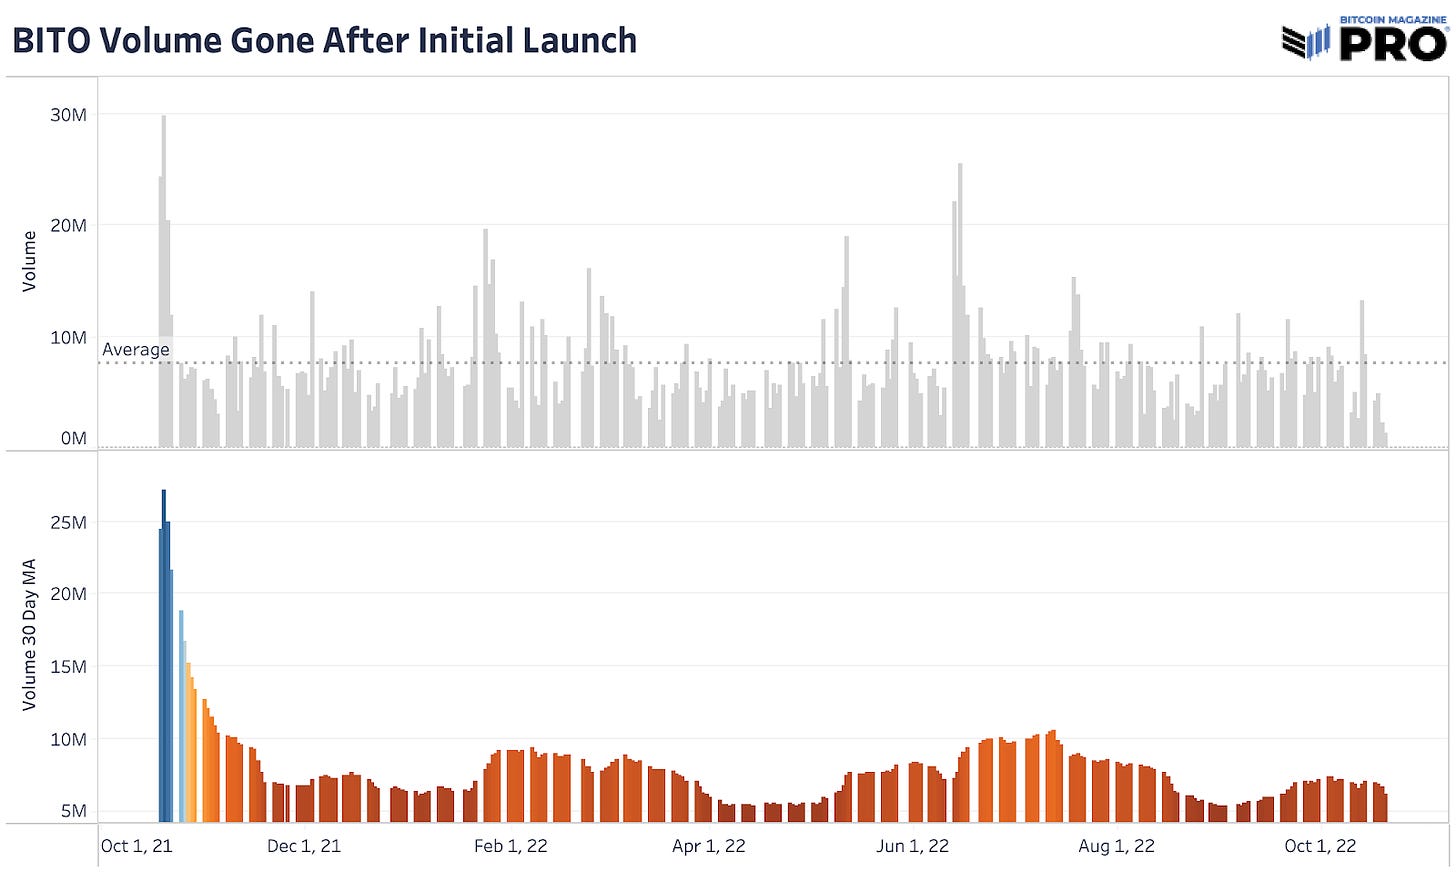
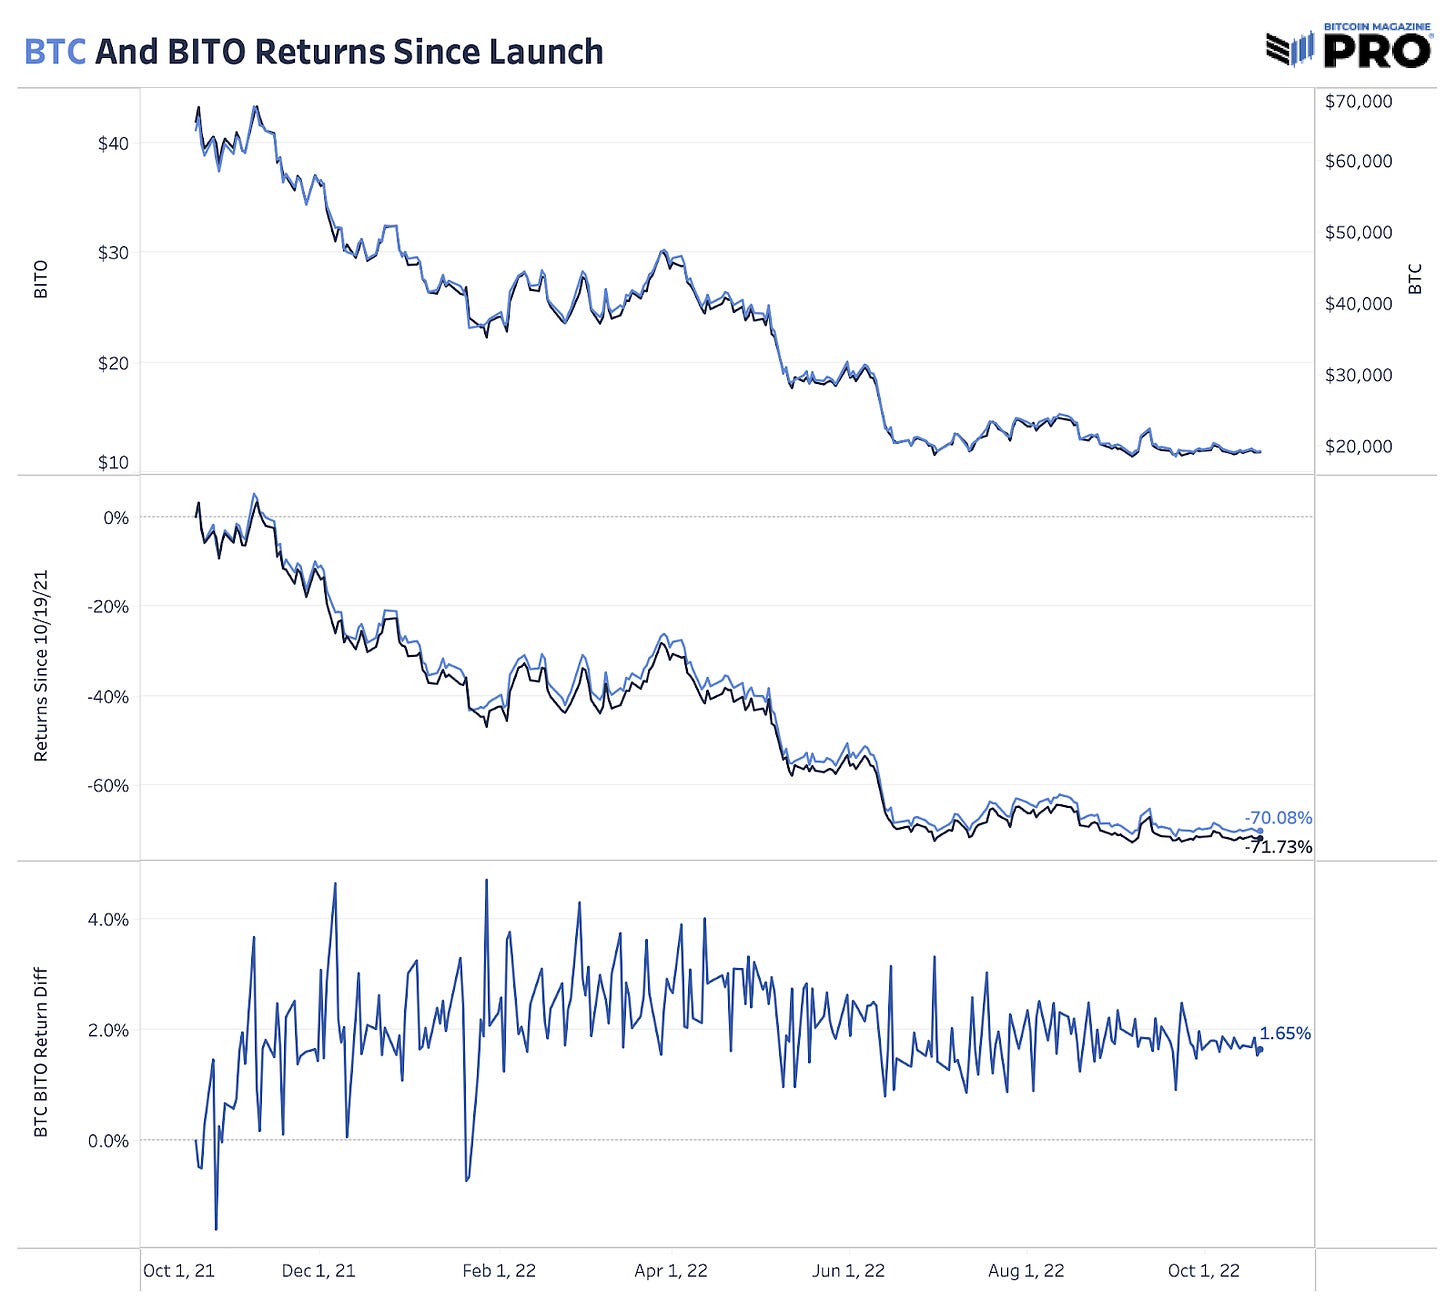
Although not depressed to record-low levels of volume, it’s a similar trend for the BITO futures ETF volume after the initial launch back in October 2021. In fact, since the launch there’s been little to almost no spread difference across returns between the futures ETF and bitcoin. The launch of the ETF pretty much nailed the top of the market, returning a negative 71.73% since then versus a negative 70.08% for bitcoin. The spread is much higher during short-term periods of upside but hasn’t proven to be all that much different in terms of overall returns, which leaves little room for speculation and arbitrage between the two.
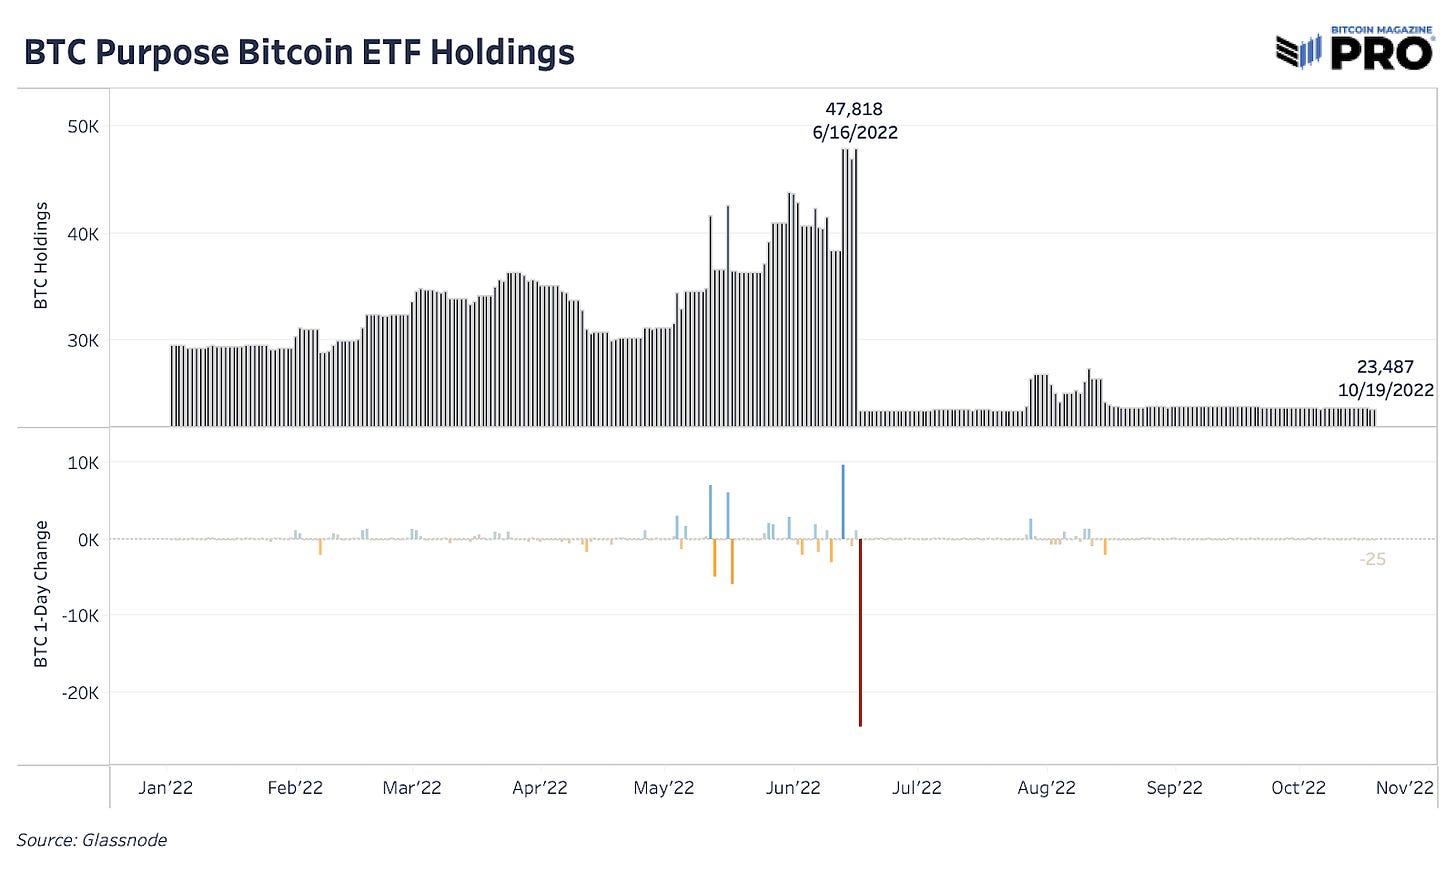
We can also look at the Purpose Bitcoin spot ETF as one proxy for institutional fund flows. It doesn’t reflect the total fund flow in the market and demand for bitcoin, but still had a substantial chunk of investor capital at 47,818 bitcoin at its peak back in June 2022. Since then, spot holdings tell of a similar lack of investor demand at the institutional level. Bitcoin holdings are down to 23,487 and have seen almost no activity despite a small bump and retrace back in August.
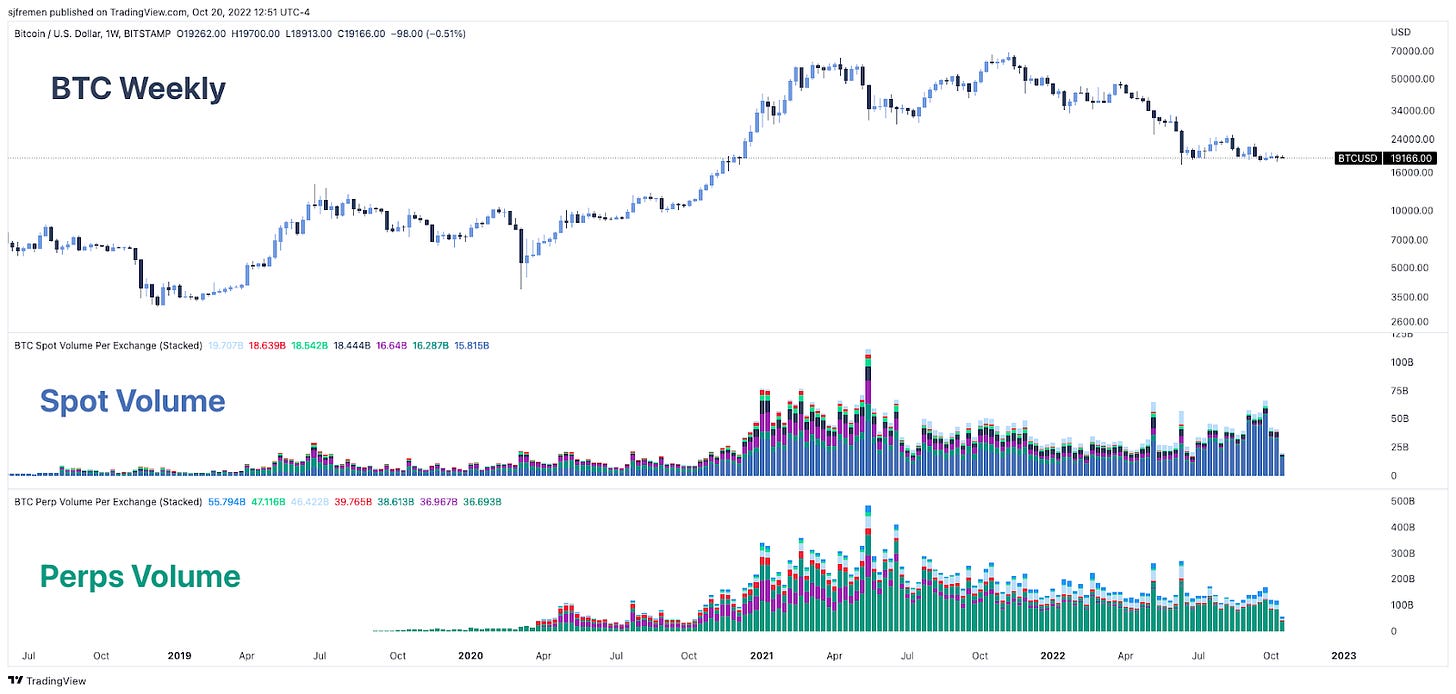
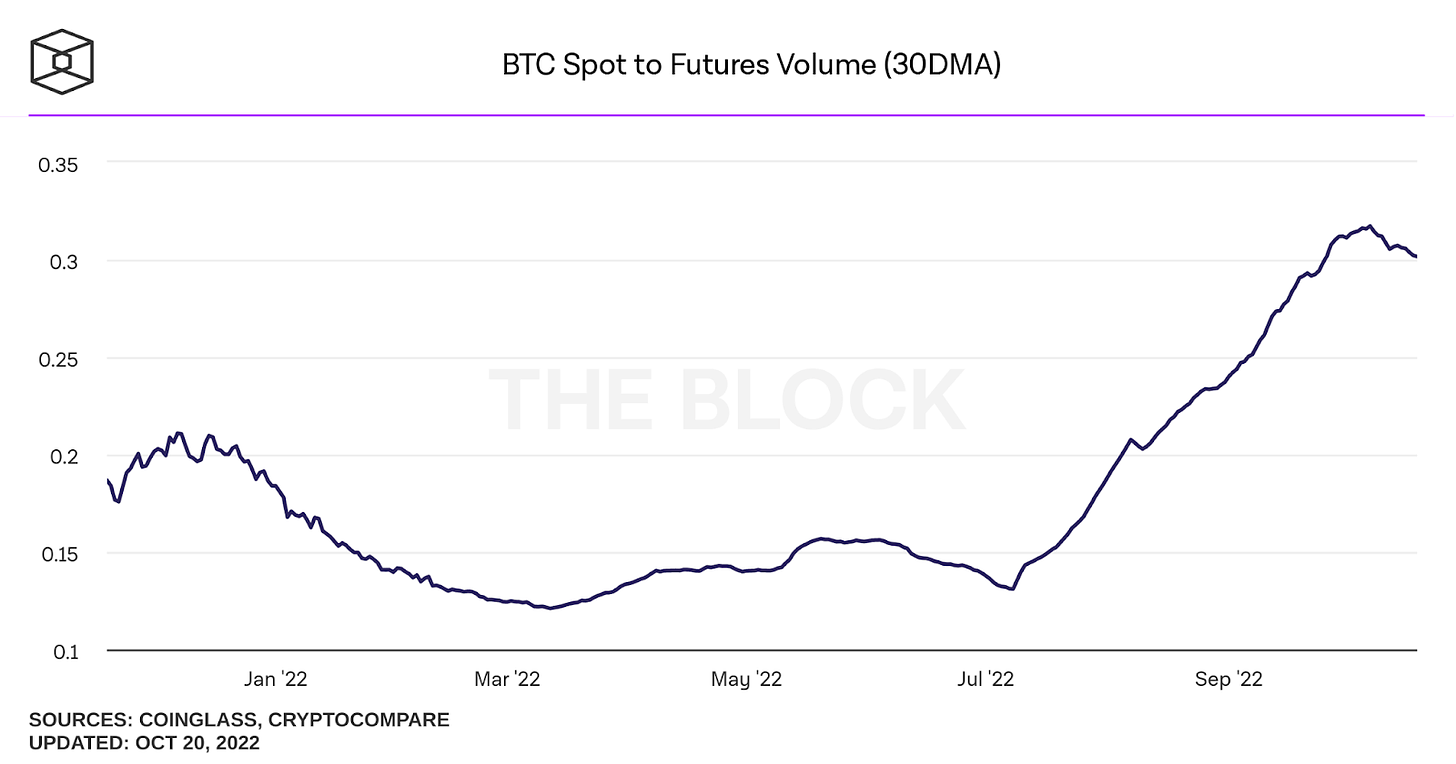
Given the above, we’d initially think we’re in a period of depressed spot volume as well but that’s not the case. Across weekly aggregated spot volume, we’ve seen a rise in activity in September that’s just starting to turn over. There’s a lot of interest and buildup in this range ($17,500 to $20,000) which both spot and perpetual futures volume show. Taking a ratio of the two, we can start to see the spot volume turnover relative to the futures volume in the market. Recall that the spot market is only a fraction of the derivatives market, lately around 30% but typically the perpetual market is five to one in size relative to spot.
Source: The Block
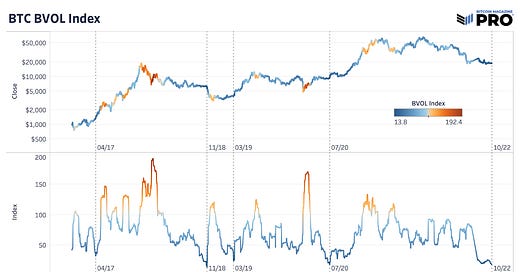
Yet, there’s still one concerning dynamic in the market right now: the lack of volatility. The high period of spot volume activity and relatively lower derivatives activity has really done little to move the price and bear markets are known for testing market participants’ patience when it comes to duration. We got some volatility with the most recent Consumer Price Index (CPI) inflation print, but bitcoin’s historical volatility is still at record lows.
Now, everyone wants to see this bitcoin price range break one way or the other; a larger range accumulation usually leads to a larger breakout move. It’s really something to see bitcoin’s historical volatility below the United Kingdom gilt market, but now it’s even below the average equity and bond ETF. This is when you know the market’s completely flipped around. Either that speaks to a lack of interest in bitcoin right now with a much larger move brewing or bitcoin’s entire asset profile has changed all of a sudden. We lean towards the former and history has shown that this record-low level of volatility doesn’t last long and has led to some pretty significant price breakouts and breakdowns.
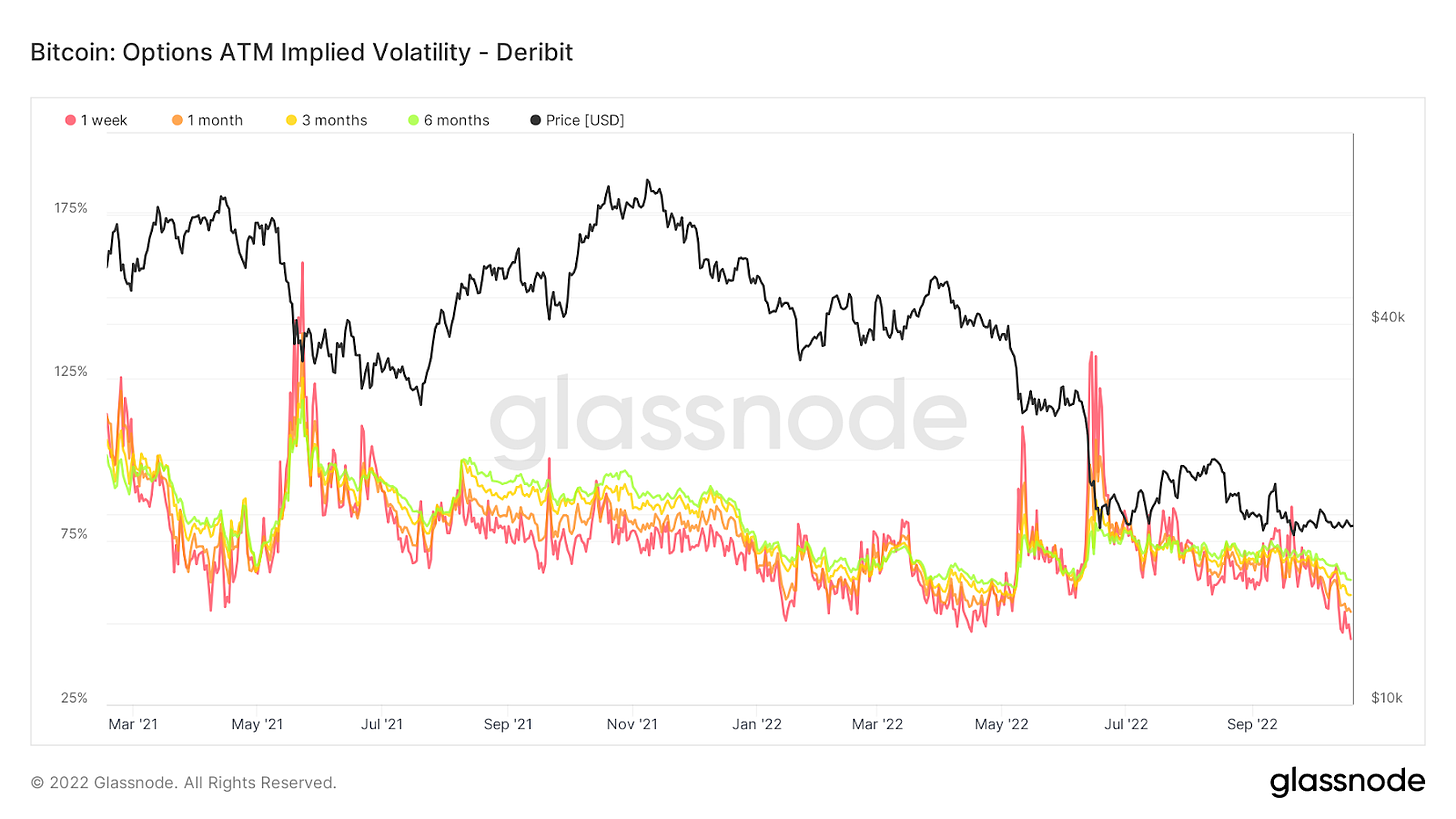
Even implied volatility in the market via options pricing is at some record lows (and falling) across different durations.
Source: Glassnode
In the four significant events of low-percentile historical volatility, we’ve seen three moves of upside breakouts and one significant down move to new lows back in 2018. It’s a small sample size from which to draw directional conclusions but a big move seems to be coming soon and the 2018 price analogue is one we’ve discussed before — especially given our expectations that the S&P 500 sees lower lows from here before this cycle is over. To quote a previous piece, “What To Expect When You’re Expecting Volatility”:
“While the lack of recent volatility in bitcoin could be a sign that much of the leverage and speculative mania of the bull market has been almost entirely washed out, our eyes remain on the outsized legacy markets for signs of fragility and volatility, which could serve as a short/intermediate-term headwind.”
This concludes “The Bitcoin Ghost Town”, published for our paid tier subscribers Thursday 10/20/22. You can access the original article by clicking the button below.
Try a 30-day free trial of the Bitcoin Magazine PRO paid tier to receive all of our articles in full as they go live.
Thank you for reading Bitcoin Magazine Pro, we sincerely appreciate your support! Please consider leaving a like if you enioyed this article. As well, sharing goes a long way toward helping us reach a wider audience!


