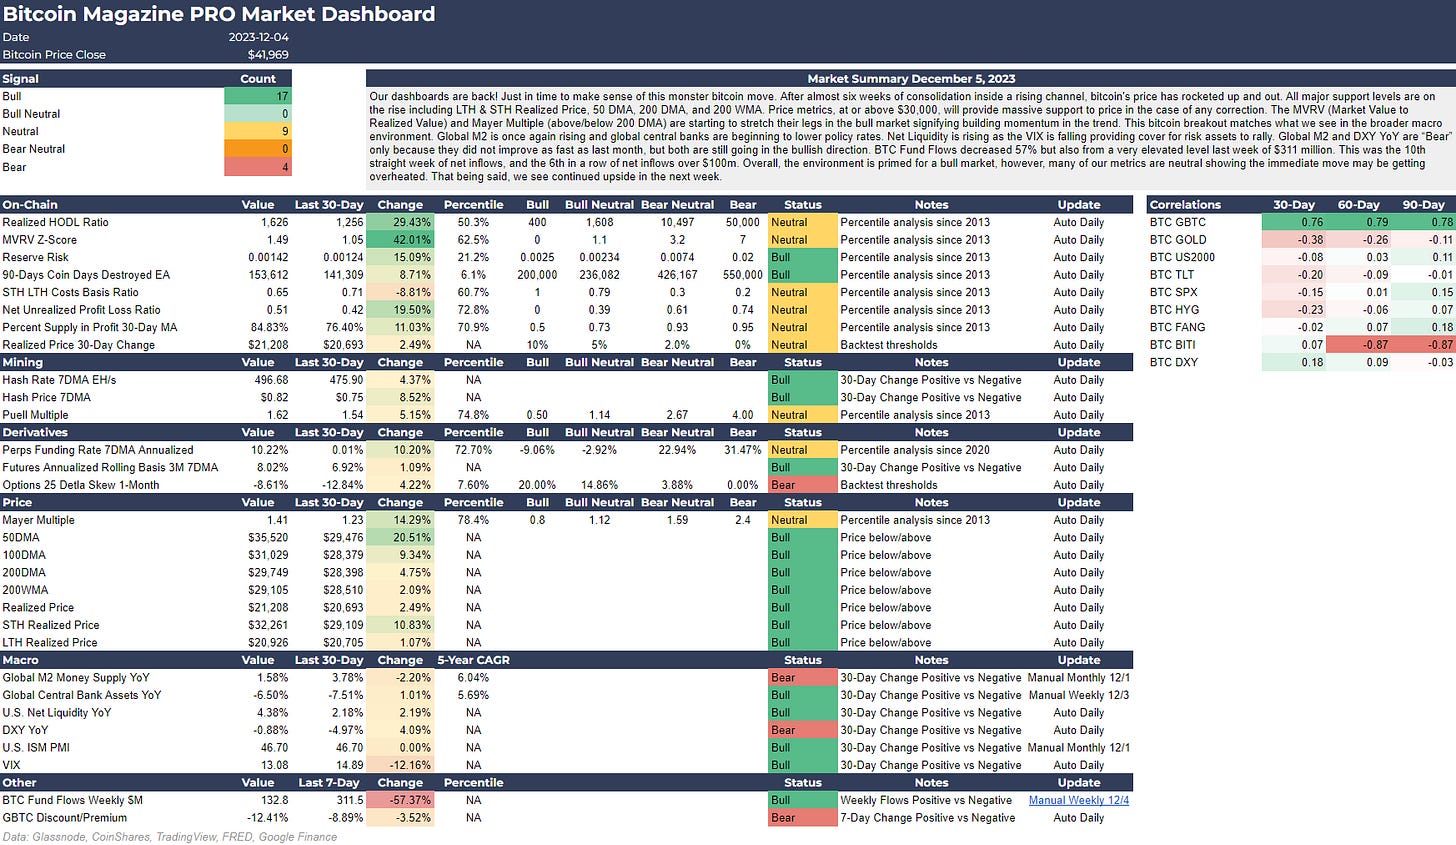
Markets Summary
Our dashboards are back! Just in time to make sense of this monster bitcoin move. After almost six weeks of consolidation inside a rising channel, bitcoin's price has rocketed up and out. All major support levels are on the rise including LTH & STH Realized Price, 50 DMA, 200 DMA, and 200 WMA. Price metrics, at or above $30,000, will provide massive support to price in the case of any correction. The MVRV (Market Value to Realized Value) and Mayer Multiple (above/below 200 DMA) are starting to stretch their legs in the bull market signifying building momentum in the trend. This bitcoin breakout matches what we see in the broader macro environment. Global M2 is once again rising and global central banks are beginning to lower policy rates. Net Liquidity is rising as the VIX is falling providing cover for risk assets to rally. Global M2 and DXY YoY are “Bear” only because they did not improve as fast as last month, but both are still going in the bullish direction. BTC Fund Flows decreased 57% but also from a very elevated level last week of $311 million. This was the 10th straight week of net inflows, and the 6th in a row of net inflows over $100m. Overall, the environment is primed for a bull market, however, many of our metrics are neutral showing the immediate move may be getting overheated. That being said, we see continued upside in the next week.


