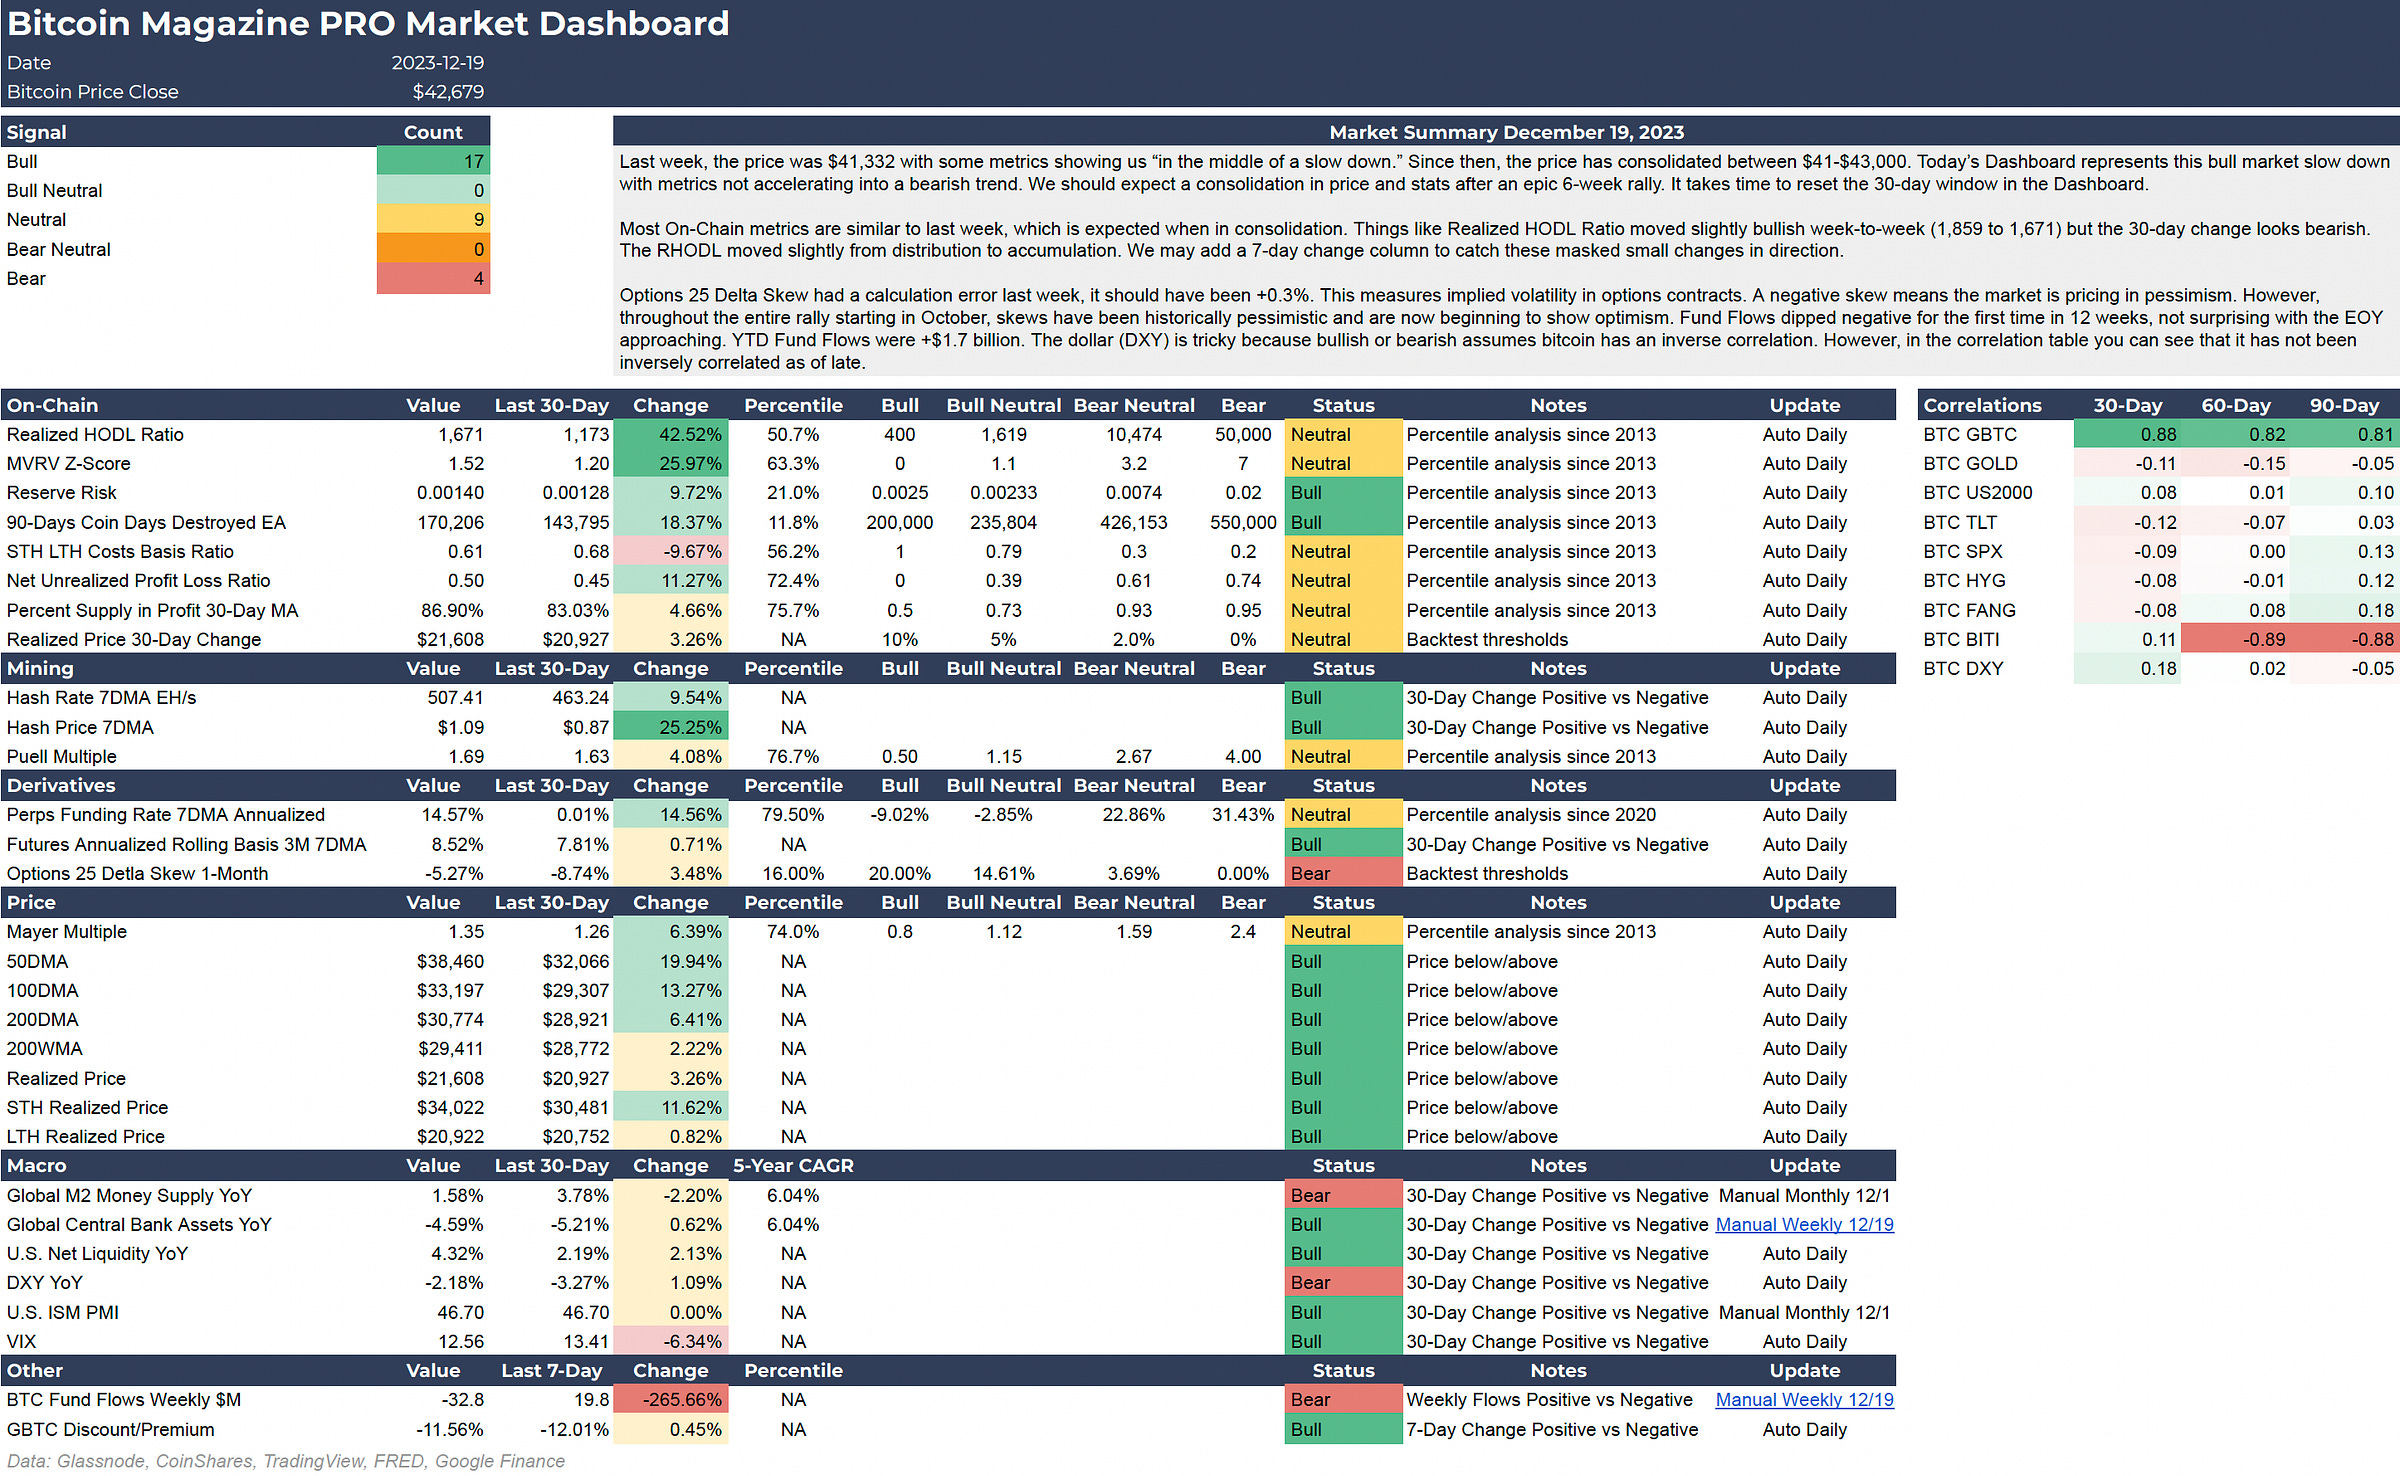
Last week, the price was $41,332 with some metrics showing us “in the middle of a slow down.” Since then, the price has consolidated between $41-$43,000. Today’s Dashboard represents this bull market slow down with metrics not accelerating into a bearish trend. We should expect a consolidation in price and stats after an epic 6-week rally. It takes time to reset the 30-day window in the Dashboard.
Most On-Chain metrics are similar to last week, which is expected when in consolidation. Things like Realized HODL Ratio moved slightly bullish week-to-week (1,859 to 1,671) but the 30-day change looks bearish. The RHODL moved slightly from distribution to accumulation. We may add a 7-day change column to catch these masked small changes in direction.
Options 25 Delta Skew had a calculation error last week, it should have been +0.3%. This measures implied volatility in options contracts. A negative skew means the market is pricing in pessimism. However, throughout the entire rally starting in October, skews have been historically pessimistic and are now beginning to show optimism. Fund Flows dipped negative for the first time in 12 weeks, not surprising with the EOY approaching. YTD Fund Flows were +$1.7 billion. The dollar (DXY) is tricky because bullish or bearish assumes bitcoin has an inverse correlation. However, in the correlation table you can see that it has not been inversely correlated as of late.


